Complex heterogeneity in HCC pateints, due to multiple etiological factors, implies that monotherapy targeting a single mechanism might not be sufficient for sustained clinical response as another compensatory signaling could get activated to develop drug resistance. Thus, combination therapies utilizing drugs, preferentially with different mode of action, might be clinically more satisfactory. Milciclib (PHA-848125AC), a pan-inhibitor of cyclin dependent kinases (CDKs: CDK1, CDK2, CDK4, CDK5 and CDK7) and c-Src kinase, has shown anti-cancer activity in tumor models as well as in clinical studies with cancer patients, including HCC. Here, we present data demonstrating anti-HCC activity of milciclib in cell lines as well as in two different animal models HCC. Importantly, milciclib exhibited synergistic anti-HCC effect with sorafenib, a first-line tyrosine kinase inhibitor (TKI) drug for HCC. Oral treatment with milciclib inhibited HCC tumor growth in TG221 mice, a miR-221-induced transgenic HCC model. We also developed an orthotopic model, by implanting human HCC cells (MHCC97-H) in liver of nude mice, in which tumor growth can be monitored by measuring serum levels of human α-fetoprotein (hAFP) but not mouse AFP. While milciclib or sorafenib alone inhibited tumor growth, the combination of these two drugs produced remarkable synergistic anti-HCC activity. Mechanism related tumor tissue analyses indicated that while milciclib and sorafenib inhibited their respective signaling pathways, these drugs interacted with each other to downregulate c-Myc to exert their synergistic anti-HCC activity. Our results suggest that milciclib may complement with a TKI to improve clinical outcome in advanced HCC patients.
hepatocellular carcinoma, tyrosine kinase inhibitors, sorafenib, cyclin dependent kinases, milciclib and c-Myc
Hepatocellular carcinoma (HCC) is the most common primary malignancy of the liver and a leading cause of cancer-related deaths worldwide [1,2]. Chronic liver inflammation resulting from prolonged viral hepatitis, nonalcoholic fatty liver disease, nonalcoholic steatohepatitis and other metabolic disorders such as excessive alcohol consumption and exposure to aflatoxins represent major etiological factors for HCC [1-3]. These multitude of underlying mechanisms that affect disease course and patient prognosis underscores the importance of a broad-spectrum approach to target multiple mechanisms underlying HCC development and promotion [4]. Current therapies for HCC include specific tyrosine kinase inhibitors (TKIs) such as sorafenib (Nexavar®), regorafenib (Stivarga®), lenvatinib (Lenvima®) and cabozantinib (Cabometyx®) [5-9]. In addition, immunotherapies with nivolumab (Opdivo®) and pembrolizumab (Keytruda®), both inhibiting programmed cell death receptor PD-1, have also been approved as second line treatment for advanced HCC [10,11]. Although these therapies have shown significant clinical benefits for HCC patients, but the clinical response rate is still low. Thus, there is an immediate need for drugs, preferentially with different mechanisms, which could be used in suitable combinations to complement existing therapies and to improve clinical outcome without compromising safety.
Milciclib, a small molecule pan inhibitor of multiple CDKs (CDK1, CDK2, CDK4 and CDK5), c-src kinase and wee 1 & 2 kinases, has shown efficacy in several tumor models [12,13]. Overexpression of miR-221 has been reported to be associated with hepatocarcinogenesis and other cancers in humans leading to downregulation of CDK2 inhibitor protein p27KIP1 [14-16]. In triple negative breast cancer xenograft mouse model, orally administed milciclib (40 mg/kg) resulted in inhibition of tumor growth and metastatic progression [16]. In two separate phase II clinical trials in patients with thymoma and thymic carcinoma, oral treatment with milciclib met both primary endpoint PFS-3 (progression free survival at 3 months) and secondary endpoint OS, respectively. Several patients received drug for over 5 years, suggesting that oral treatment with milciclib is well-tolerated, and it can be used for long-term duration as well [17].
The CDKs, key regulators in the progression of cell cycle, are known to be overexpressed in a variety of cancer types [18], possibly due to dysregulation in the retinoblastoma protein (pRb) pathway [18]. The downstream targets in the pRb pathway are members of the E2F transcription factor family that are critical regulator of cell cycle progression [19]. Thus, we conducted an exploratory phase I clinical trial with milciclib + gemcitabine combination in 16 patients with solid malignancies [20], who underwent multiple prior chemotherapies and were found to be refractory to all of the existing cancer drugs, including gemcitabine. The combination treatment was well-tolerated, and produced clinical responses in approximately 36% of patients, suggesting that milciclib was able to overcome resistance towards gemcitabine [20]. Since the microenvironment of the liver is highly vascularized and rich in nutrition, we believe xenograft models, involving the implantation of human HCC cells on the back of nude mice, might not be very accurate to predict the efficacy of HCC drugs [21]. Hence, we sought to develop a robust orthotopic HCC murine model with human MHCC97-H cells, which are highly metastatic and also produce human α-fetoprotein (hAFP), a tentative biomarker for HCC in humans. An important attribute of this model is that the growth of MHCC97-H derived tumor can be monitored by measuring hAFP. There seems to be a good correlation between tumor growth and hAFP levels, but not with mouse AFP. The effect of drug candidates can also be monitored qualitatively by measuring levels of hAFP in serum [22].
In this study, we report data suggesting that oral treatment with milciclib may have potential to be developed in combination with one of the TKI drugs to expand clinical response.
Chemical Inhibitors: Milciclib (PHA-848125AC, milciclib maleate) was synthesized at NerPharma, S.r.l. (Nerviano, Italy), sorafenib (Nexavar®), regorafenib (BAY 73-4506), and lenvatinib (E7080) were purchased from Adooq Bioscience (Irvine, CA).
Cell cultures: Human HCC cell lines were purchased from American Type Culture collection (ATCC) and cultured in Dulbecco’s Modified Eagle’s Medium (DMEM) (23). MHCC97H and MHCC97L were cultured in DMEM/F12 supplemented with 10% FBS, 1% pen-strep, and 1% glutamax under a humidified atmosphere of 5% CO2 at 37°C and harvested by trypsinization.
Cell proliferation assay: Cell proliferation assay was performed using WST-1 reagent (Sigma Aldrich, St Louis, MO) as described [23]. Briefly, HCC cells were seeded in rat collagen-coated 96-well plates at a density of 10,000 cells/100 µl/well and cultured for 24 h at 37°C in 5% CO2. Next day, the cells were treated with milciclib, sorafenib, regorafenib and lenvatinib individually or in combination in 100 µL of DMEM/F12 + 2%FBS. Cells were washed 3 times with sterile 1X PBS, followed by the addition of 10 μl of WST-1 reagent. Plates were incubated at 5% CO2 at 37°C and absorbance was read at 450 nm with a reference wavelength of 600 nm using Tecan F200 and iControl software. IC50 values were determined using GraphPad Prism (GraphPad Software, La Jolla, CA).
Apo-Tox Glo triplex assay: The MHCC97-H cells seeded at a density of 10,000 cells/100 µl in each well of a rat collagen-coated 96 well plate, were allowed to grow overnight in 5% CO2 at 37°C and then treated with milciclib either alone or in combination with sorafenib or lenvatinib or regorafenib for 48 hours. Promega ApoTox-Glo Triplex assay (Madison, WI) was used according to the manufacturer’s instructions to determine the number of viable cells, induction of apoptosis and cytotoxicity.
Transwell migration assay for epithelial to mesenchymal transition (EMT): MHCC97H cells were seeded in the top chamber in 6-well Transwell plates (Sigma-Aldrich, St Louis, MO) at a density of 100,000 cells/500 µL/well in standard culture media containing 100X StemXVivo® EMT inducing media with supplement (R&D systems, Minneapolis, MN) and plates were incubated overnight at 37 °C in humidified CO2 incubator. The next day, media was removed and fresh EMT inducing media containing vehicle or test articles were added. Plates were incubated for 10 days with media changes every 3 days. On the 10th day, the number of cells migrated to the lower chamber was determined using Bio-Rad (Hercules, CA) automatic cell counter. Values obtained were normalized to uninduced samples and expressed as a percent cell migration.
Micro RNA 221 induced HCC mouse model (TG221): TG221 mice were kindly provided by Prof. M. Negrini, Univeristy of Ferrara, Italy. Experimentation with the transgenic TG221mice (B6D2F2 background) was performed in accordance with the authorized facility of Nerviano Medical Srl, Italy under the Italian Ministry of Health authorization number 192/2009-A, D.L.116-92. Transgenic male mice overexpressing miR-221 (10-12 days old) that were administered one intraperitoneal (IP) injection (7.5 mg/kg) of diethylnitrosamine (DEN) resulted in measurable tumor development (100% tumor incidence) at about 20-30 wks of age. The MRI scanning was performed for pre-treatment for randomization and post treatment to assess tumor growth. Milciclib was administered by oral gavage (40 mg/kg BID) for 10 days. Magnetic resonance imaging (MRI) was performed with a 7.0 T Bruker Pharmascan to follow tumor growth. For evaluation of therapeutic efficacy, % tumor growth [(tumor volume day X- tumor volume day 0) *100/tumor volume day 0] of 2 or 3 lesions per animal were considered.
Orthotopic tumor induction in athymic nude mice: Experiments were performed in accordance with the guidelines approved by the Institutional Animal Care and Use Committee of Washington Biotechnology Inc (Baltimore, MD). Food and water were given ad libitum and mice were housed following animal handling procedures as per the NIH guidelines and approved IACUC protocol. Each mouse was ear-tagged to monitor growth by measuring hAFP levels in serum. Test agents were dissolved in chremophor/ethanol (1:1) to make a 5X stock solution and diluted in the water when used. MHCC97H (5X10⁶) in chilled PBS were mixed with 20% Matrigel in chilled PBS (Geltrex, ThermoFisher, Rockford, IL) and then inoculated orthotopically into the left liver lobe of female Balb/c nude mice. Blood levels of hAFP were measured weekly to monitor tumor growth. Mice with similar hAFP levels were randomized on day 10th after cells implantation. Following groups (n=12) were used: 1, vehicle; group 2, milciclib 30 mg/kg, group 3, sorafenib at 20 mg/kg; and group 4; combination of milciclib (30 mg/kg) and sorafenib (20 mg/kg). Drugs were thawed on the day of use and administered 200 µL once a day by oral gavage in the morning. At the end of the study on 35th day, mice were euthanized by C02 asphyxiation followed by cervical dislocation. Tissues from 3 mice were immediately snap frozen in liquid N2 for analyses of miRs and gene expression profiling. Photographs of the remaining mice showing tumors were taken and tissues (tumor tissues and the surrounding normal liver) were collected, cleaned, snap-frozen in liquid nitrogen and stored at -80°C for further analyses. Blood was collected from all mice via retro-orbital sinus bleed, processed to sera and used for hAFP measurement.
miRNA isolation and expression analysis: Total RNA was isolated from tumor and surrounding liver tissues and used for miRNA analysis using the mirVana miRNA Isolation Kit followed by TaqMan Advanced miRNA cDNA Synthesis Kit (Thermo Fisher Scientific, Rockford, IL) according to the manufacturer’s instructions. The PCR mixture was incubated at 95°C for 20 seconds, followed by 40 cycles of 95°C for 3 seconds and 60°C for 30 seconds. Results were normalized to hsa-miR-192-5p as reference miRNA and the relative gene expression calculated as 2 −ΔCT was expressed as fold increase over control samples.
Reverse transcription and quantitative real-time PCR: Total RNA was extracted using the RNeasy Mini kit according to the manufacturer’s instructions (Qiagen, Germantown, MD). RNA was quantified using Nanodrop Lite (Thermo Scientific, Wilmington, DE). Complementary DNA (cDNA) synthesis was performed by reverse transcription of total RNA using the High Capacity cDNA Reverse Transcription Kit (Thermo Fisher Scientific, Rockford, IL). Real-time quantitative PCR was employed using the LightCycler 480 Instrument II (Roche Diagnostics Corporation, Indianapolis, IN) using TaqMan Fast Advanced Master Mix and TaqMan Gene Expression probes for human p27, cyclin E2, MKI67, cyclin D1, p21, p57, c-Myc and p53 (Thermo Fisher Scientific). The expression of target genes was normalized to the housekeeping gene GAPDH in each sample. All samples were run in triplicates and the relative gene expression calculated as 2 −ΔCT was expressed as fold increase over control samples.
Western blotting: The tumor tissues were weighed and homogenized with RIPA lysis buffer (Sigma-Aldrich, St. Louis, MO) and protease inhibitor cocktail (Sigma-Aldrich, St. Louis, MO) and lysates were prepared [24]. Protein concentration was determined using Bradford reagent, equal amounts of protein (30 µg) were resolved on SDS-PAGE gels and immunoblotting was performed using the procedure as described [24]. Commercially available antibodies against human PTEN, human AKT and phospho-AKT (Ser473 and Thr308), human c-Myc, human cyclinD1, cyclin E2, mTOR and human β-actin (Cell Signaling Technology, Beverly, MA) were used for immunoblotting. The immunoreactive bands were visualized using Image Studio 4.0-Western Analysis Ribbon (Li-Cor, Lincoln, NE).
Statistical analysis: GraphPad Prism 6.0 software (La Jolla, CA) was used for all statistical analysis. Differences between the groups were statistically evaluated using the unpaired Student’s t-test and the results are presented as the mean ± standard deviation (S.D.). P-values of <0.05 were considered statistically significant.
Anti-proliferative effect of milciclib and TKIs on HCC cells
Initially a set of experiments were conducted to determine IC50 values of milciclib, sorafenib, lenvatinib and regorafenib to inhibit proliferation, induce apoptosis and to delay wound healing in HepG2.215, MHCC97-H (high metastatic) and MHCC97-L (low metastatic) cells, which were derived from a patient with metastatic HCC [24]. Anti-HCC activity of milciclib was comparable in HepG2.215 and MHCC97-H cells. However, we selected MHCC97-H for further experiments because this cell line is highly tumorigenic and metastatic, and it produces hAFP. The anti-proliferative activity of milciclib and TKIs correlated well with hAFP levels in the culture media of MHCC97-H. We evaluated the effects of milciclib, sorafenib, lenvatinib and regorafenib either as single agent or in combination on proliferation, apoptosis and cytotoxicity using ApoTox-Glo Triplex assay (Promega). As shown Supplement Figure 1, milciclib and all TKIs inhibited proliferation, induced apoptosis and reduced cell viability. The individual IC50 values for anti-proliferative activities of milciclib (1.3 µM), sorafenib (12.0 µM), lenvatibib (0.5 µM) and regorafenib (4.7 µM) were determined. Subsequently, milciclib at IC50 (1.3 µM) was evaluated with increasing concentrations of either sorafenib or lenvatinib or regorafenib in this assay. Milciclib reduced IC50 values of each of the TKIs by more than 50%, suggesting that milciclib may act synergistically with TKIs. To evaluate synergism, a matrix dose-range of milciclib (0.0, 0.2, 0.4, 0.8, 1.3, 3.1, 6.3 and 12.5 µM) was combined with incremental concentrations of sorafenib (0.0, 2.0, 4.0, 6.0, 10.0, 12.0, 14.0, 16.0 and 20.0 µM) or lenvatinib (0.0, 0.05, 0.1, 0.2, 0.3, 0.5, 0.6 and 0.7 µM) or regorafenib (0.0, 0.1, 0.2, 0.4, 0.8, 1.6, 3.1, 6.3, 12.5 and 25.0 µM) and their effect on proliferation of MHCC97-H cells was examined. In subsequent experiment, concentration range of each agent was reduced to derive accurate individual IC50 values as shown in Figure 1a (I-III). Combination of milciclib with either of the TKIs considerably reduced IC50 values of each of the TKIs by more than 50%. For example, 50% inhibition in cell proliferation was recorded approximately at milciclib (0.35 µM) + sorafenib (6.0 µM), milciclib (0.25 µM) + lenvatinib (0.1 µM) and milciclib (0.25 µM) + regorafenib (1.8 µM). Similar synergistic effects on proliferation of MHCC97L and HepG2.215 cell lines were also observed (data not shown). Because mechanism of actions for the anti-proliferative activities of milciclib and TKIs are different, it is possible that underlying mechanisms complement each other to produce the observed synergistic effects.
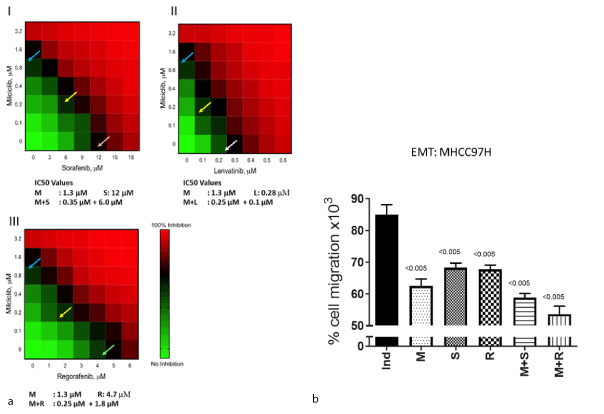
Figure 1. (a) Synergistic anti-proliferative activity of milciclib with a tyrosine kinase inhibitor in MHCC97H cells. The anti-proliferative activity is depicted by heat map for combination of milciclib with I) sorafenib, II) lenvatinib and III) regorafenib. The IC50 concentrations are indicated individually for milciclib, sorafenib, lenvatinib and regorafenib by blue, orange, white and green arrows. The IC50 values for combination treatment are shown as yellow arrows. Assays were conducted in triplicates and average values were used to draw the heat map. The assays were repeated three times. (b) Effect of milciclib, sorafenib, and regorafenib on Epithelial to Mesenchymal Transition of MHCC97H cells: MHCC97-H cells were seeded in the top chamber in the 6-well Transwell plates (Sigma-Aldrich, St Louis, MO) at a density of 100,000 cells/500µL/well in standard culture media containing 100X StemXVivo® EMT inducing media with supplement (R&D systems, Minneapolis, MN) and plates were incubated overnight at 37 °C in humidified CO2 incubator. Next day, media was removed and fresh EMT inducing media containing vehicle or test articles was added and plates incubated for 10 days. On the 10th day, the number of cells migrated to the lower chamber was determined using Bio-Rad (Hercules, CA) automatic cell counter. Values obtained were normalized to uninduced sample and expressed as a percent cell migration. Ind: induced, M: milciclib (1.3 µM), S: sorafenib (12 µM), R: regorafenib (4.7µM), M+ S: milciclib (1.3 µM) + sorafenib (12 µM) and M+ R: milciclib (1.3 µM) + regorafenib (4.7 µM)
Milciclib suppresses invasion and cell migration in HCC cells
Next, we evaluated the effect of milciclib either alone or in combination with a TKI on EMT using the Transwell invasion chambers coated with Matrigel. In this assay, predetermined IC50 concentrations of milciclib (1.3 µM), sorafenib (12 µM), and regorafenib (4.7 µM) were used. Data presented in Figure 1b show that milciclib and each of the TKIs restricted cell invasion through the membrane, but the combination of each of the TKIs with milciclib resulted in more pronounced effect on cell transition and mobility. This observation was further confirmed by assessing the ability of milciclib and TKIs either alone or in combination to inhibit wound healing following generation of linear wound (scratch) in confluent cell monolayer. Our results indicated that as compared to control cells, wound closure delay was greater for cells treated with a combination than those treated with individual drugs monitored upto 72 hours of incubation (data not shown).
Milciclib treatment inhibits tumor growth in a murine model of miR221-induced HCC
Newborn TG221 transgenic mice (10-12 days age), when treated with an injection of diethylnitrosamine (DENA), develop liver tumor lesions that could be detected by MRI between 20 and 30 weeks of age. To facilitate MRI analysis, an injection of Endorem (an iron-based contrast agent) was administered to enhance contrast between the tumoral masses (white spots) and the healthy liver parenchyma. Mice with grown tumors were randomized and treated twice a day for 8 days either with vehicle (control) or with milciclib (40 mg/kg bid). Pictures of MRI images of livers in pre and post-treatment were recorded. As shown in Figure 2A, the pre-treatment MRI images were similar in both control and milciclib cohorts. The numerical values of MRI score in mice prior to treatment was considered as 100%. The tumors in mice further grew rapidly reaching an average MRI score of 150% at the end of 8 days of treatment with vehicle. By comparison, the MRI score in mice treated with milciclib was reduced by approximately 70% as compared to vehicle-treated mice (Figure 2B), suggesting that milciclib inhibited tumor growth possibly through downregulation of miR-221.
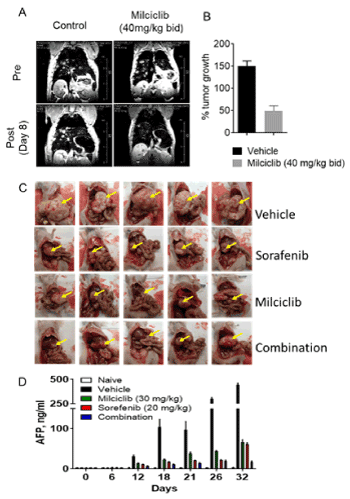
Figure 2. Anti-HCC activity in two murine models. (A) Oral treatment was evaluated in the miR-221-induced HCC model (TG221). Representative pre and post treatment MRI images of vehicle-treated or milciclib-treated (40 mg/kg BID for 8 days) are shown. (B) Quantitative analysis based on the MRI score of tumor growth in vehicle- and milciclib-treated mice are plotted and shown as bar chart. (C) Synergistic anti-HCC activity of milciclib with sorafenib in an orthotopic HCC model in athymic nude mice. Mice with orthotopically transplanted MHCC97-H cells were randomized based on the hAFP levels in serum on 10th day in to 4 groups (n=12). Once daily treatment was administered by oral gavage with vehicle, sorafenib (20 mg/kg), milciclib (30 mg/kg) or combination. Suboptimal doses of milciclib and sorafenib were used either alone or in combination. Normal liver and tumor tissues from 3 representative mice in each group were immediately removed and snap frozen in liquid N2 for later analysis. Representative pictures of the 5 mice are shown. (D) Effect of treatments on serum hAFP levels. Approximately 100 µL blood was collected at different times, as indicated and serum hAFP levels were measured with an ELISA specific for hAFP. All measurements were conducted in triplicates and average ± SD are shown. The tumor growth and drug effects did not alter mouse AFP in this model
Milciclib treatment inhibits tumor growth in an orthotopic murine model of human HCC
The growth of orthotopic tumors, as assessed by increase in hAFP level in bood, occurs immediately after MHCC-97H implantation, detected around day 12. Mice with tumors begin to die around day 35. At day 12, mice with similar hAFP were randomized in four groups (n=12) and treated with vehicle (V), sub-optimal doses of milciclib (M; 30 mg/kg/day) and sorafenib (S; 20 mg/kg/day) and combination of Milciclib with sorafenib (M+S). The selected suboptimal doses of milciclib and sorafenib were based on the results from our prior pilot study in this murine orthotopic HCC model. As shown in representative pictures of tumors in Figure 2C, all mice in the vehicle group showed large globular tumors. A few mice treated with vehicle also had multiple tumors, possibly due to intrahepatic metastasis. We could not accurately determine tumor volume or weight because most of the tumors were deeply embedded in liver tissues and were not completely excisable. Nevertheless, the sizes, as shown in pictures, of tumors in the single agent groups of milciclib and sorafenib appeared to be less than 40-50% as compared the vehicle group. Treatment with combination of milciclib and sorafenib further reduced tumor growth at least by 70-90% as compared to vehicle group. The effect of combination treatment with milciclib and sorafenib was quite prominent in all mice, except that one of the mice was clearly an outlier as the liver tumor in this mouse was much larger than the rest of the mice. None of the mice either in single agent or combination treated groups showed multiple tumors. As there is good qualitative correlation of hAFP with tumor growth, levels of hAFP in serum were measured to assess treatment effect. As shown in Figure 2D, the naïve mice without liver tumors showed negligible levels of hAFP. As expected, the serum level of hAFP increased exponentially following implantation of MHCC97-H cells. At the end of the study, the hAFP levels in mice treated with either milciclib or sorafenib as single agents were reduced by more than 60-70% as compared to those observed in the vehicle-treated mice. Interestingly, the hAFP levels in mice treated with the combination of milciclib and sorafenib were reduced by >95%. Taken together, these results suggest that the combination of milciclib with sorafenib might synergistically inhibit tumor growth in this orthotopic animal model of human HCC.
Milciclib suppresses tumor growth possibly via downregulation of miR-221
The oncogenic functions of miR-221 in regulation of HCC cell proliferation, apoptosis and in development of resistance towards drug treatment is well documented [15,25,26]. In this context, Park et al., demonstrated therapeutic efficacy by blocking miR-221 in an orthotopic mouse model of HCC, suggesting miR-221 as a target in patients with HCC [25]. These findings are consistent with miR-221-induced transgenic HCC mouse model, in which anti-miR-221 systemic treatment reduced number and size of HCC nodules [27]. Thus, it was of interest to determine the effect of treatment on miRs expression in tumor and normal liver tissues in this study. While sorafenib alone did not show significant effect on miR-130a, miR-122, miR-221 and miR-222 expression, treatment with milciclib alone resulted in significant upregulation of miR-130a, miR-122 and downregulation of miR-221 and miR-222 (Figures 3A-3D). The combination of milciclib with sorafenib did not significantly change expression of these miRs further as compared to milciclib alone treatment.
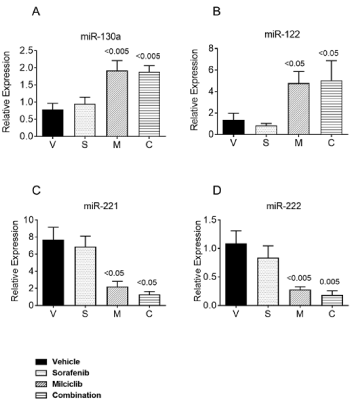
Figure 3. Analysis of miRs relevant to mechanism of milciclib in tumor tissues. Snap frozen tumor tissues from 3 mice from each groups vehicle; V, sorafenib; S, milciclib; M and C; combination milciclib with sorafenib were processed for RNA isolation, followed by RT-PCR to measure transcript levels of A) miR-130a, B) miR-122 C) miR-221and D) miR-222. All tissue samples were run in duplicates from 3 tumor sample. Results are expressed as an average ± SD
Combination of milciclib with sorafenib synergistically downregule c-Myc
Previous studies have documented that miR-221 and miR-222 are located on chromosome X in human and mouse genomes and are transcribed as single transcript. Upregulation of these miRs inhibit key tumor suppressors, including p27 (Kip1-CDKN1B), p57 (Kip2-CDKN1C), PTEN, TIMP3, PUMA and mTOR modulator [28-31]. Thus, we examined relative transcript levels of CDKN1B/p27, CDKN1C/p57, cyclin D1, cyclin E2, p21Waf1, and c-Myc in tumor tissues (Figure 4). Milciclib treatment alone significantly upregulated both p27 and p57, whereas sorafenib upregulated only p27. Interestingly, the combination of milciclib and sorafenib resulted in significant upregulation of both p27 and p57 (Figures 4A and 4B). Sorafenib did not show significant effect on cyclin D and cyclin E2. On the other hand, milciclib significantly downregulated both cyclins (Figures 4C and 4D). Combination treatment did not result in additional modulation. It is known that the D-type cyclins and cyclin E play a key role in promoting pRb protein hyperphosphorylation, which results in cell cycle progression via assembling with CDKs to form cyclin-CDK complexes [32,33]. Consistent with this notion, downregulation of cyclin D1 leads to inhibition of MHCC97H cells viability [34]. These results suggest that milciclib is primarily acting through cell cycle arrest. Sorafenib treatment showed no or little direct effect on cell cycle regulation, which is consistent with its biochemical mechanism of action via inhibition of RTK signaling. However, sorafenib is also known to induce autophagy, which could also suppress cell proliferation and inhibit tumor growth [35].
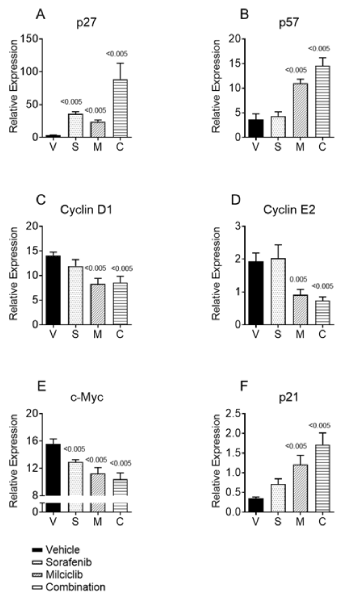
Figure 4. Transcript levels of cell cycle regulators in tumor tissues: Snap frozen tumor tissues from 3 mice from each groups vehicle; V, sorafenib; S, milciclib; M and combination milciclib with sorafenib, C, were processed to isolate total RNA, followed by RT-PCR analysis using the LightCycler 480 Instrument II (Roche Diagnostics Corporation, Indianapolis, IN) using TaqMan Fast Advanced Master Mix and TaqMan Gene Expression probes for human A) p27, B) p57, C) cyclin D1, D) cyclin E2, E) c-Myc and F) p21. The expression of target transcripts was normalized to the housekeeping gene GAPDH in each sample. RT-PCR analysis was conducted in triplicates and results are expressed as an average relative expression ± SD
Next, we examined transcripts of c-Myc and p21 in tumor tissues to further understand as to how milciclib and sorafenib combination may exert the observed synergistic anti-proliferative activity. As shown in Figure 4E, both milciclib and sorafenib, as single agents, downregulated c-Myc transcript and upregulated transcript of p21. The effect of sorafenib alone appeared modest as compared to milciclib. However, combination of sorafenib with milciclib downregulated c-Myc and upregulated p21 more strongly than either of the drugs alone.
Effect on expression of cell cycle regulators and tumor suppressor proteins
We examined immunoreactive levels of a select key proteins involved in signaling of receptor tyrosine kinase (Figure 5A) and CDKs (Figure 5B) pathways to assess the effects of treatments. As shown, sorafenib alone strongly inhibited phosphorylation of AktS473, AktThr308 and mTOR, but milciclib did not show any significant effect on this axis. Interestingly, milciclib upregulated PTEN, a tumor suppressor downregulated by c-Myc upregulation [36]. This observation is consistent with the data shown in Figure 4E and Figure 5B that milciclib treatment strongly downregulated c-Myc at the level of transcript as well as at immunoreactive protein level. Cyclin D1 and cyclin E2 expression were markedly decreased in tumor tissues from milciclib treated mice but sorafenib effect was less pronounced. However, combination of milciclib with sorafenib showed negligible levels of these proteins.
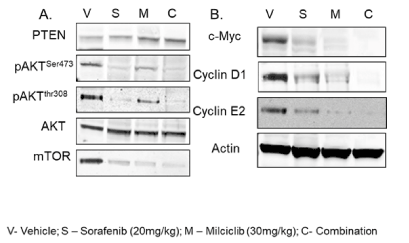
Figure 5. Mechanistic immunoblotting analysis of related proteins in tumor tissues: Approximately, 1 g portions of the snap frozen tumor tissues from 3 mice from each groups, vehicle; V, sorafenib; S, milciclib; M and combination milciclib with sorafenib, C, were thawed directly in RIPA buffer containing protease inhibitor cocktail and lysates were prepared (see methods). Equal quantity of protein (30 µg) in each sample was resolved on SDS-PAGE gels, transferred on PVDF membranes and subjected to immunoblotting with commercially available antibodies for RTK signaling A) PTEN, phospho-Akt (Ser473, Thr308), total Akt and mTOR proteins and for cell cycle signaling (B) cyclin D1, cyclin E2 and c-Myc. Actin was used for internal monitoring of equal protein loading
In this study, we report data from cell cultures and two different animal model experiments demonstrating that oral treatment with milciclib has the potential to be developed either as monotherapy or in combination with a TKIs for treating HCC. The anti-proliferative and EMT data suggests that milciclib exhibits potent anti-proliferative activity in HCC cell lines and in combination with a TKI produces a pronounced synergistic effect on inhibition of cell proliferation and on induction of apoptosis. Oral treatment with milciclib strongly inhibited tumor growth in miR-221 induced HCC model in TG221 transgenic mice [31]. Combination of milciclib with sorafenib showed pronounced synergistic anti-tumor activity in an orthotopic model of HCC. In this animal model, sub-optimal doses of milciclib and sorafenib were used to assess the synergistic or additive effects of the combo treatment. The data shown in Figures 2C and 2D clearly indicated that while milciclib and sorafenib alone significantly reduced tumor growth along with hAFP levels even at the sub-optimal doses, combination of these two agents outperformed either of these single agents. This synergistic effect was much more evident from the results on reduction in hAFP levels.
Studies have shown that upregulation of miR-221 might be associated with not only tumor growth and promotion, but also with development of sorafenib-resistance in HCC patients [27,37]. The data showing inhibition of tumor growth in TG221 mice, a miR-221-induced HCC model [30], suggest that milciclib might be acting through downregulation of miR-221. In this context, oral treatment with milciclib downregulated expression of miR-221 & miR-222 and upregulated miR-130a & miR-122 in tumor tissues from the orthotopic HCC model (Figures 3A-3D). Sorafenib treatment as single agent did not exhibit an appreciable effect on expression of these miRs. Taken together, these in vitro and in vivo results suggest that milciclib might exert its anti-HCC activity, in addition to the direct inhibition of CDKs, specifically through downregulation of miR-221.
Since, overexpression of miR-221 is also known to suppress a number of key tumor suppressors, including the natural inhibitors CDKs p27Kip1, p57Kip2 and PTEN [25] and upregulate prooncogenic c-Myc [38], it was of interest to examine the effect of oral treatment with milciclib and sorafenib either alone or in combination on the expression of these cell cycle regulators. Consistent with their respective mode of actions, milciclib as single agent significantly upregulated p27 and p57 and downregulated cyclin D and E in tumor tissues, whereas with the exception of p27, sorafenib did not exhibit a profound effect on the transcript levels of these cell cycle regulators. Interestingly, the combination of milciclib and sorafenib showed significantly more effect on downregulation of c-Myc and on upregulation of p21 as compared to treatment with either agent alone, raising the possibility that these two drugs might be interacting with each other at c-Myc and/or p21 level.
Reduced expression of p21, a natural inhibitor of CDK and an important regulator of cell cycle, is known to be associated with carcinogenesis. It is also well-established that activation of protooncogene c-Myc leads to downregulation of p21. On the other hand, growth factors mediated activation of the PI-3 kinase-Akt-mTOR pathway leads to downregulation of p21, a tumor suppressor [39,40]. In line with these findings, our data indicated that oral treatment with milciclib or sorefenib downregulated c-Myc and upregulated p21 both at transcript and at protein levels, possibly through different mechanisms as the combination of these two agents produced a synergistic effect. During carcinogenesis overabundance of pro-tumorigenic growth factors might activate AKT, promoting translocation of p-AKT to the nucleus, where p21 is then phosphorylated, thus promoting cell growth and inhibition of apoptosis. Conversely, the inactivation of AKT stabilizes and upregulates p21 in the nucleus, resulting in the inhibition of cell growth and promotion of G1/S arrest [41].
Based on our findings as well as supporting published literature, we hypothesize that the observed synergism between milciclib and sorafenib for the anti-HCC effect might be through their interaction at the c-Myc expression level (Figure 6). Data supporting this hypothesis include the following: 1) milciclib treatment downregulated miR-221, miR-222 and upregulated miR-130a and miR-122 but treatment with sorafenib alone did not affect expression of either of these miRs significantly in tumor tissues, 2) treatment with milciclib alone suppressed expression of cyclin D and E, 3) while sorafenib inhibited activation of PI-3 kinase/Akt axis more strongly than milciclib, but milciclib treatment upregulated the protein level of PTEN and sorafenib showed no effect, 4) combination of milciclib and sorafenib upregulated cell cycle regulators such as p21, p27 and p57 more markedly than either of the drugs alone. Lastly, the combination of sorafenib and milciclib produces more pronounced effect on downregulation of c-Myc than either drug alone.
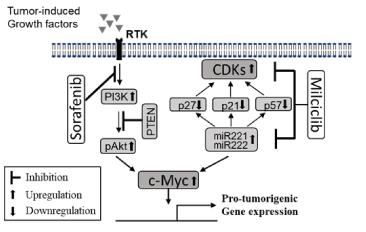
Figure 6. A possible mechanism underlying the synergistic anti-HCC activity of milciclib with sorafenib. During hepatocarcinogenesis the receptor tyrosine kinase (RTK) signaling is activated in the presence of excessive production of pro-tumorigenic growth factors and cytokines. Conssequently, the PI-3-K/Akt axis is upregulated and PTEN, a tumor suppressor, is downregulated, resulting in upregulation of the pro-oncogenic c-Myc. Sorafenib inhibits this RTK signaling pathway. On the other hand, overexpression of miR-221/miR-222 downregulates p21, p27 and p57, the physiological inhibitors of cyclin-dependent kinases (CDKs), and upregulates CDKs. Based on our data and published findings, it is likely that the treatment with milciclib downregulated miR-221 and downstream signaling resulting in upregulation of p21, p27 and p57. Although milciclib alone also downregulates c-Myc expression, but combination of milciclib and sorafenib downregulated c-Myc more effectively to resulting
Typically, HCC is caused by multiple etiological factors with different underlying mechanisms. It is also reasonable to hypothesize that inhibition of one specific mechanism might activate a compensatory signaling resulting in development of drug-resistance [42,43]. Therefore, combination therapies utilizing drugs preferentially with different mechanism of actions could be more effective. This could very well be one of the possible explanations that HCC patients develop resistance to almost every single chemotherapy drug [44]. Sorafenib and other TKIs remain the standard systemic treatment for advanced hepatocellular carcinoma, blocking multiple kinases while stimulating Akt phosphorylation [45]. Attempts to combined sorafenib and Akt signaling inhibitor have been successfully made demonstrating better anti-tumor effects than sorafenib alone in HCC [46-48]. Because sorafenib inhibits the downstream RTK signaling involving PI-3 kinase/Akt axis, it is conceivable that a drug candidate with a completely different mechanism of action might produce better clinical outcome. We previously reported that combination of milciclib with gemcitabine produced 36% clinical response rate in patients with solid malignancies who were refractory to all of the existing chemotherapies [20].
Recent clinical data from a phase 2a trial in sorafenib-resistant HCC patients indicated that the treatment with milciclib was well-tolerated and drug related toxicities were manageable. Importantly, oral treatment with milciclib (100 mg capsule once a day; 4 days ON/3 day OFF cycle) showed promising clinical activity in these patients. Fourteen out 28 (50%) patients completed the 6-month duration of the trial and 9 out of these 14 patients continued the treatment under compassionate use. Five of these patients completed between 10-16 months of treatment and 4 patients still continuing with the treatment are in their 10-13th months of treatment (Tiziana Life Sciences September 4, 2019 Press Release). The progression free survival (PFS) and the time to progression (TTP) was 5.9 months out of the 6-months of trial duration. As per the protocol, the clinical data from patients under compassionate program was not collected. Considering that sorafenib-resistant patients are worst cases of HCC with poor prognosis, these clinical data are encouraging and warrant further development of milciclib for HCC treatment. We believe milciclib might be a suitable partner for combination with one of the TKIs for treatment of HCC.
KS and VAP are employess of Tiziana Life Sciences.
- Forner A (2018) Hepatocellular carcinoma. Lancet 391: 1301-1314.
- Pinter M, and Peck-Radosavljevic M (2018) Review article: systemic treatment of hepatocellular carcinoma. Aliment Pharmacol Ther 48: 598-609. [Crossref]
- Hemming AW, Berumen J, and Mekeel K (2016) Hepatitis B and hepatocellular carcinoma. Clin Liver Dis 20: 703-720.
- Alqahtani A (2019) Hepatocellular carcinoma: Molecular mechanisms and targeted therapies. Medicina (Kaunas) 55: 526. [Crossref]
- Gao JJ (2015) Sorafenib-based combined molecule targeting in treatment of hepatocellular carcinoma. World J Gastroenterol 21: 12059-12070. [Crossref]
- He AR, and Goldenberg AS (2013) Treating hepatocellular carcinoma progression following first-line sorafenib: therapeutic options and clinical observations. Therapeutic Advances in Gastroenterology 6: 447-458.
- Kudo M (2018) Lenvatinib versus sorafenib in first-line treatment of patients with unresectable hepatocellular carcinoma: a randomised phase 3 non-inferiority trial. Lancet 391. 1163-1173.
- Heo YA (2018) Regorafenib: A review in hepatocellular carcinoma. Drugs 78: 951-958.
- Abou-Alfa GK (2018) Cabozantinib in patients with advanced and progressing hepatocellular carcinoma. N Engl J Med 379: 54-63
- Wu X (2019) Application of PD-1 blockade in cancer immunotherapy. Comput Struct Biotechnol J 17: 661-674.
- Zhou K, and Fountzilas C (2019) Outcomes and quality of life of systemic therapy in advanced hepatocellular carcinoma. Cancers (Basel) 11: 861. [Crossref]
- Degrassi A (2010) Efficacy of PHA-848125, a cyclin-dependent kinase inhibitor, on the K-Ras(G12D) LA2 lung adenocarcinoma transgenic mouse model: evaluation by multimodality imaging. Mol Cancer Ther 9: 673-681.
- Albanese C (2010) Dual targeting of CDK and tropomyosin receptor kinase families by the oral inhibitor PHA-848125, an agent with broad-spectrum antitumor efficacy. Mol Cancer Ther 9: 2243-2254
- Pineau P (2010) miR-221 overexpression contributes to liver tumorigenesis. Proc Natl Acad Sci U S A 107: 264-269.
- Gramantieri L (2008) MicroRNA involvement in hepatocellular carcinoma. J Cell Mol Med 12: 2189-2204. [Crossref]
- Cheung DG (2017) Action of CDK Inhibitor PHA-848125 in ER-negative Breast Cancer with MicroRNA-221/222 Overexpression, Ohio State University.
- Besse B (2018) Efficacy of milciclib (PHA-848125AC), a pan-cyclin d-dependent kinase inhibitor, in two phase II studies with thymic carcinoma (TC) and B3 thymoma (B3T) patients. Journal of Clinical Oncology 36: 8519-8519.
- Peyressatre M (2015) Targeting cyclin-dependent kinases in human cancers: from small molecules to Peptide inhibitors. Cancers (Basel) 7: 179-237.
- Henley S A (2012) The retinoblastoma family of proteins and their regulatory functions in the mammalian cell division cycle. Cell Division 7: 10.
- Aspeslagh S (2017) Phase I dose-escalation study of milciclib in combination with gemcitabine in patients with refractory solid tumors. Cancer Chemotherapy and Pharmacology 79: 1257-1265. [Crossref]
- He L (2015) Mouse models of liver cancer: Progress and recommendations. Oncotarget 6: 23306-23322.
- Gao YS (2004) Nude mice model of human hepatocellular carcinoma via orthotopic implantation of histologically intact tissue. World J Gastroenterol 10: 3107-3111.
- Choudhari SR (2007) Deactivation of Akt and STAT3 signaling promotes apoptosis, inhibits proliferation, and enhances the sensitivity of hepatocellular carcinoma cells to an anticancer agent atiprimod. Mol Cancer Ther 6: 112-121. [Crossref]
- Li Y (2001) Establishment of cell clones with different metastatic potential from the metastatic hepatocellular carcinoma cell line MHCC97. World J Gastroenterol 7: 630-636.
- Park JK (2011) miR-221 silencing blocks hepatocellular carcinoma and promotes survival. Cancer Res 71: 7608-7616. [Crossref]
- Fornari F (2008) MiR-221 controls CDKN1C/p57 and CDKN1B/p27 expression in human hepatocellular carcinoma. Oncogene 27: 5651-5661.
- Fornari F (2017) In Hepatocellular carcinoma miR-221 modulates sorafenib resistance through inhibition of caspase-3-mediated apoptosis. Clinical Cancer Research 23: 3953-3965. [Crossref]
- Galardi S (2007) miR-221 and miR-222 expression affects the proliferation potential of human prostate carcinoma cell lines by targeting p27Kip1. J Biol Chem 282: 23716-23724. [Crossref]
- le Sage C (2007) Regulation of the p27(Kip1) tumor suppressor by miR-221 and miR-222 promotes cancer cell proliferation. The EMBO Journal 26: 3699-3708. [Crossref]
- Callegari E (2012) Liver tumorigenicity promoted by microRNA-221 in a mouse transgenic model. Hepatology 56: 1025-1033
- Di Martino MT (2013) In vitro and in vivo anti-tumor activity of miR-221/222 inhibitors in multiple myeloma. Oncotarget 4: 242-255. [Crossref]
- Gill RM (1998) Regulation of expression and activity of distinct pRB, E2F, D-type cyclin, and CKI family members during terminal differentiation of P19 cells. Experimental Cell Research 244: 157-170
- MacLachlan TK (1995) Cyclins, cyclin-dependent kinases and cdk inhibitors: implications in cell cycle control and cancer. Critical Reviews in Eukaryotic Gene Expression 5: 127-156.
- Lu C (2017) Expression of Wnt3a in hepatocellular carcinoma and its effects on cell cycle and metastasis. International Journal of Oncology 51: 1135-1145.
- Prieto-Dominguez N (2016) Modulation of autophagy by sorafenib: Effects on treatment response. Front Pharmacol 7: 151.
- Chang TM (2017) The regulatory role of aberrant Phosphatase and Tensin Homologue and Liver Kinase B1 on AKT/mTOR/c-Myc axis in pancreatic neuroendocrine tumors. Oncotarget 8: 98068-98083. [Crossref]
- Moshiri F (2014) Inhibiting the oncogenic mir-221 by microRNA sponge: toward microRNA-based therapeutics for hepatocellular carcinoma. Gastroenterol Hepatol Bed Bench 7: 43-54. [Crossref]
- Wang Y (2016) miR-221 Mediates Chemoresistance of esophageal adenocarcinoma by direct targeting of DKK2 expression. Ann Surg 264: 804-814.
- Szymonowicz K (2018) New insights into protein kinase B/Akt signaling: Role of localized akt activation and compartment-specific target proteins for the cellular radiation response. Cancers 10: 78. [Crossref]
- Shamloo B (2019) p21 in cancer research. Cancers 11: 1178. [Crossref]
- Heron-Milhavet L (2006) Only Akt1 is required for proliferation, while Akt2 promotes cell cycle exit through p21 binding. Mol Cell Biol 26: 8267-8280.
- Jindal A (2019) Hepatocellular carcinoma: Etiology and current and future drugs. J Clin Exp Hepatol 9: 221-232.
- Llovet JM (2018) Molecular therapies and precision medicine for hepatocellular carcinoma. Nat Rev Clin Oncol 15: 599-616.
- Lurje I (2019) Treatment strategies for hepatocellular carcinoma (-) a multidisciplinary approach. Int J Mol Sci 20: 1465. [Crossref]
- Boland P and Wu J (2018) Systemic therapy for hepatocellular carcinoma: beyond sorafenib. Chin Clin Oncol 7: 50.
- Newell P (2009) Ras pathway activation in hepatocellular carcinoma and anti-tumoral effect of combined sorafenib and rapamycin in vivo. Journal of Hepatology 51: 725-733. [Crossref]
- Gedaly R (2012) PKI-587 and sorafenib targeting PI3K/AKT/mTOR and Ras/Raf/MAPK pathways synergistically inhibit HCC cell proliferation. J Surg Res 176: 542-548.
- Llovet JM, Bruix J (2008) Molecular targeted therapies in hepatocellular carcinoma. Hepatology 48: 1312-1327. [Crossref]