Objective: To establish the echocardiography normal reference value and Z-score mathematical model of the left heart in Chinese pediatric patients and compare these values with those obtained from other previously published North American and European regression equations.
Methods: This multicenter echocardiography study enrolled 586 healthy children (300 boys and 286 girls) from eight medical centers in China and obtained echocardiographic measurements: LVEDd, LVEDs and LAD, by M-mode echocardiography; MVD, ARD, ASD, STJ, AAO, PTA, DTA and AI, by two-dimensional echocardiography; and LAV, LVEDV, LVESV, SV and EF, by biplane method. To establish a regression mathematical model to predict normal reference values, we performed correlation analysis of echocardiographic results and body surface area (BSA). All measurements were applied to the mathematical model of this study and a previous mathematical to calculate the Z-scores separately for comparison.
Results: We found a nonlinear positive correlation between LVEDd, LVEDs, LAD, MVD, ARD, ASD, STJ, AAO, PTA, DTA, AI, LAV, LVEDV, SV, CO and BSA (P < 0.01) but no correlation between left ventricular ejection fraction and BSA (P > 0.05). Results of Z-scores obtained by our mathematical model showed no change trend with the increase of BSA but did show standard normal distribution. However, Z-score results calculated using the Caucasus formula did not show a standard normal distribution, with a statistically significant difference between the two formulae (P < 0.05).
Conclusion: This measure can be used as a normal reference value for the echocardiographic diagnosis of Chinese pediatric patients with heart disease.
children, Chinese, echocardiography, normal reference value, Z-score
AAO: Ascending Aortic Diameter; AI: Aortic Isthmus Diameter; ARD: Aortic Annular Diameter; ASD: Aortic Sinus Diameter; BSA: Body Surface Area; CI: Cardiac Index; CO: Cardiac Output; DTA: Distal Transverse Aorta Diameter; EF: Ejection Fraction; H: Height; LAD: Left Atrial Diameter; LAV: Left Atrial Volume; LVEDd: Diastolic Left Ventricular Diameter; LVEDs: Systolic Left Ventricular Diameter; LVEDV: Left Ventricular End-Diastolic Volume; LVESV: Left Ventricular End-Systolic Volume; MV-D: Mitral Annular Diameter; PTA: Proximal Aortic Arch Diameter; SBP/DBP: Systolic/Diastolic Blood Pressure; SE: Standard Error; STJ: Sinus Junction Diameter; SV: Stroke Volume; W: Weight
Echocardiography is an important imaging method for the evaluation of the structure and function of a child’s heart. Children undergo continuous growth and development, and the development of the cardiovascular system is closely related to physical development [1-3]. Therefore, the normal range of cardiac diameter measurements varies among children of different ages, and thus, diagnostic criteria for evaluating abnormalities of the cardiovascular system in children of different ages must be adopted [4-8]. The advantage of the Z-score for the evaluation of the development of the heart’s structure and function lies in that it can be used to quickly determine the actual value distribution position of normal persons according to variables and then to judge whether the deviation is indeed abnormal or not as well as the degree of abnormality, if present [9-11]. At present, the Z-score is primarily used in the quantitative evaluation of paediatric echocardiography [1,12-15]. Scholars from different countries have used Z-score calculations to study the normal reference values of paediatric echocardiograms [6,16-18] as well as the values among children in specific areas [19,20]. However, because of differences in race, genetics and the growth environment, these results might not be suitable for Chinese children. The normal reference value of paediatric echocardiography has also been reported in China [21-24]. Moreover, because previous studies were designed as single-centre trials, their results might not have the typical generalizability of multicenter trials. Thus, they can neither represent the level of children in most of China nor reflect the diversity of China’s population. Thus, the purpose of this study is to establish the normal reference value and a Z-score mathematical model of paediatric left heart echocardiography in the Chinese population, including the south, east and west of China, and to subsequently compare these values with the results of the representative research results of Caucasian children, to confirm whether there are differences between populations.
Objects and standards
This study is a large-sample, prospective, multicenter and observational echocardiography study (registration No. China Clinical Trial Center: ChiCTR-OOC-16008442). We included 586 normal Chinese children (300 boys, 286 girls) aged 1 month to 7 years from eight medical centres in China (Table 1). We did not limit the origin, birthplace, or growing area (rural or urban) of the subjects.
Table 1. Participating Medical Multi-center Members.
Member |
Affiliation |
City, Province |
Bei Xia |
Shenzhen Children's Hospital Affiliated to China Medical University |
Shenzhen, Guandong |
Wei Yu |
Shenzhen Children's Hospital Affiliated to China Medical University |
Shenzhen, Guandong |
Shu-Bao Chen |
Shanghai Children's Medical Center, Medical College of Shanghai Jiaotong University |
Shanghai |
Qing-Hua Liu |
Qilu Children's Hospital of Shandong University |
Jinan, Shandong |
Wen-juan Chen |
Children's Hospital of Hunan Province |
Changsha, Hunan |
Shan-liang Zhu |
Nanjing Children's Hospital, |
Nanjing, Jiangsu |
Mei Jin |
Chengdu Women's and Children's Center Hospital |
Chengdu, Sichuan |
Jie-Qin Min |
Children's Hospital Affiliated to Kunming Medical University |
Kunming,Yunan |
Yang Xu |
The First Affiliated Hospital of Jilin University |
Chuangchun, Jilin |
Inclusion criteria were as follows: (1) children aged 1 month to 7 years. (2) No cardiovascular history (3) Blood pressure was normal [25]. (4) Physical examination showed no abnormality of cardiovascular system. (5) Heart structure were normal by clinical examination and echocardiography. (6) Echocardiography examination for the following reasons: asymptomatic heart murmur, chest pain, suspicious abnormal chest X-ray or ECG performance, family history of congenital heart disease.
Exclusion criteria were (1) Congenital heart disease (The presence of a patent foramen ovale in infants was considered normal). (2) History of Kawasaki disease or surgical catheterization for heartdisease. (3) Myocardial disease. (4) Chromosomal abnormalities (i.e. trisomy 21, Turner syndrome, noonan syndrome, Marfan syndrome, Williams syndrome, 22q11.2 deletion, etc.). (5) Major potential diseases (such as malignant tumor, leukemia, metabolic or endocrine diseases, neuromuscular diseases, chronic renal failure, etc.). (6) Professional athletes.
Subjects included children of different ages, including 1–6 months (47 patients), 7–12 months (72 patients), 13–18 months (71 patients), 19–24 months (53 patients), 25–30 months (44 patients), 31–36 months (46 patients), 37–48 months (81 patients), 49–60 months (65 patients), 61–72 months (58 patients), 73–84 months (49 patients). Height, weight and systolic/diastolic blood pressure were measured, and body surface area (BSA) was calculated [26, 27].
Equipment and methods
Echocardiography was performed with E9 (GE Ultrasound, Norway) and iE33 (Philips Medical System, USA) in eight centres in China. The frequency of probe M5S was 1.5–4.6 MHz, and the frequency of probe 12S was 4.5–12 MHz. Equipment setting conditions were as follows: frame frequency >60 fps, tissue Doppler frame rate >110, two-dimensional automatic optimisation M-mode and spectrum Doppler scanning speed 100 mm/s; sector angle of colour sampling frame <30°. All subjects were examined in a sleeping or quiet state. Electrocardiogram was recorded synchronously, and a dynamic image was stored for playback measurement.
We measured the following parameters [28-30]: (1) M-mode: LVEDd, LVEDs, LAD; (2) two-dimensional methods: MVD, ARD, ASD, STJ, AAO, PTA, DTA and AI; (3) biplane method: LAV, LVEDV, LVESV, SV, ejection fraction (EF).
Statistical analysis
We used SPSS 21.0 statistical software. Age, height, weight, blood pressure, heart rate, BSA, EF, SV, CO and CI of different genders were tested for normality and expressed as
x
± s. We used the F test to compare the differences in age, height, weight, blood pressure, heart rate, BSA, EF, SV, CO and CI of patients of different genders. The test level was α = 0.05.
We used Pearson correlation analysis to determine the correlation between echocardiographic parameters and BSA. We also used nonlinear (logarithmic, power) regression analysis [12] to obtain regression analysis coefficients, determinant coefficients (R2) and standard error (SE) and selected the best equation. The Z-score was calculated, and scatter plots related to volume surface area were obtained. We tested the normal distribution and stability of the Z-score results.
We compared the regression curves of ARD, MV-D and LVEDV with published nomograms (PHN) [31]; the regression curves of ARD and MV-D with Pettersen’s equation [32] and the regression curves of LVEDd and LAD with Kampmann’s equation [16]. We fit the data from this study with those of previously published formula [16,31,32] and the Z-scores calculated from those, and we carried out a standard normal distribution test. The two groups of Z-scores were compared for consistency.
We detected no significant differences in age, heart rate, height, weight, BSA, blood pressure, EF, SV, CO, or CI between male and female patients (Table 2).
Table 2. Comparison of basic indicators and echocardiographic results of Male and Female children.
Index |
Male
(n=300) |
Female
(n=286) |
t |
p |
Age (month) |
35.06 ± 23.26 |
34.96 ± 22.70 |
0.96 |
0.69 |
Heart rate (times/min) |
101.90 ± 17.32 |
106.03 ± 17.93 |
0.01 |
0.56 |
Height (cm) |
93.19 ± 17.85 |
91.24 ± 17.88 |
0.21 |
0.95 |
Weight (kg) |
14.44 ± 5.49 |
13.65 ± 5.58 |
0.10 |
0.76 |
BSA(m2) |
0.61 ± 0.16 |
0.59 ± 0.17 |
0.10 |
0.64 |
SBP(mmHg) |
93.23 ± 12.33 |
91.95 ± 12.06 |
0.25 |
0.76 |
DBP(mmHg) |
56.12 ± 10.98 |
56.08 ± 11.22 |
0.96 |
0.71 |
EF(%) |
63.97 ± 4.70 |
64.32 ± 4.55 |
0.62 |
0.39 |
SV(ml) |
15.44 ± 5.96 |
14.77 ± 6.34 |
0.22 |
0.31 |
CO(L/min) |
1.54 ± 0.49 |
1.47 ± 0.49 |
0.12 |
0.78 |
CI(L/min·m2) |
2.59 ± 0.49 |
2.54 ± 0.46 |
0.27 |
0.51 |
BSA: body surface area; SBP: Systolic blood pressure; DBP: Diastolic blood pressure
M-mode diameter
Table 3 presents the echocardiography regression formula, in which the R2 of the logarithmic mathematical model was the highest. LVEDd, LVEDs and LAD increased as the patient BSA increased; Figure 1 shows the trend chart of the logarithmic mathematical model with BSA. The Z-scores of the logarithmic model showed a standard normal distribution and did not change with BSA, as shown in Figure 1. P values were <0.01.
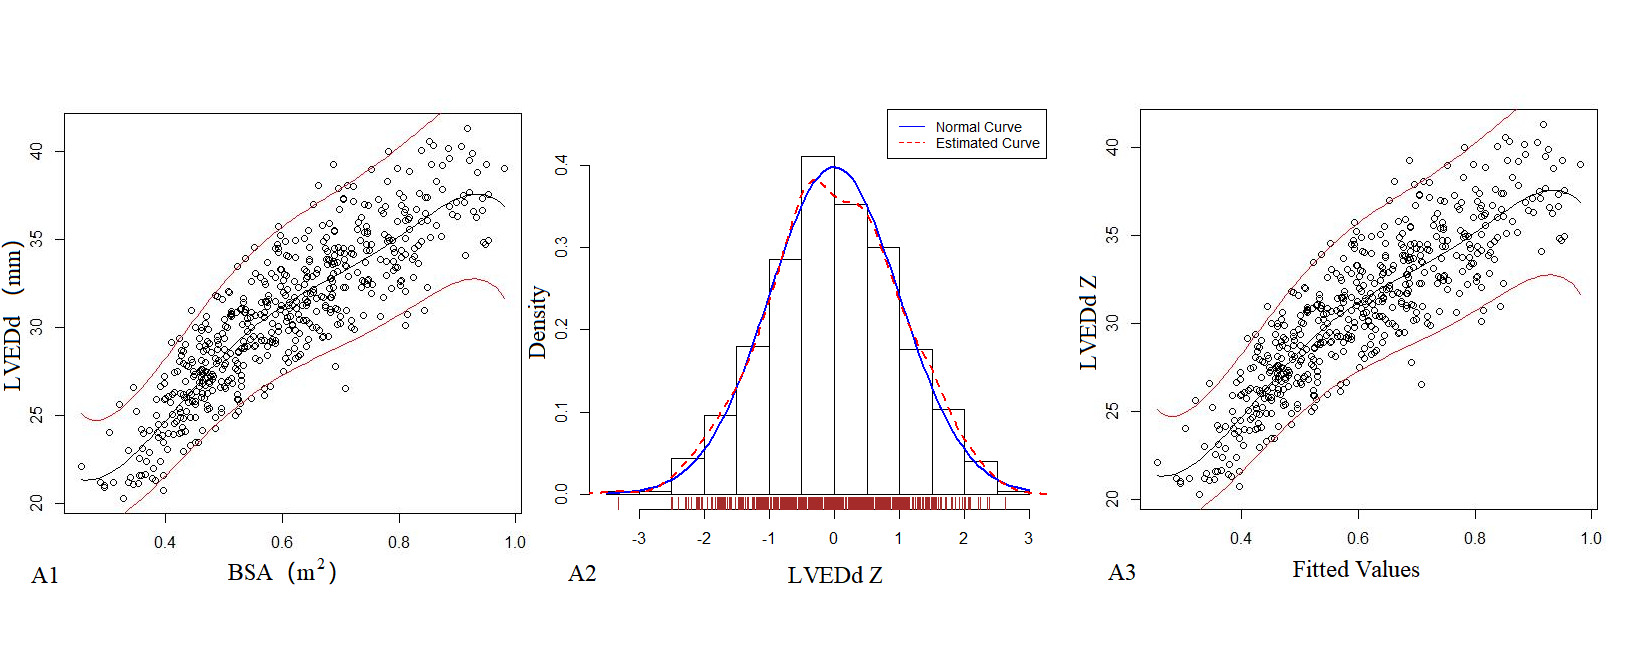
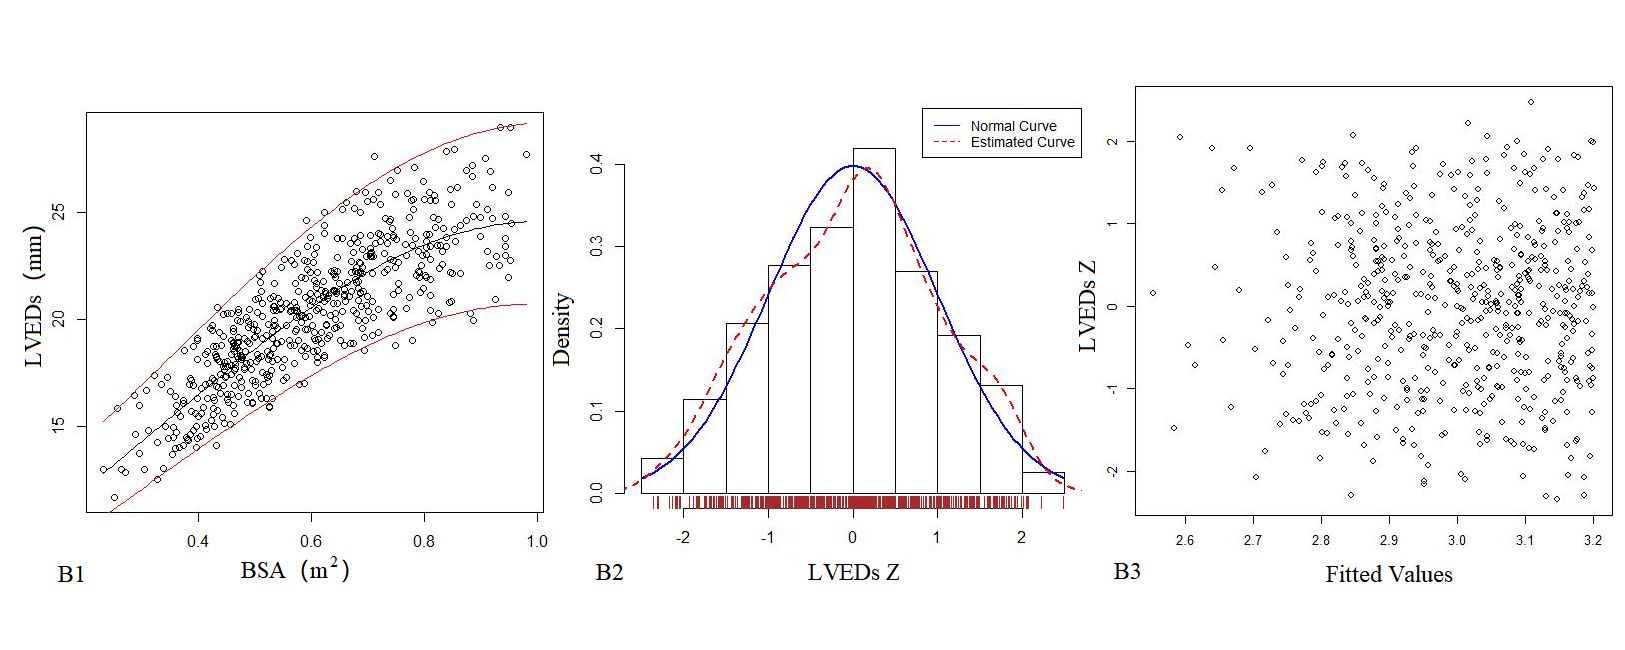
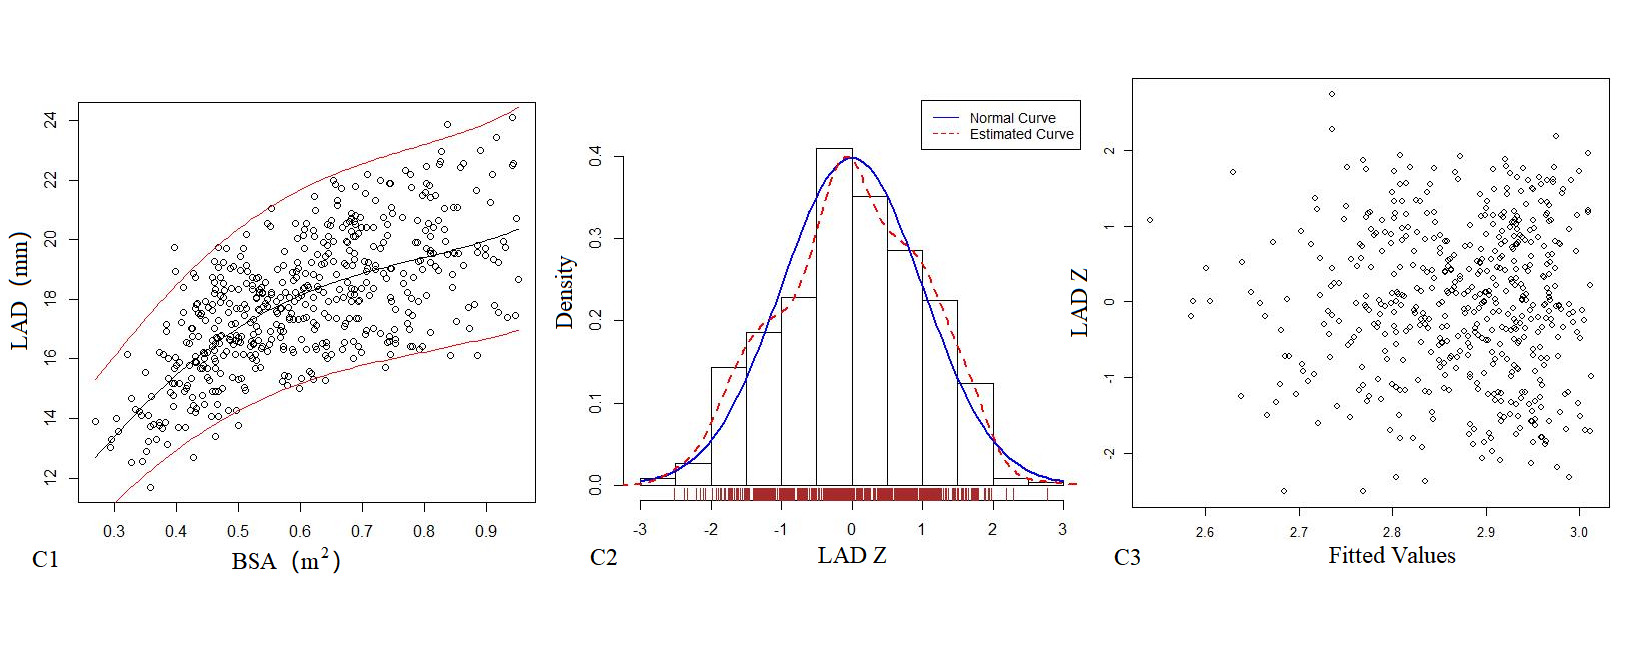
Figure 1. The logarithmic mathematical model of M-mode Echocardiography. The trend curves of correlation distribution between LVEDd (A1), LVEDs (B1), LAD (C1) and BSA of M-mode Echocardiography are all non-linear and positive correlation. The specific gravity bar graphs of LVEDd (A2), LVEDs (B2) and LAD (C2) Z score distribution are normal distribution. The scatter plots of LVEDd (A3), LVEDs (B3), LAD (C3) Z score distribution under different BSA.
Table 3. M-mode Echocardiography of Z-score mathematical mode.
Parameter(y) |
|
Mathematical mode |
R2 |
SE |
LVEDd(mm) |
Power |
1.438 + 84.81 x2 -74.73x2 + 26.76x3 |
0.764 |
2.138 |
|
Logarithmic |
lny=5.59-26.89x+103.35x2-178.89x3+146.73x4-46.31x5 |
0.7816* |
0.0685 |
LVEDs(mm) |
Power |
y=4.34+34.96x-12.58x2 -2.19x3 |
0.707 |
1.753 |
|
Logarithmic |
lny=2.10 +2.18 x -1.08 x2 |
0.721* |
0.0853 |
LAD(mm) |
Power |
y=-3.95+79.61x-96.20x2+41.12 x3 |
0.445 |
1.63 |
|
Logarithmic |
lny=1.77+3.96x-4.64x2 +1.94 x3 |
0.637* |
0.0906 |
*Mathematical mode representing the highest R2 value
Left heart diameter
Table 4 shows the regression model of echocardiography left heart diameter, in which the R2 of the logarithmic mathematical model is the highest. MVD, ARD, ASD, STJ, AAO, PTA, DTA and AI increased with the increase of BSA, and the trend chart of the logarithmic formula is shown in Figure 2. The Z-score results showed a standard normal distribution and, as shown in Figure 2, did not change with BSA. P values were <0.01.
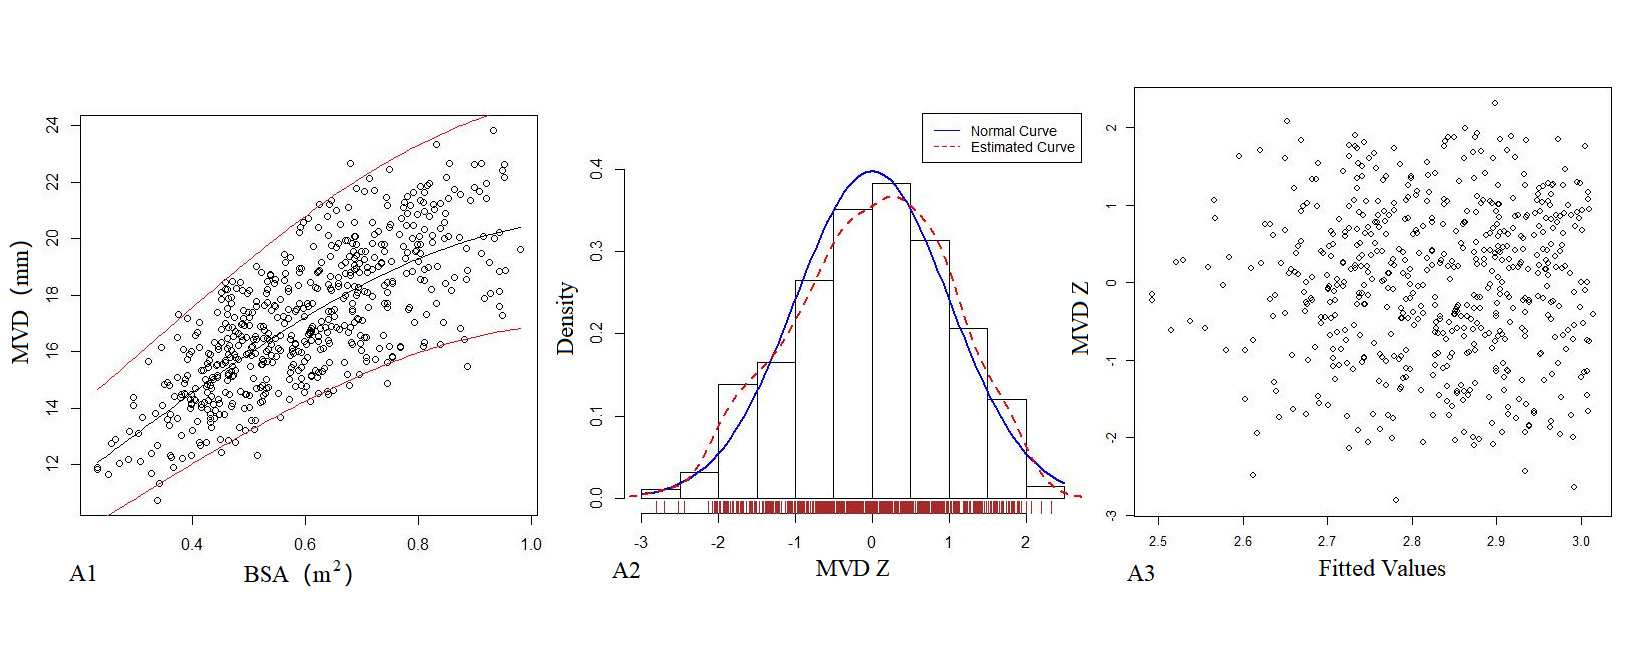
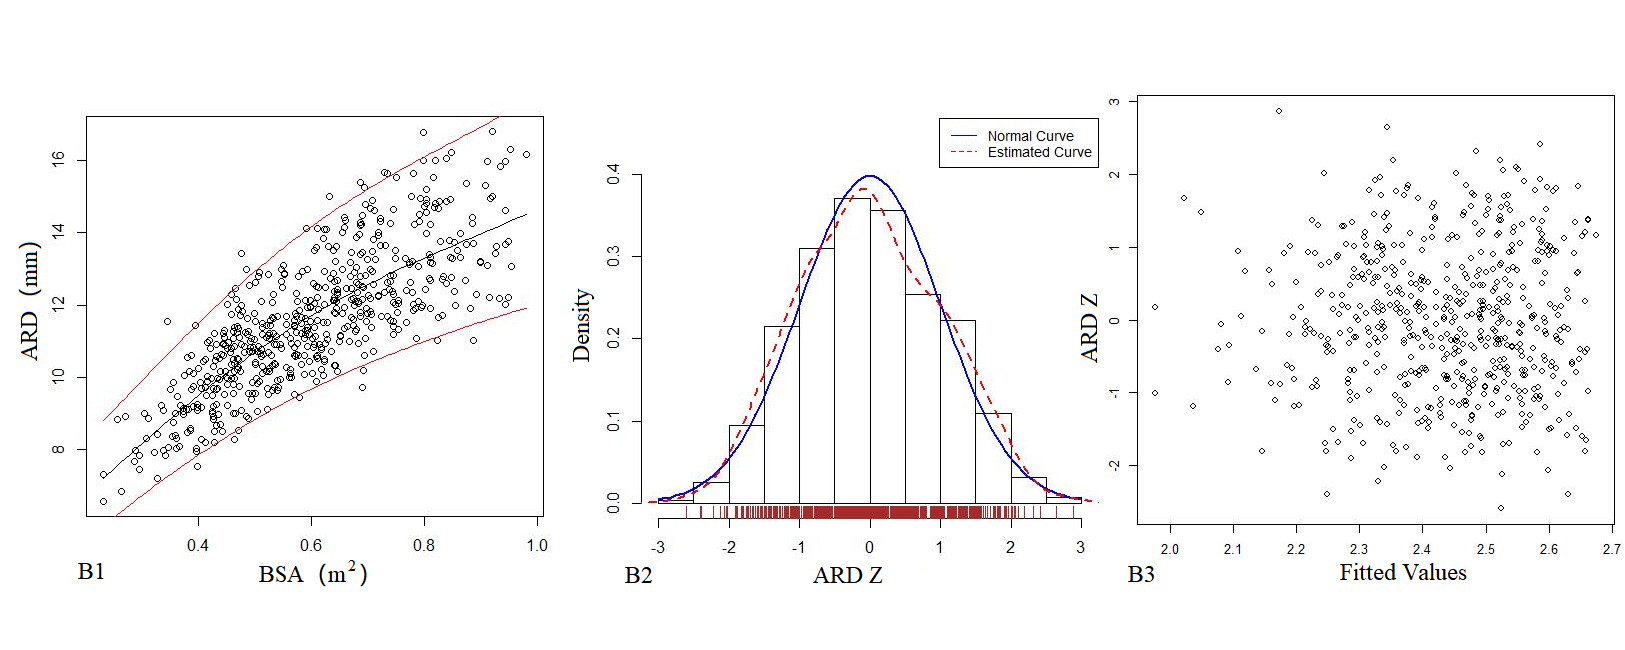
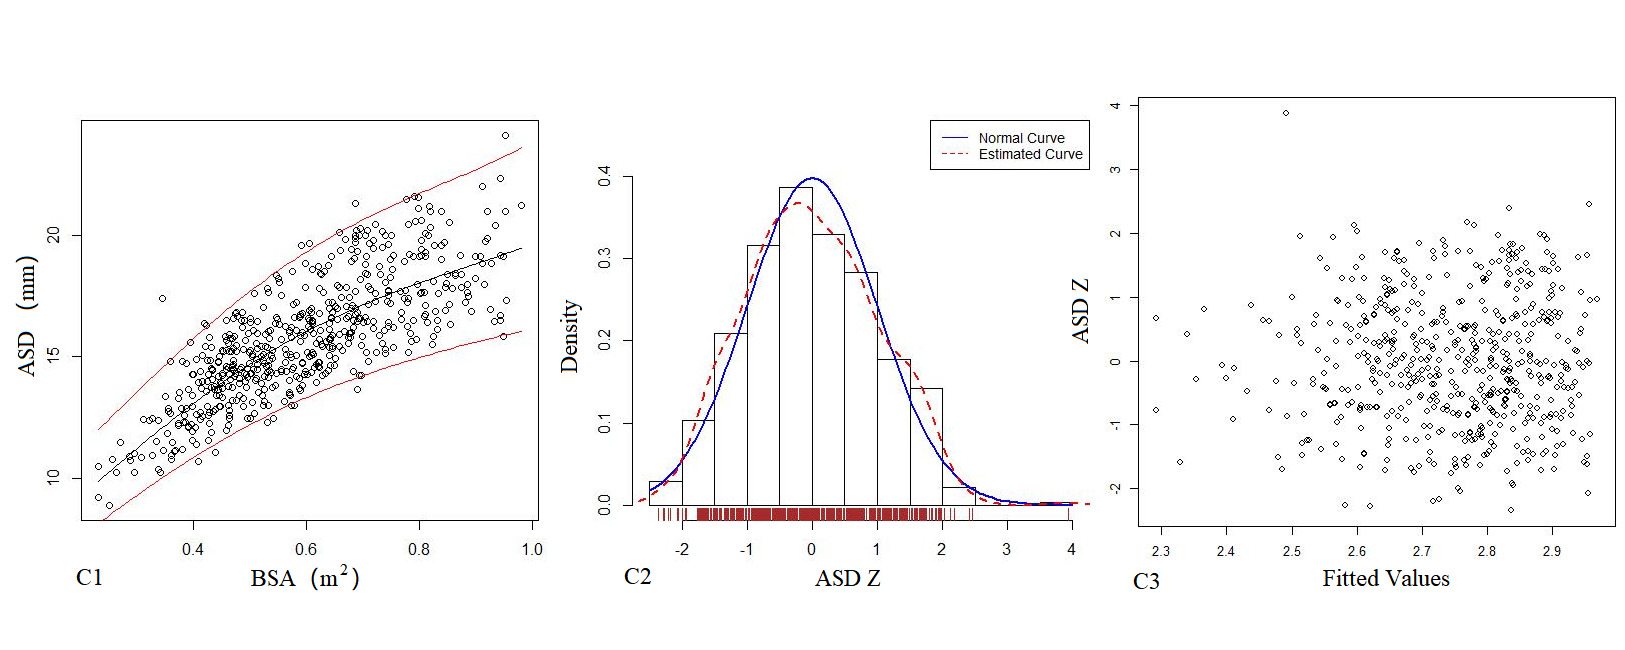
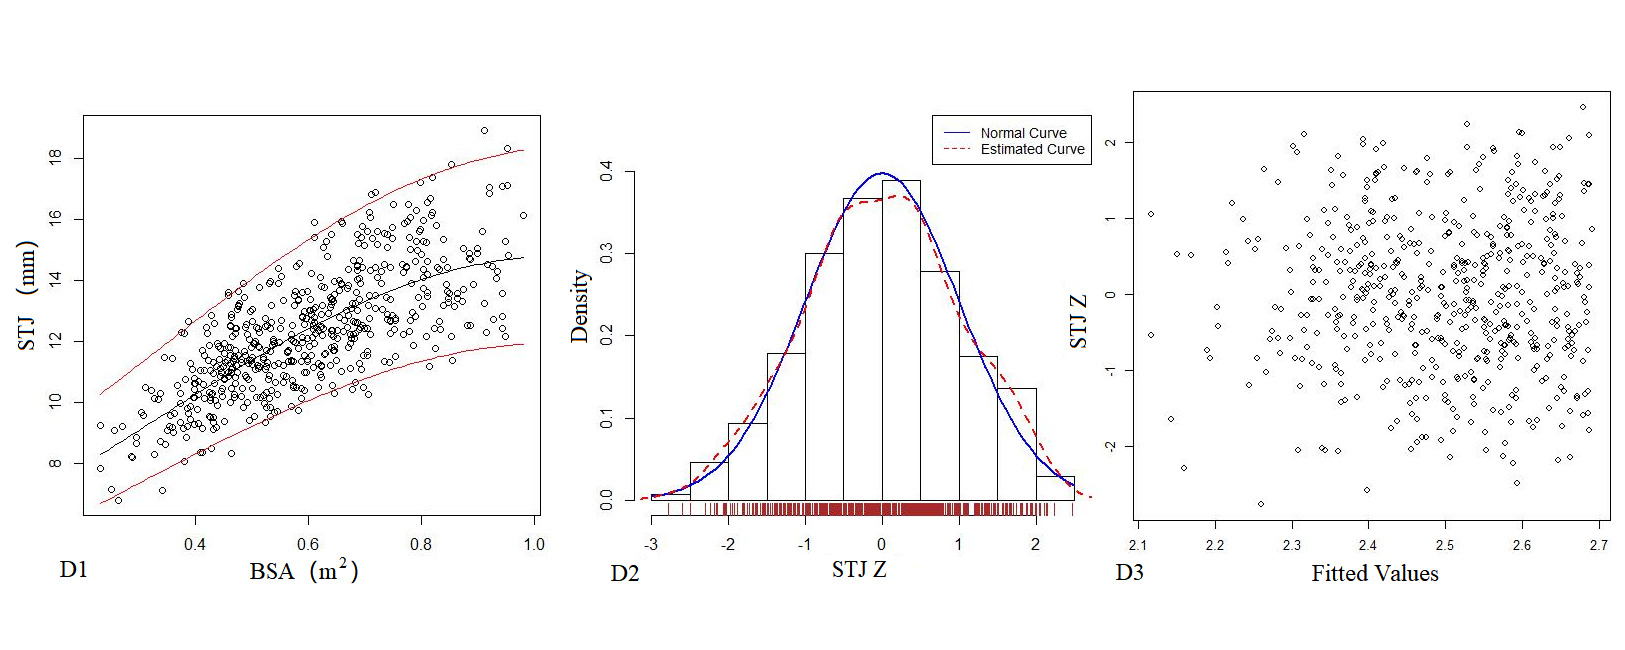
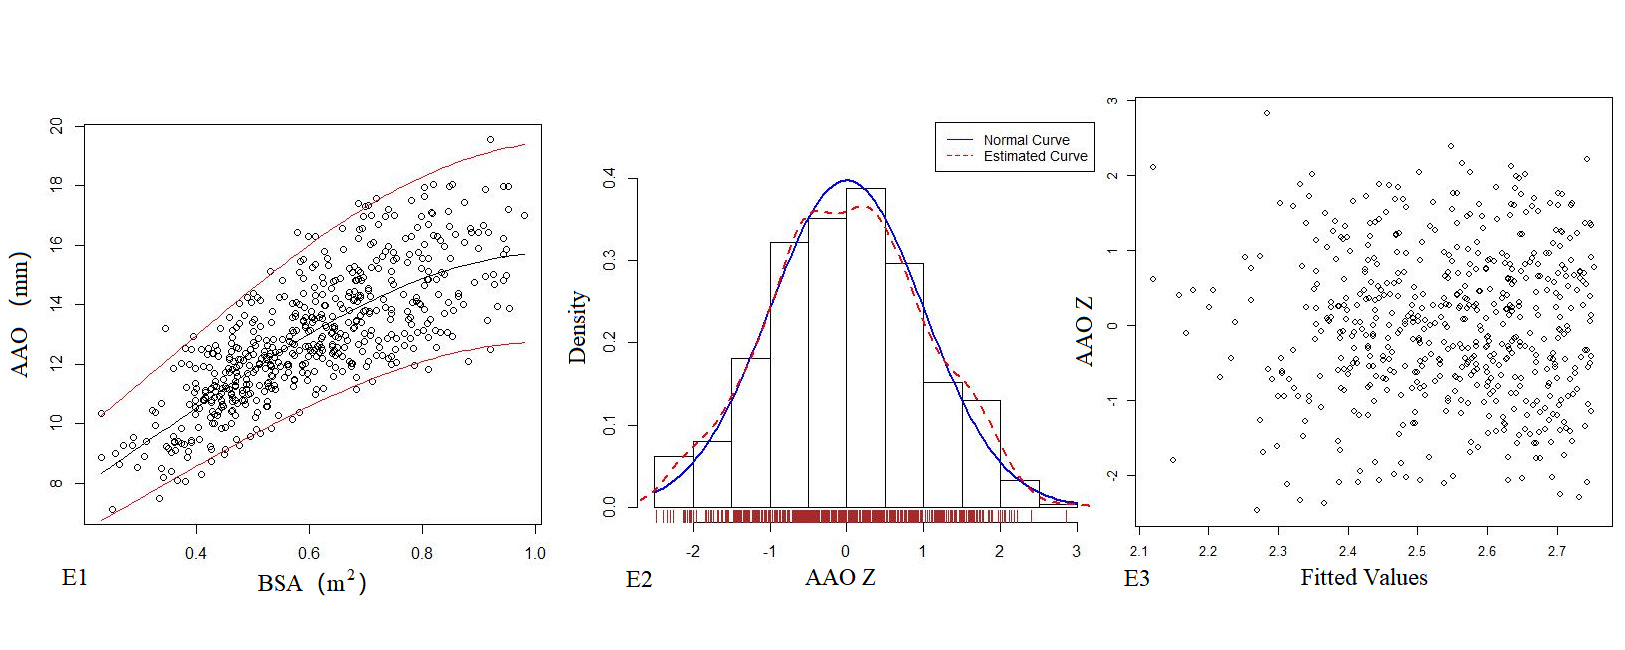
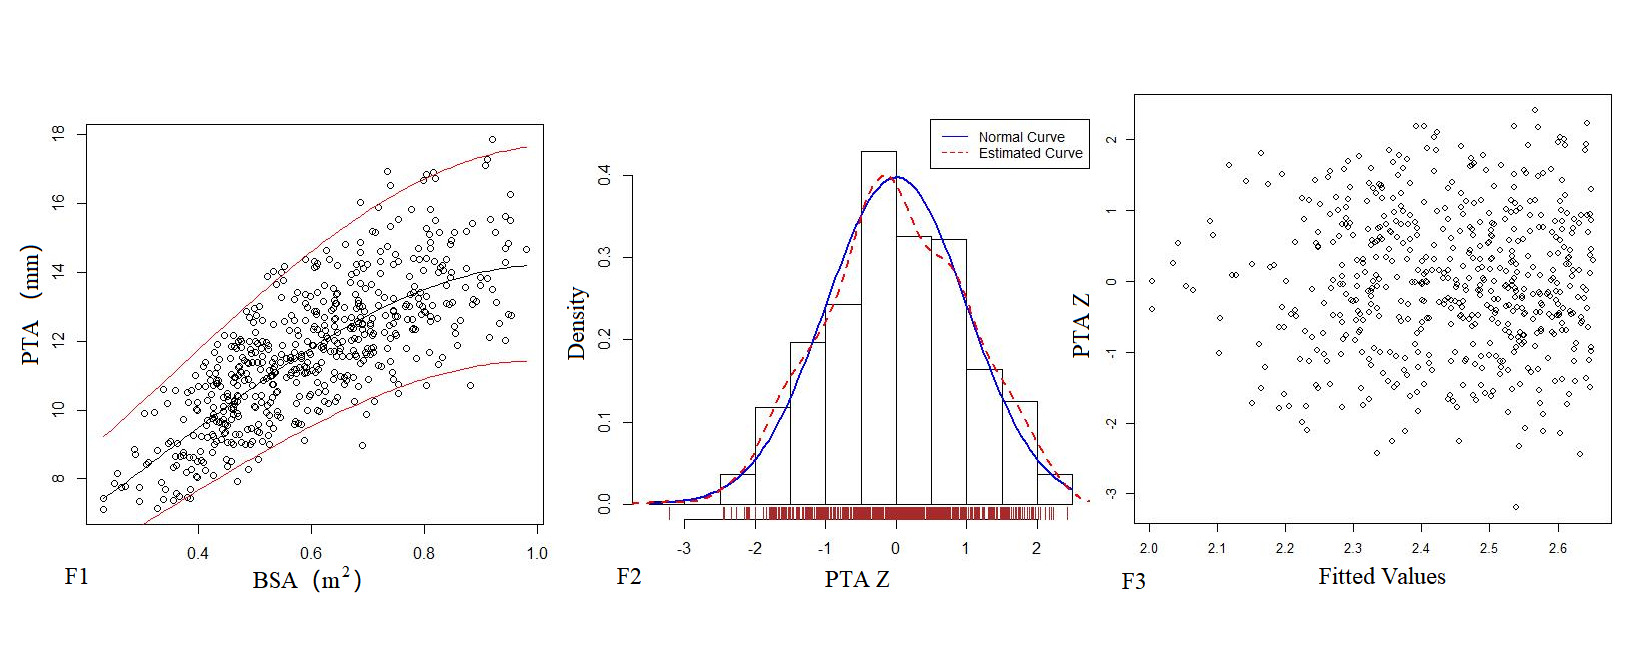
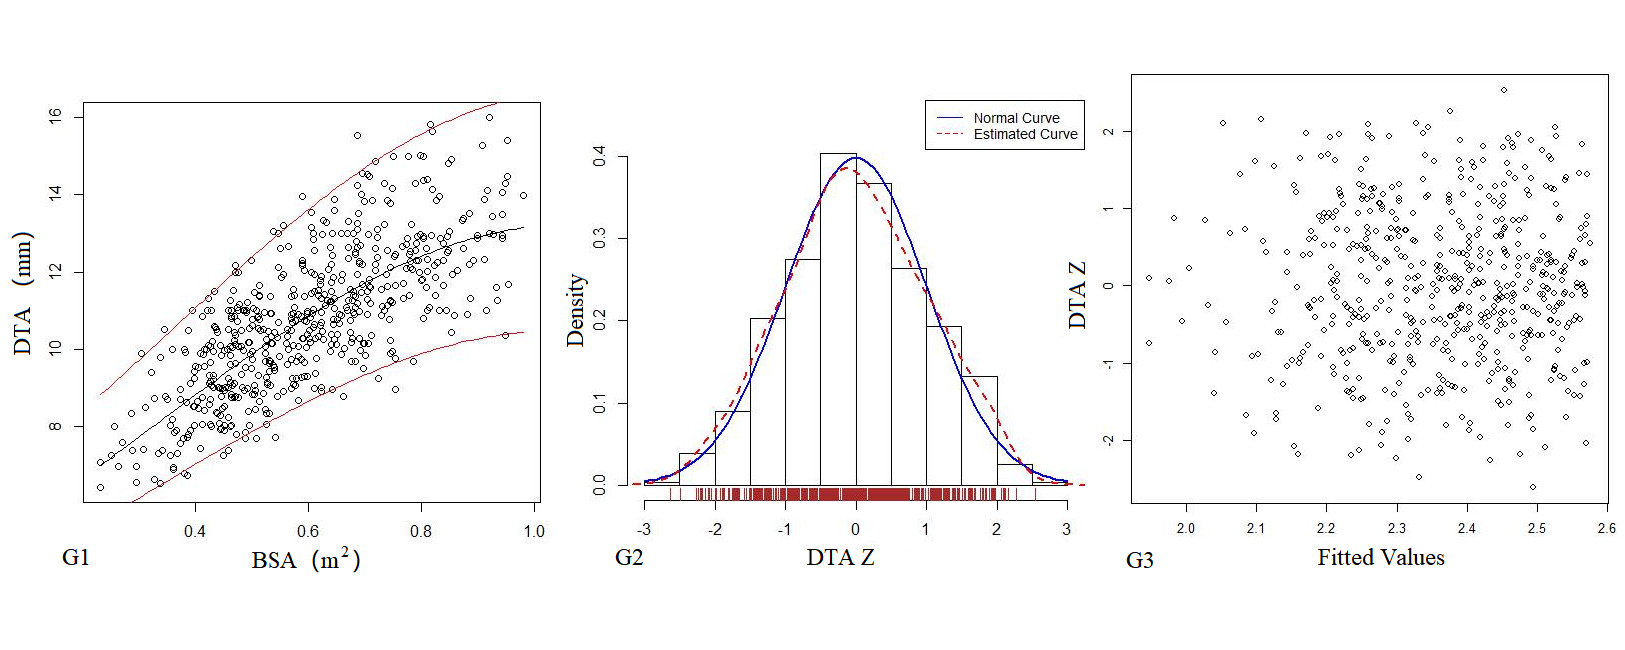
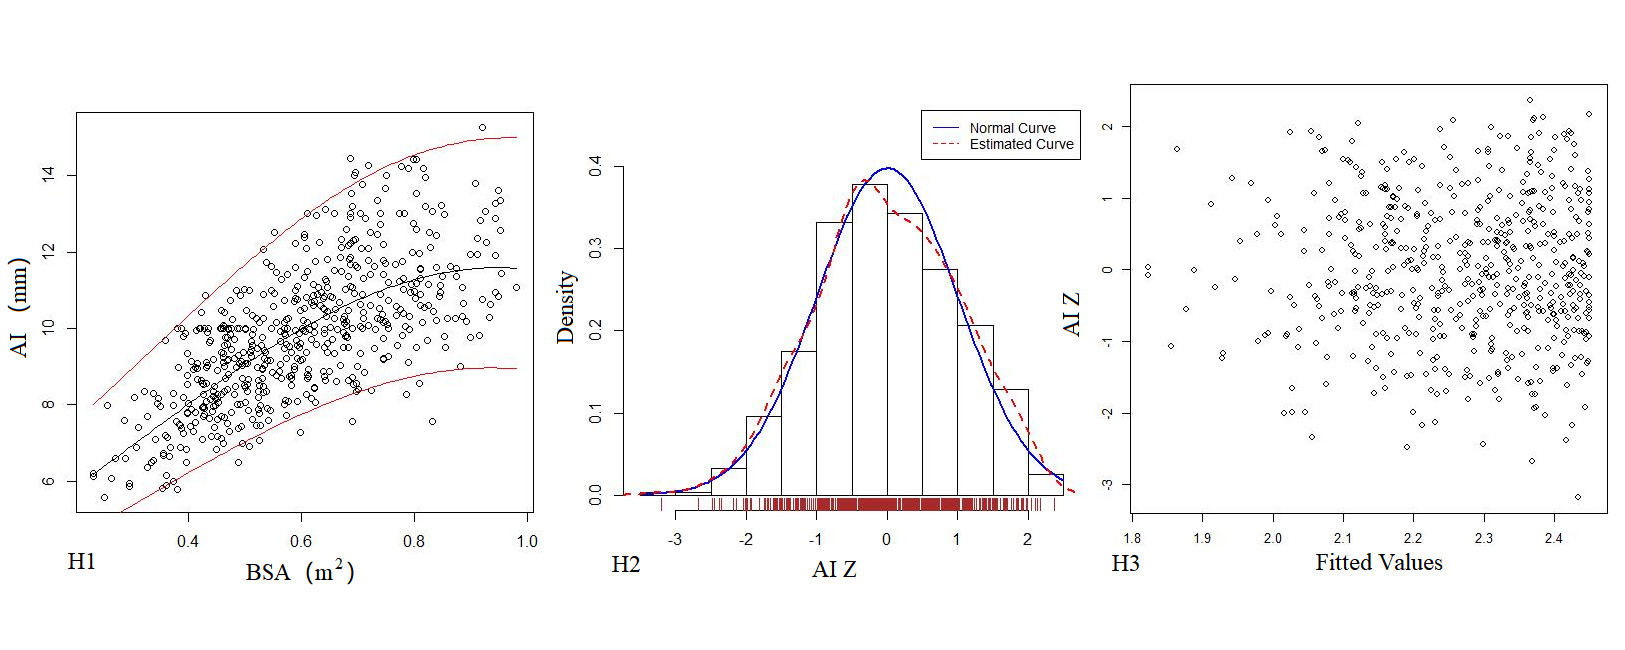
Figure 2. The logarithmic mathematical model of left heart diameter. The distribution trend curves of MVD (A1), ARD (B1), ASD (C1), STJ (D1), AAO (E1), PTA (F1), DTA (G1), AI (H1) and BSA were non-linear and positive correlation. The distribution of MVD (A2), ARD (B2), ASD (C2), STJ (D2), AAO (E2), PTA (F2), DTA (G2), AI (H2) Z sores results showed normal distribution. The Z score scatter plots of MVD (A3), ARD (B3), ASD (C3), STJ (D3), AAO (E3), PTA (F3), DTA (G3), AI (H3) distribution under different BSA.
Table 4. Echocardiography left heart diameter of Z score mathematical mode.
Parameter(y) |
|
Mathematical mode |
R2 |
SE |
MV-D(mm) |
Power |
y=4.43+34.67x-29.45x2+11.22x3 |
0.581 |
1.683 |
|
Logarithmic |
lny=2.17+1.54 x-0.69 x2 |
0.5821* |
0.0961 |
ARD(mm) |
Power |
y=2.16+22.66x-13.32x2 + 2.69x3 |
0.655 |
1.104 |
|
Logarithmic |
lny=1.39+3.16 x-2.92x2+1.06 x3 |
0.6585* |
0.0968 |
ASD(mm) |
Power |
y= 2.31+34.99x-24.86 x2 + 6.87 x3 |
0.648 |
1.489 |
|
Logarithmic |
lny=1.68+3.30 x-3.15x2+1.15 x3 |
0.6529* |
0.0945 |
STJ(mm) |
Power |
y= 4.72 + 13.97 x + 0.29 x2-4.25 x3 |
0.559 |
1.316 |
|
Logarithmic |
lny=1.74+1.81 x-0.86 x2 |
0.5662* |
0.107 |
AAO(mm) |
Power |
y= 2.65+23.69 x -11.73 x2 + 1.07 x3 |
0.612 |
1.335 |
|
Logarithmic |
lny=1.71+2.01 x-0.96 x2 |
0.6181* |
0.1052 |
PTA(mm) |
Power |
y=0.53+30.62 x -25.54 x2 + 9.02 x3 |
0.629 |
1.261 |
|
Logarithmic |
lny=1.57+2.11 x-1.03 x2 |
0.6378* |
0.1084 |
DTA(mm) |
Power |
y= 1.01 + 27.10 x -23.78 x2 + 9.24 x3 |
0.593 |
1.230 |
|
Logarithmic |
lny=1.54+1.95 x-0.92 x2 |
0.629* |
0.1152 |
AI(mm) |
Power |
y= 1.09 + 21.91 x + -13.66 x2 + 2.53 x3 |
0.526 |
1.251 |
|
Logarithmic |
lny=1.35+2.31 x-1.22 x2 |
0.5235* |
0.129 |
Left heart volume
Table 5 presents the regression model of echocardiography left heart volume, in which the R2 of the logarithmic mathematical model is the highest. LAV, LVEDV, LVESV and SV increased as the BSA increased, and the trend chart is shown in Figure 3. The Z-scores of the logarithmic model showed a standard normal distribution and did not change with BSA, as shown in Figure 3. P values were <0.01.
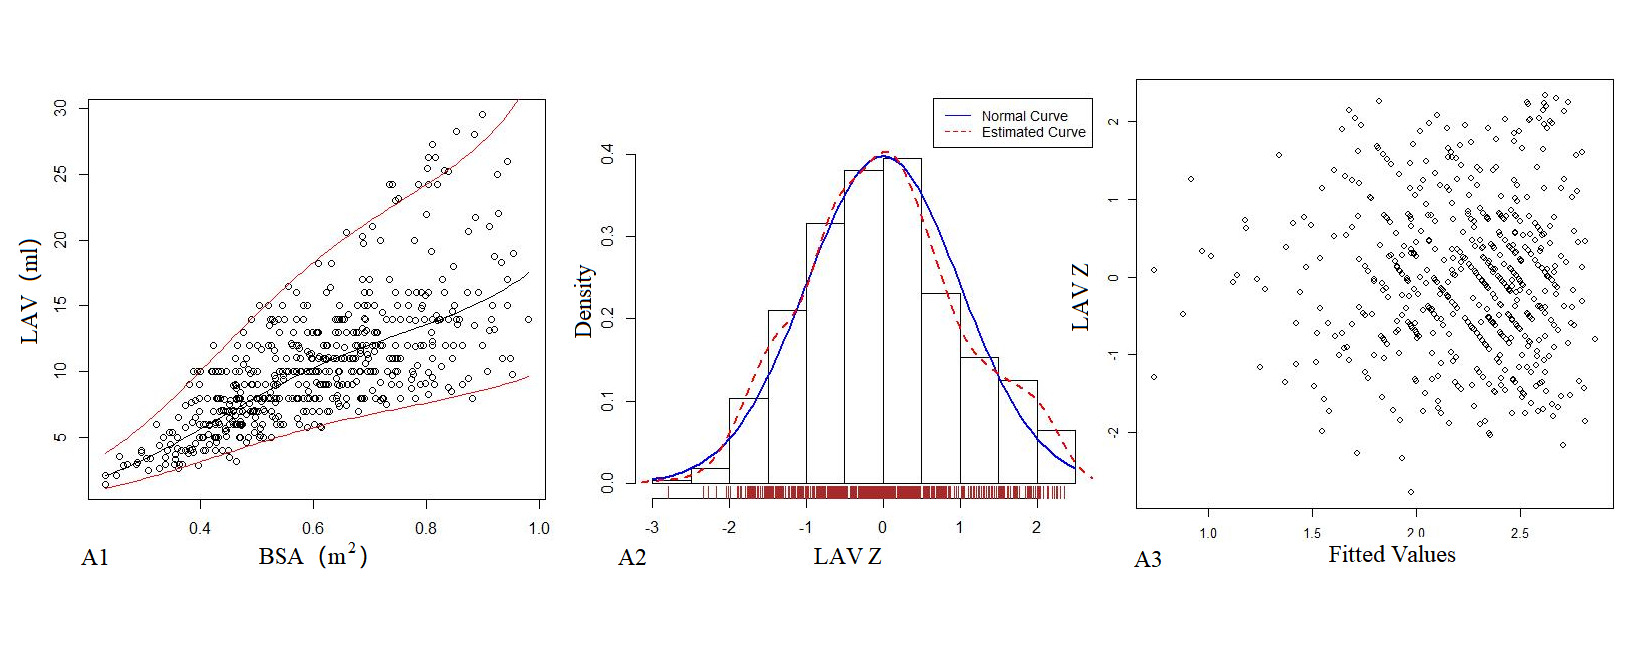
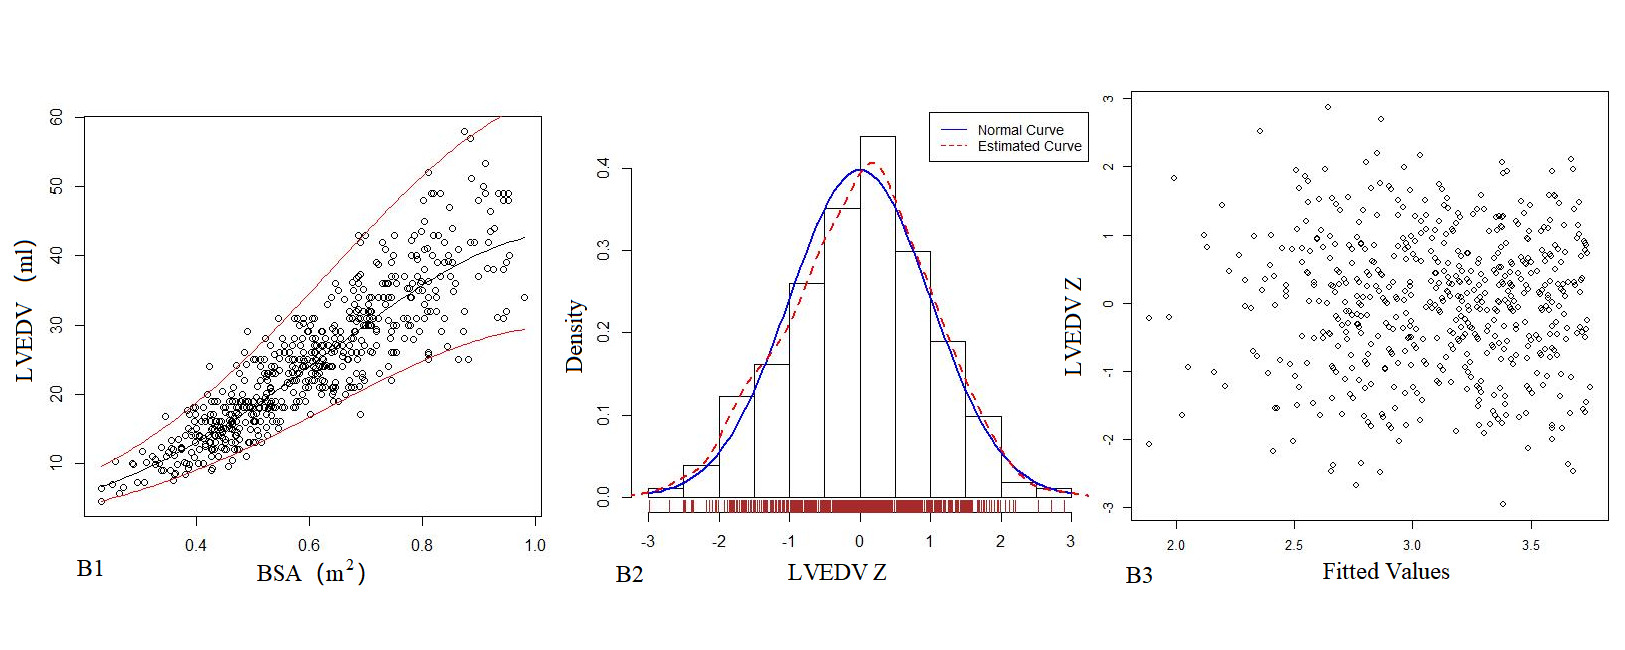
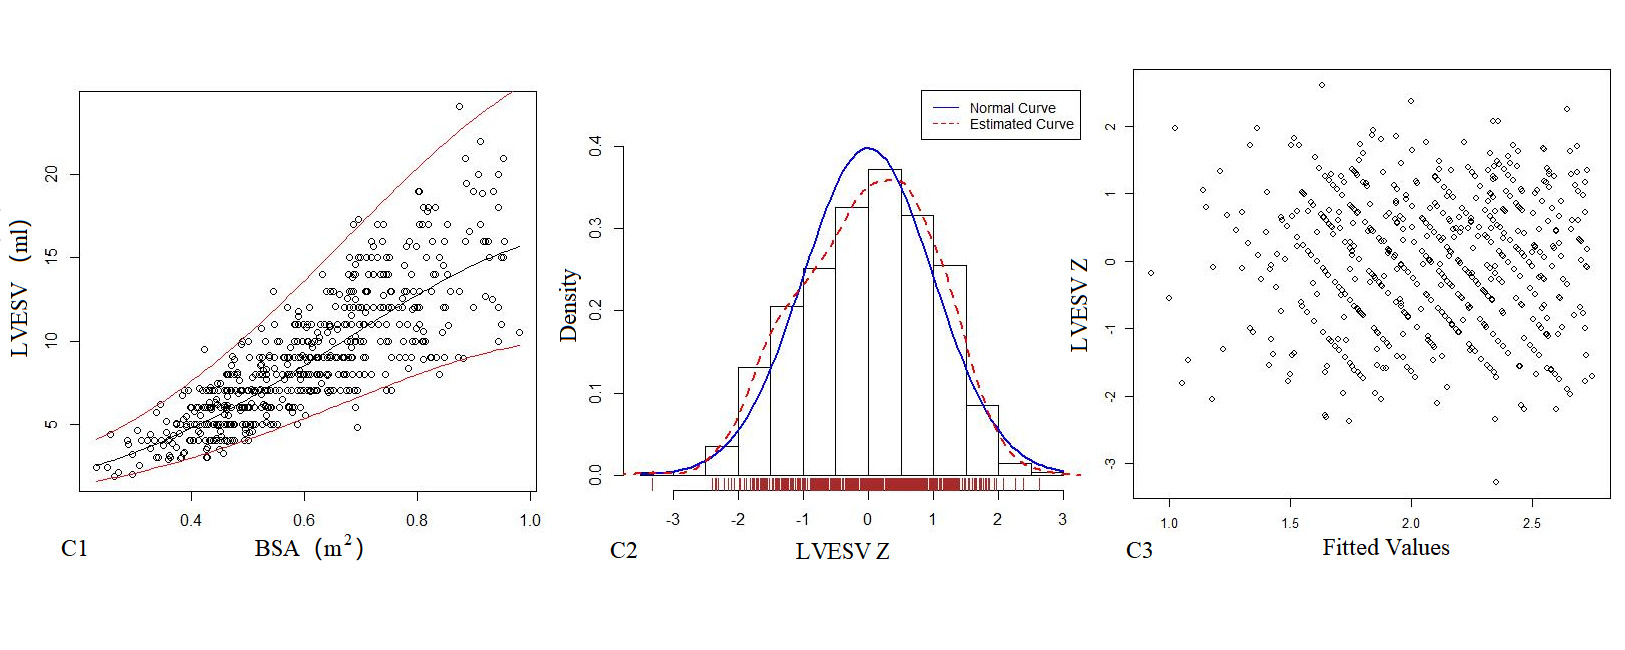
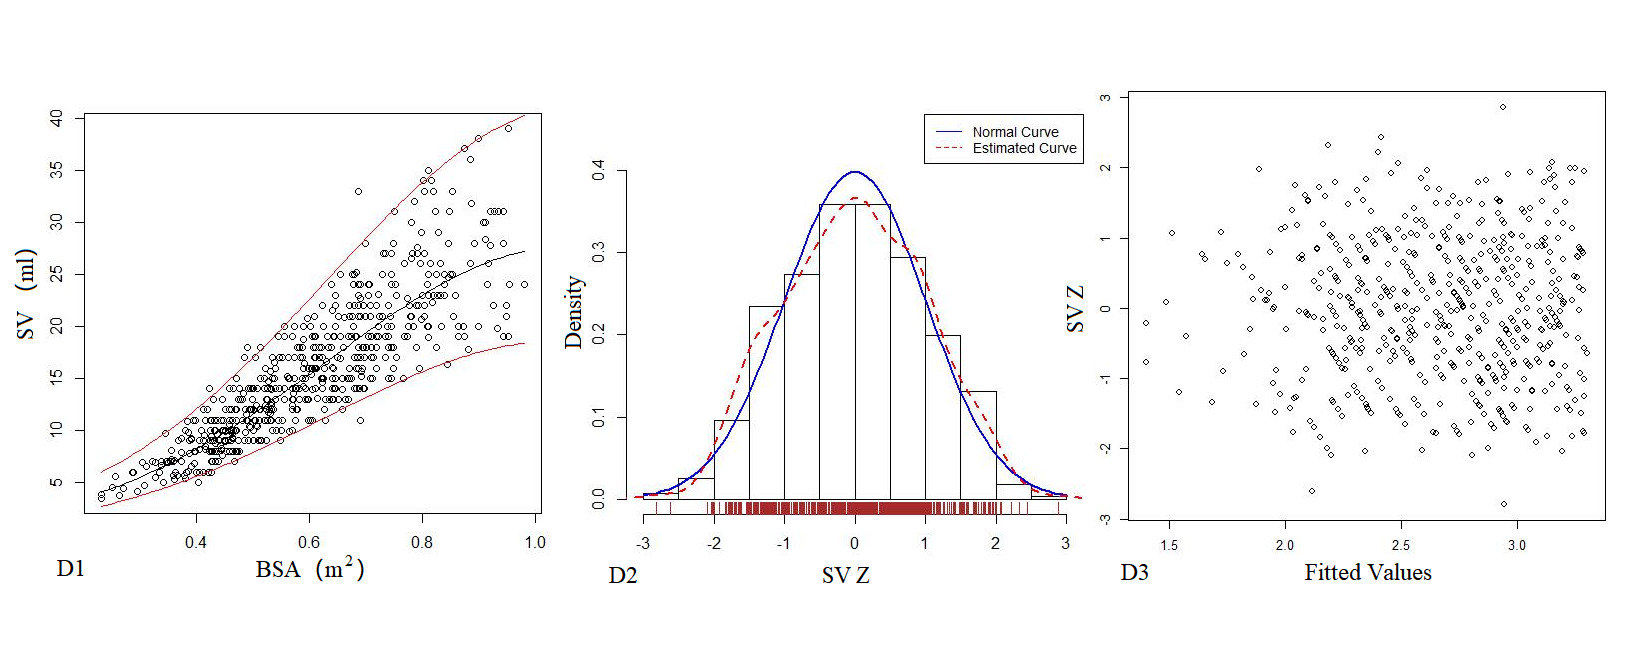
Figure 3. The logarithmic mathematical model of Left heart volume. A: The trend curve between LAV (A1), LVEDV (B1), LVESV (C1), SV (D1) and BSA were non-linear and positive correlation. The distribution of LAV (A2), LVEDV (B2), LVESV (C2), SV (D2); the Z scores showed normal distribution. The Z scores distribution of LAV (A3), LVEDV (B3), LVESV (C3), SV (D3) under different BSA.
Table 5. Echocardiography left heart volume of Z score mathematical mode.
Parameter(y) |
|
Mathematical mode |
R2 |
SE |
LAV(mm) |
Power |
y=-13.24+72.55 x-80.91 x2+ 41.33 x3 |
0.531 |
3.722 |
|
Logarithmic |
lny=-1.74+14.14 x-16.40 x2+6.90 x3 |
0.6136* |
0.2933 |
LVEDV(mm) |
Power |
y= -12.99 + 75.69 x -39.43 x2 + 23.27 x3 |
0.806 |
4.787 |
|
Logarithmic |
lny=0.70+5.73 x-2.67x2 |
0.8179* |
0.1863 |
LVESV(mm) |
Power |
y=-3.12 + 20.78 x -5.96 x2 + 5.41 x3 |
0.701 |
2.326 |
|
Logarithmic |
lny=-0.16+5.22x-2.30x2 |
0.7217* |
0.2384 |
SV(mm) |
Power |
y= 0.66 -1.06x + 59.55 x2 -30.32 x3 |
0.766 |
3.485 |
|
Logarithmic |
lny=0.17+5.98x-2.84x2 |
0.8094* |
0.1958 |
*Mathematical mode representing the highest R2 value
Left heart diameter
We compared ARD (Figure 4) and MV-D (Figure 5) with previously PHN [31] and Michigan [5] for children with a BSA of 0.2 m2 to 1 m2. Our average prediction curve was lower than that of the other two studies, especially when the BSA was >0.5 m2. We noted a significant difference between our Z-score results and those of the other two groups (all P < 0.05). Based on the same measurement data, the Z-score results of the PHN and Michigan formulae showed a nonstandard normal distribution.

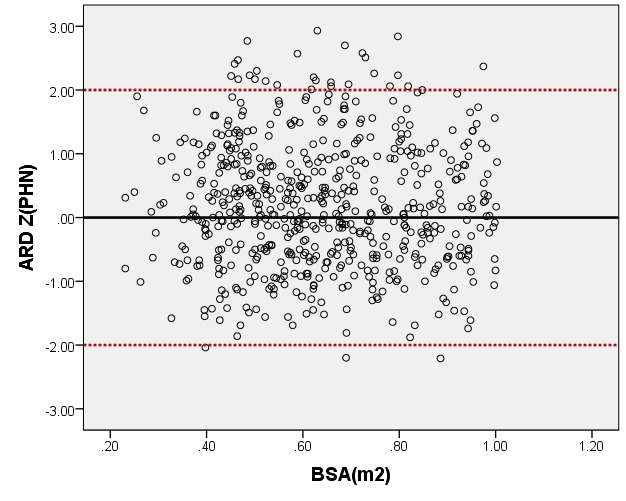
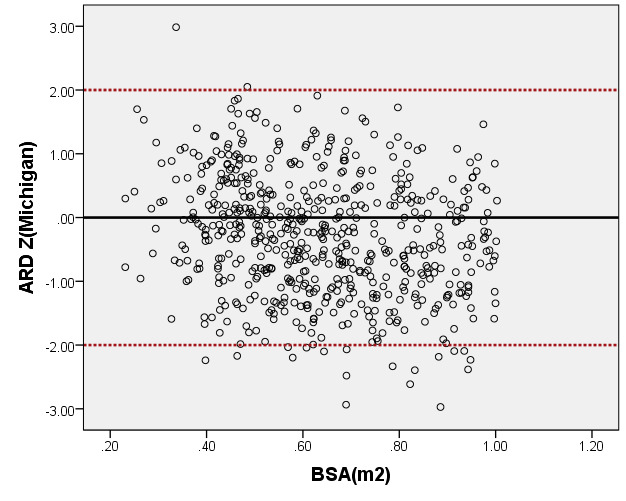
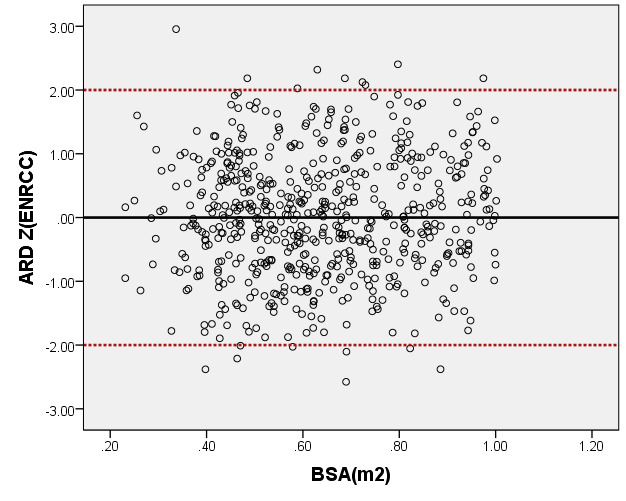
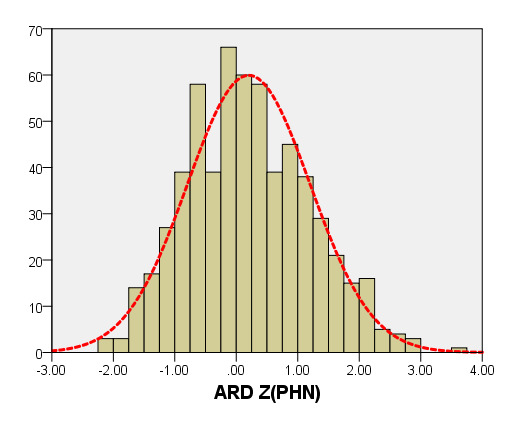
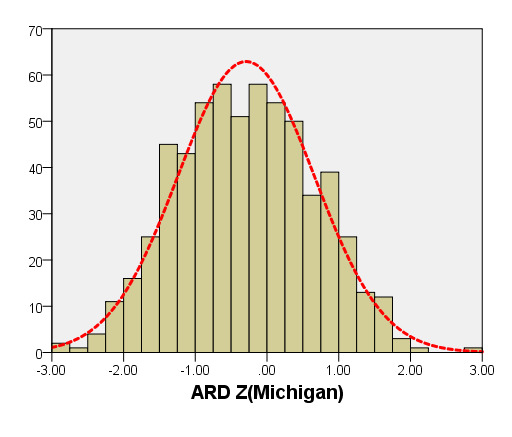
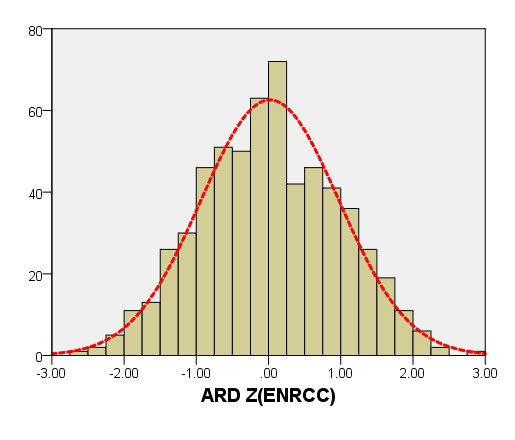
Figure 4. Comparison of ARD with previously published nomograms (PHN’s and Michingan’s formula) for children with BSA of 0.2 ~1m2. A: Black line, our study results; Blue line, published Single center study of Michingan’s report[Michael 2008]; Red line, published PHN’s Committee study [lopez2017]. B: The Z scores distribution of PHN (B1), Michigan (B2), our study (B3) under different BSA. C: The Z scores of PHN (C1), Michigan (C2) showed non-normal distribution, and the Z scores of this study (C3) showed normal distribution.
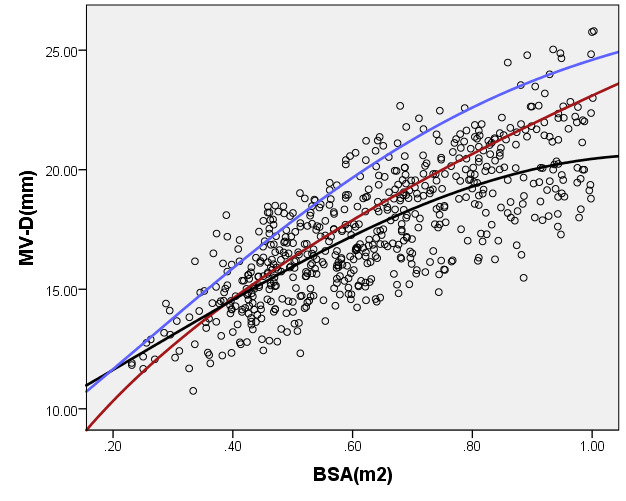
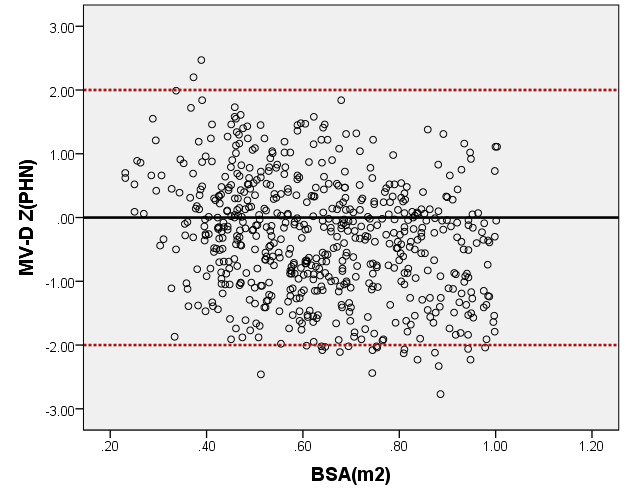
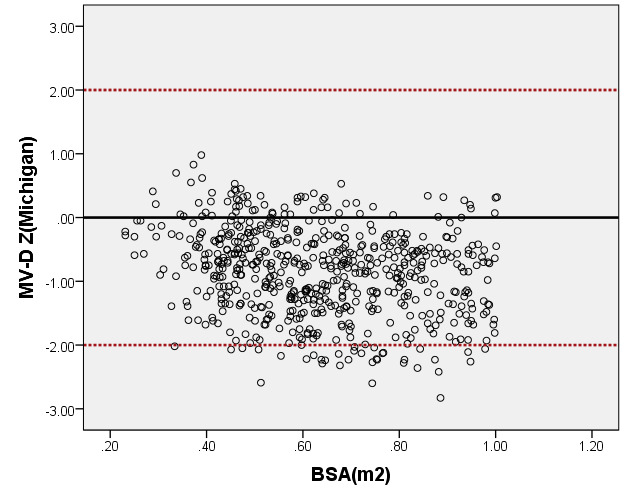
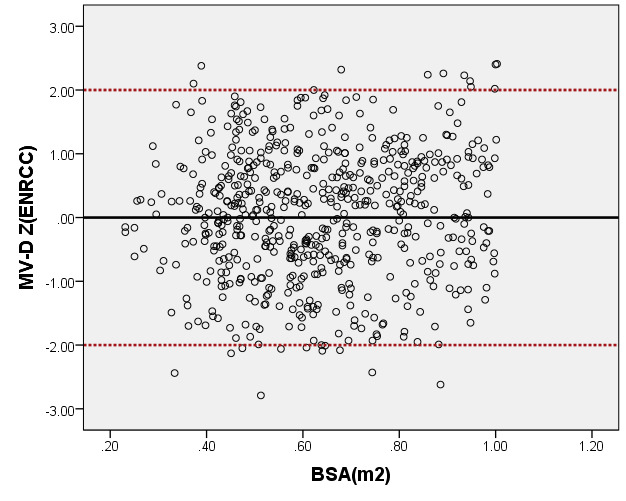
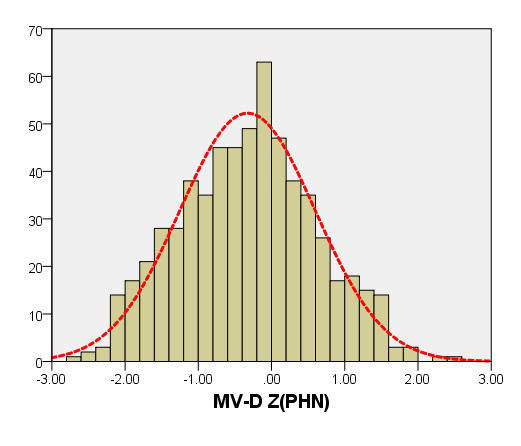
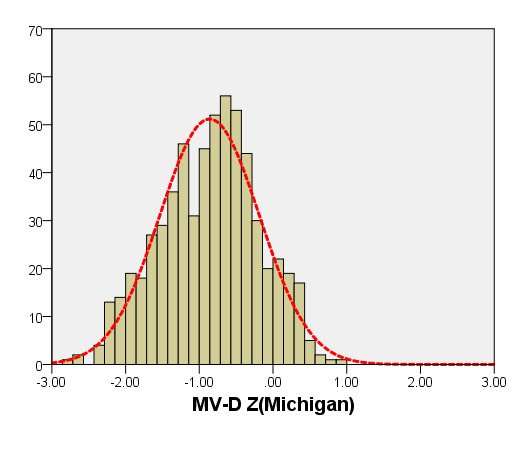
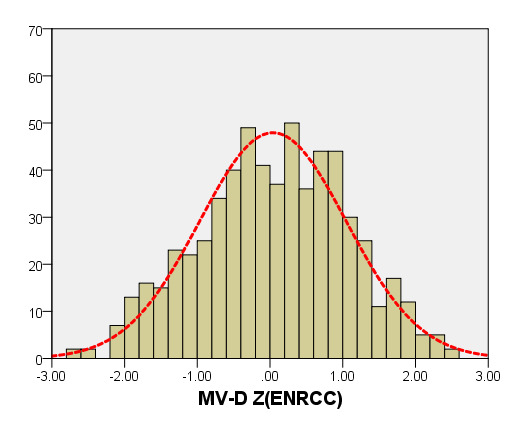
Figure 5. Comparison of MV-D with previously published nomograms (PHN’s and Michingan’s formula) for children with BSA of 0.2 ~1m2. A: Black line, our study results; Blue line, published Single center study by Michingan [Michael 2008]; Red line, published Committee study by PHN[lopez2017]. B: The Z scores scatter plot distribution of PHN (B1), Michigan (B2), this study (B3) under different BSA. C: The Z scores of PHN (C1), Michigan (C2) showed non-normal distribution, and the Z scores of our study (C3) showed normal distribution.
M-mode
We compared the LAD and LVEDd with previously PHN (German [16]) for children with a BSA ranging from 0.2 m2 to 1 m2. As seen in Figure 6, the results of the curve of LVEDd were similar to those of German, but our average prediction curve for LAD was lower (Figure 7). We found a significant difference between our Z-score data and those of German (LVEDd, P = 0.05; LAD, P < 0.05). Based on the same database, the LVEDd and LAD Z-score results of German showed a nonstandard normal distribution. There was a statistically significant difference in Z-scores between the two groups (all P < 0.05).
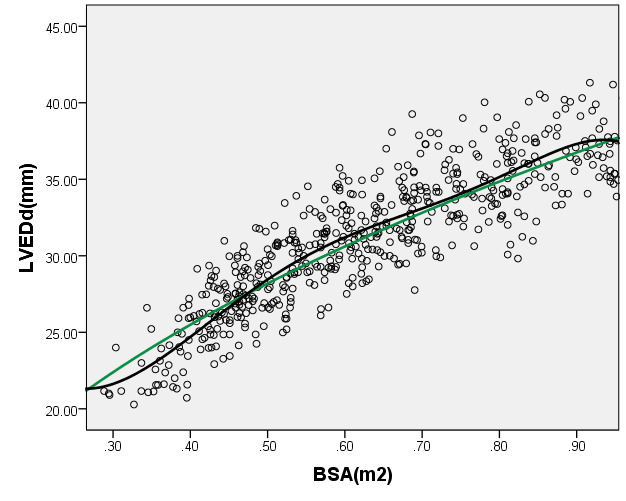
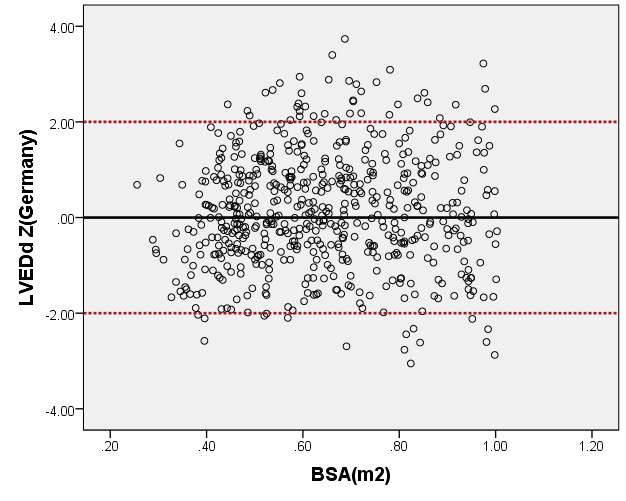
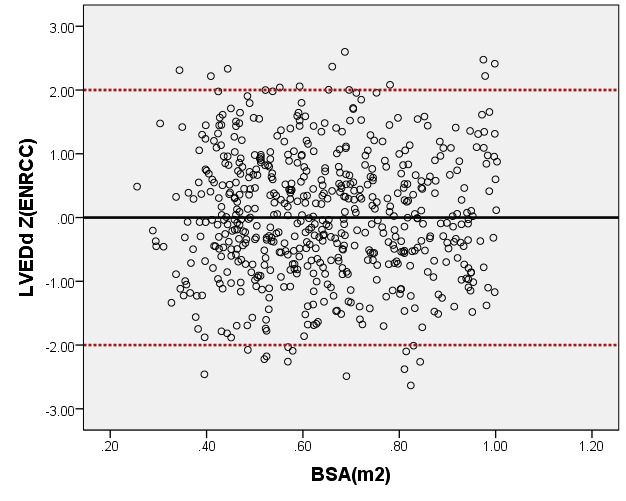
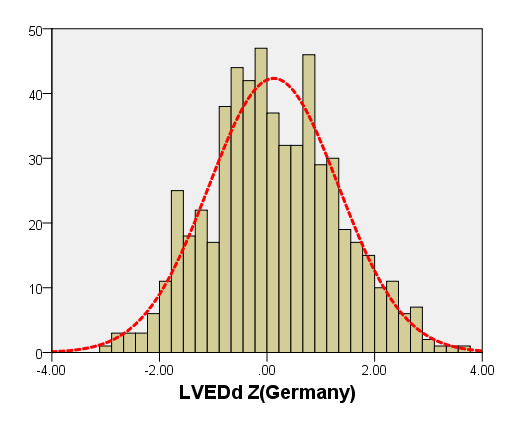
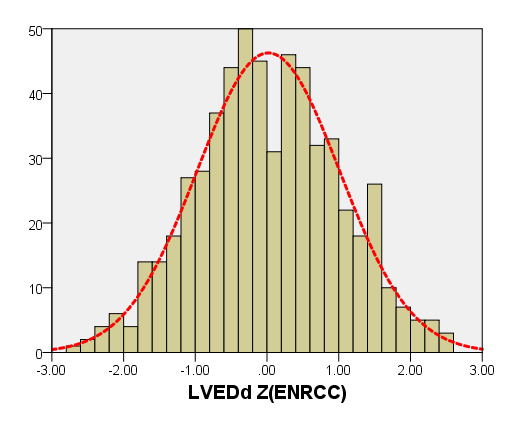
Figure 6. Comparison of LVEDd with previously published nomograms(Germany) for children with BSA of 0.2 ~1m2. A: Black line, our study results; Green line, published nomograms of Germany [Kampmann 2008]. B: The Z scores distribution of Germany (B1), this study (B2) under different BSA. C: The Z scores of Germany (C1) and our study (C2) showed normal distribution.
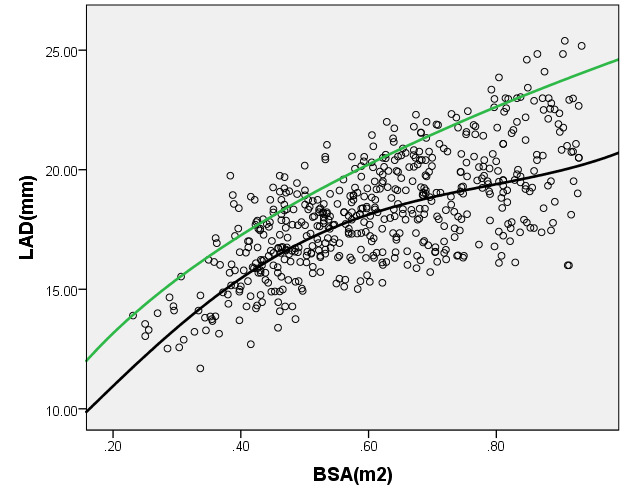
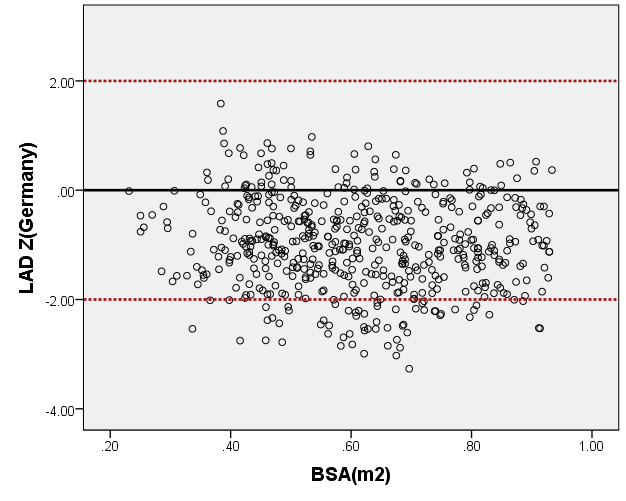
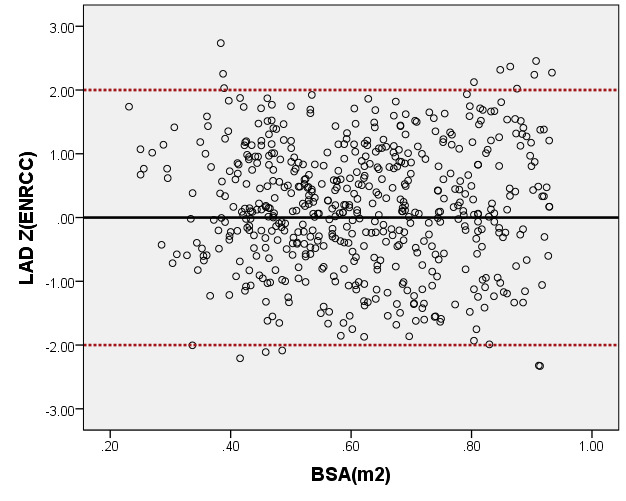
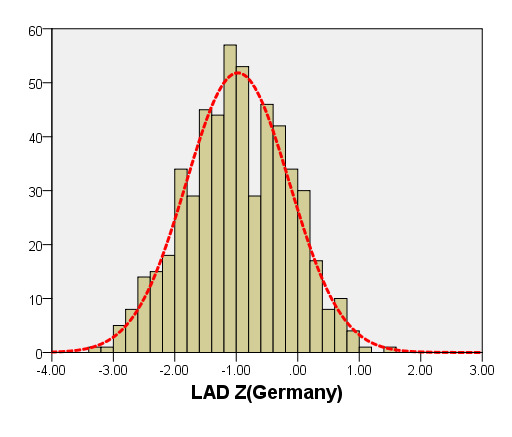
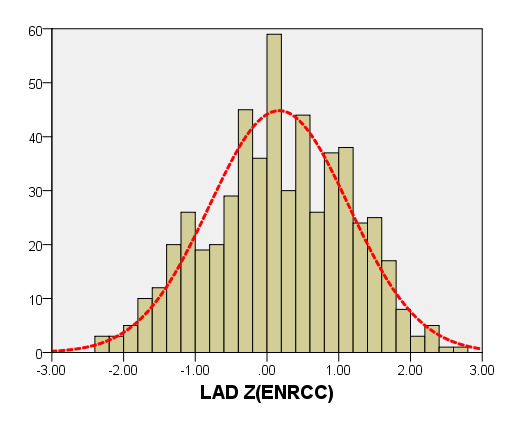
Figure 7. Comparison of LAD with previously published nomograms(Germany) for children with BSA of 0.2 ~1m2. A: Black line, average prediction curve by our study; Green line, published nomograms of Germany’s curve [Kampmann 2008]. B: The Z scores distribution of Germany (B1), this study(B2) under different BSA. C: The Z scores of Germany (C1) showed non-normal distribution, and the Z scores of our study (C2) showed normal distribution.
Left heart volume
We compared the LVEDV with PHN for children with a BSA of 0.2 m2 to 1 m2. As seen in Figure 8, our average prediction of LVEDV was lower than that of PHN [31]. Moreover, the Z-scores results of PHN, based on the same measurement database, showed a nonstandard normal distribution. There was a statistically significant difference in Z-scores between the two groups (all P < 0.05).
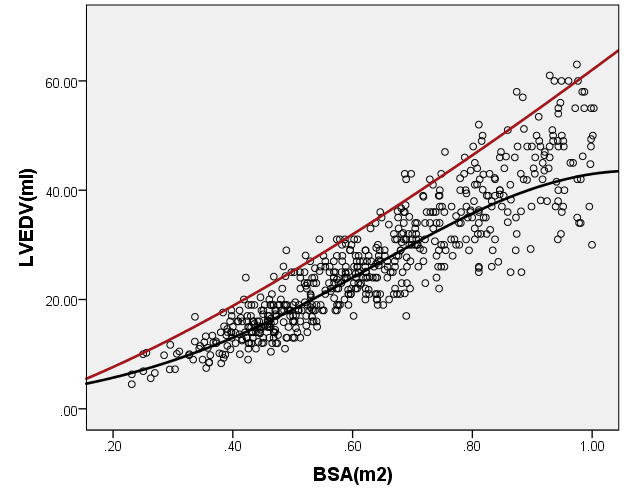
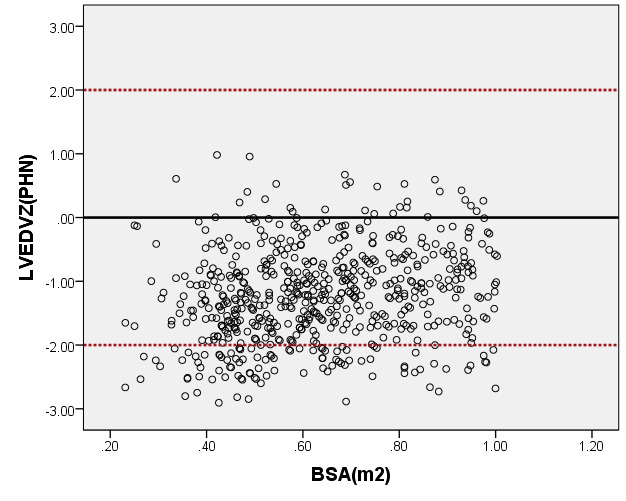
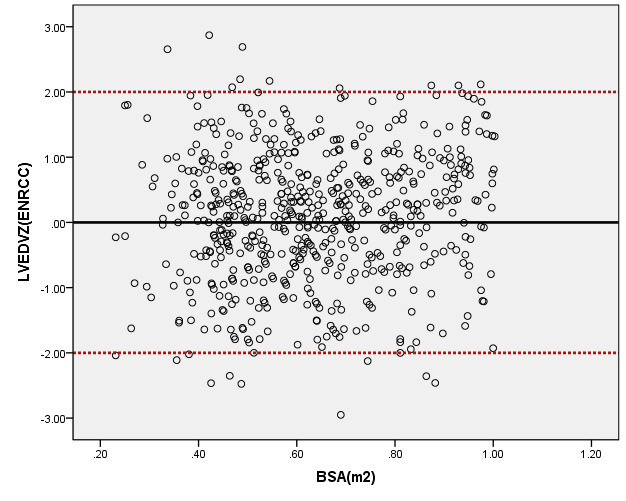
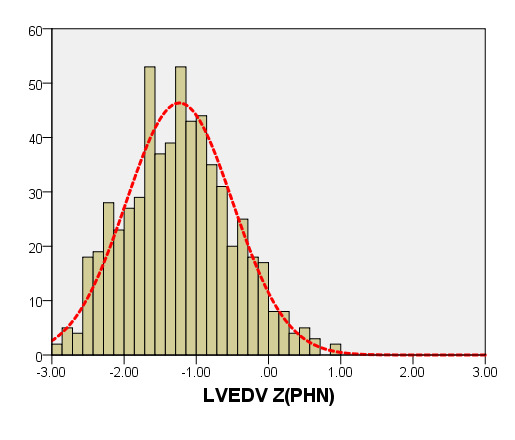
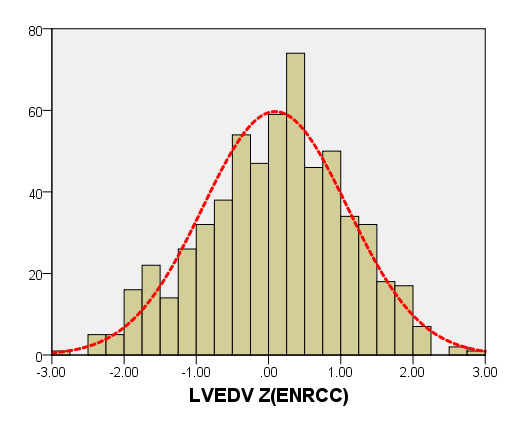
Figure 8. Comparison of LVEDV with previously published nomograms (PHN) for children with BSA of 0.2 ~1m2. A: Black line, average prediction curve by our study; Red line, published Committee study of PHN[lopez2017]. B: The Z scores distribution of PHN (B1), ENRCC (B2) under different BSA. C: The Z scores of PHN (C1) showed non-normal distribution, and the Z scores of this study (C2) showed normal distribution.
This study included healthy Han children from multiple centres in cities in China, from which we obtained a regression model of normal reference values of echocardiography. Among children with the same BSA, the regression formula was different from that of Caucasians (such as North America and Europe). When using the Caucasian regression model for Chinese children, the Z-score results were seriously biased. Therefore, we believe that the multicenter results of this project are more suitable for quantifying the echocardiography results of the structure and function of the heart of urban Chinese children. Children of different races, genetics and dietary habits have quite different growth trends in terms of physique. There is a nonlinear positive correlation between the size of the left heart of children and the BSA [33]. In our nonlinear mathematical model (exponent, power, square root), we selected the optimal model and performed the standard normal test of the Z-scores as well as established a mathematical model of the normal reference value of echocardiography for Chinese children. The results of the Z-score value are helpful for evaluating the changes in cardiac structure and function and its degree of abnormality, they and meet the recommended requirements of the guide [29].
In this multicenter study, to ensure quality control, we use the same consistent method for M-mode, two-dimensional and biplane echocardiography measurements [30]. The echocardiographic measurement results of the left heart of healthy children showed a normal distribution or an approximate normal distribution under the same BSA, but they also showed a heteroscedastic distribution under different BSAs, which is consistent with the findings of other research. Therefore, to represent the changes in the reference value range of each age group, we used a nonlinear regression predictive model. The regression mathematical model can be implanted into the instrument to allow for the automatic calculation of the Z-score. The Z-score is used to express the results of the quantitative analysis in the echocardiogram report, which is convenient for clinical application [4,9,11,34]. The Z-score has been increasingly used in the perioperative period of paediatric congenital heart disease. For example, in patients with severe aortic stenosis and left heart dysplasia who undergo double ventricular correction and Norwood surgery, the changes in the Z-score of the inner diameter of the aortic valve annulus, ascending aorta inner diameter and longitudinal diameter of the left ventricular cavity are important factors affecting survival [35]. In children with Marfan syndrome, the degree of expansion of the aortic root and aortic sinus, as well as the follow-up of the dynamic changes of the degree of expansion, are essential for the diagnosis as well as for distinguishing between normal growth and pathological aortic expansion, and these measures can be used determine the most optimal timing of surgery [18]. The most commonly used evaluation index for the diagnosis of dilated cardiomyopathy in infants and young children is the size of the left ventricle, and it is an important basis for measuring the effectiveness of drug treatment [36].
Using the regression model of PHN, Pettersen and Kampmann [16,31,32], we calculated the Z-score value from the original heart data of Chinese children. The results indicated that the Z-score value does not conform to the standard normal distribution under the same BSA, and we found a statistically significant difference in the echocardiographic parameters of left heart diameter between Chinese children and Western children. When the BSA is greater than 0.4 m2, the predicted value of the left heart diameter of Chinese children is smaller than that of white children. This suggests that, in clinical applications, it is necessary to consider the same application conditions of the regression model, that is, the same race, same BSA and same measurement method. The instruments manufactured by North American and European companies have built-in relevant Z-score calculation tools; thus, when used in Chinese children to determine the size of the heart structure, they may underestimate the results. Therefore, the clinician should consider race differences when using normal reference values for Z-score calculations [31].
Previously published studies consist of only single-centre studies of Chinese children undergoing echocardiography, and the subjects were from local areas. Different growth and development are observed among Chinese children in cities and villages as well as plateaus and coastal areas. This study was conducted in eight urban centres (Guangdong, Shanghai, Sichuan, Jiangsu, Hunan, Shandong, Yunnan and Jilin) and collected data on Chinese children from southern, eastern and western China. The data are representative of Chinese Han children, and the mathematical model of the echocardiography Z-scores is universal.
We originally designed this study to collect data of healthy children aged 1 month to 18 years. However, during the course of our research, we found that in children older than 7 years, the results of the left heart diameter were statistically different between male and female subjects. Therefore, we studied children older than 7 years and children younger than 7 years separately. Children older than 7 years were modelled according to gender differences. However, in this study of healthy children aged ≤7 years, we found no significant difference in left heart diameter between boys and girls with the same BSA, which was consistent with the findings of previous studies [37,38]. Thus, the regression model and Z-score trend chart are applicable only to children ≤7 years. In future research, we will perform statistical analysis on the left ventricular structural parameters of children >7 years. This study can establish a perfect reference value system for echocardiography in Chinese children. Previous studies have shown differences in the echocardiographic indicators between boys and girls with the same BSA after puberty [31]. Therefore, the regression model of various parameters for children >7 years of age may be more suitable for separate statistics for male and female patients. Some studies have shown statistical differences in the valve area and myocardial mass between boys and girls before puberty [39,40] but additional research is required in this area.
The normal echocardiography reference value based on the BSA of healthy Chinese children from multiple centres is helpful for accurately defining abnormalities of heart structure and function, and it has important clinical significance for the diagnosis and treatment of children’s heart disease in Chinese children.
We would like to thank the children and parents included in this study.
Thanks to the continuous and excellent support of all authors and colleagues.
This research received a specific grant from the funding agencies Sanming Project of Medicine in Shenzhen (SZSM201612003) and Natural Science Foundation of China (62071309).
- Huwez FU, Houston AB, Watson J, McLaughlin S, Macfarlane PW (1994) Age and body surface area related normal upper and lower limits of M mode echocardiographic measurements and left ventricular volume and mass from infancy to early adulthood. Br Heart J 72: 276-280. [Crossref]
- Sluysmans T, Colan SD (2005) Theoretical and empirical derivation of cardiovascular allometric relationships in children. J Appl Physiol 99: 445-457. [Crossref]
- George K, Sharma S, Batterham A, Whytes G, McKenna W (2001) Allometric analysis of the association between cardiac dimension and body size variables in 464 junior athletes. Clinical Science 100: 47-54. [Crossref]
- Bonatto RC, Fioretto JR, Okoshi K, Matsubara BB, Padovani CR, et al. (2006) Percentile curves of normal values of echocardiographic measurements in normal children from the central-southern region of the State of São Paulo, Brazil. Arq Bras Cardiol 87: 711-721. [Crossref]
- Kaldararova M, Balazova E, Tittel P, Stankovicova I, Brucknerova I, et al. (2007) Echocardiographic measurements of the aorta in normal children and young adults. Bratisl Lek Listy 108: 437-441. [Crossref]
- Pettersen MD, Du W, Skeens ME, Humes RA (2008) Regression equations for calculation of z scores of cardiac structures in a large cohort of healthy infants, children, and adolescents: an echocardiographic study. J Am Soc Echocardiogr 21: 922-934. [Crossref]
- Lytrivi ID, Bhatla P, Ko HH, Yau J, Geiger MK, et al. (2011) Normal values for left ventricular volume in infants and young children by the echocardiographic subxiphoid five sixth area by length (bullet) method. J Am Soc Echocardiogr 24: 8. [Crossref]
- Neilan TG, Pradhan AD, King ME, Weyman AE (2009) Derivation of a size independent variable for scaling of cardiac dimensions in a normal paediatric population. Eur J Echocardiogr 10: 50-55. [Crossref]
- Henry C, John MS (2012) The use of Z-scores in paediatric cardiology. Ann Pediatr Cardiol 5: 179-184. [Crossref]
- Mawad W, Drolet C, Dahdah N, Dallaire F (2012) A review and critique of the statistical methods used to generate reference values in pediatric echocardiography. J Am Soc Echocardiogr 26: 29-37. [Crossref]
- Overbeek LI, Kapusta L, Peer PG, de Korte CL, Thijssen JM, et al. (2006) New reference values for echocardiographic dimensions of healthy Dutch children. Eur J Echocardiogr 7: 113-121. [Crossref]
- Dallaire F, Dahdah N (2011) New Equations and a Critical Appraisal of Coronary Artery Z Scores in Healthy Children. J Am Soc Echocardiogr 24: 60-74. [Crossref]
- Poutanen T, Tikanoja T, Sairanen H, Jokinen E (2003) Normal aortic dimension and flow in 168 children and young adults. Clin Physiol Funct Imaging 23: 224-229. [Crossref]
- Poutanen T, Tikanoja T, Sairanen H, Jokinen E (2006) Normal mitral and aortic valve areas assessed by three- and two-dimensional Echocardiography in 168 children and young adults. Pediatr Cardiol 27: 217-225. [Crossref]
- Gagnon C, Bigras JL, Fouron JC, Dallaire F (2016) Reference Values and Z Scores for Pulsed-Wave Doppler and M-Mode Measurements in Fetal Echocardiography. J Am Soc Echocardiogr 29: 448-460. [Crossref]
- Kampmann C, Wiethoff CM, Wenzel A, Stolz G, Betancor M, et al. (2000) Normal values of M mode echocardiographic measurements of more than 2000 healthy infants and children in central Europe. Heart 83: 667-672. [Crossref]
- Foster BJ, Mackie AS, Mitsnefes M, Ali H, Mamber S, et al. (2008) A novel method of expressing left ventricular mass relative to body size in children. Circulation 117: 2769-2775. [Crossref]
- Gautier M, Detaint D, Fermanian C, Aegerter P, Delorme G, et al. (2010) Nomograms for aortic root diameters in children using two-dimensional echocardiography. Am J Cardiol 105: 888-894. [Crossref]
- Huicho L, Muro M, Pacheco A, Silva J, Gloria E, et al. (2005) Cross sectional study of echocardiographic characteristics in healthy childrenliving at high altitude. Am J Hum Biol 17: 704-717. [Crossref]
- Cantinotti M, Scalese M, Murzi B, Assanta N, Spadoni I, et al. (2014) Echocardiographic nomograms for ventricular, valvular and arterial dimensions in caucasian children with a special focus on neonates, infants and toddlers. J Am Soc Echocardiogr 27: 179-191. [Crossref]
- Yang HY, Zhang JG, Li JR, Xu F, Zhou WX, et al. (1990) The normal values of cardiac structure and function in Chinese were measured by M-mode and B-mode Echocardiography in 797 cases. Chin Circ J 5: 184-186.
- Deng HY, Huang GY, Ma XJ (2006) Measurements of Echocardiography in 1344 healthy children. J Chin Clin Med Imaging 17: 301-303.
- Wang SS, Zhang YQ, Chen SB, Huang GY, Zhang HY, et al. (2017) Regression equations for calculation of Z scores for echocardiographic measurements of right heart structures in healthy han chinese children. J Clin Ultrasound 45: 293-303. [Crossref]
- Wang SS, Hong WJ, Zhang YQ, Chen SB, Huang GY, et al. (2018) Regression equations for calculation of Z scores for echocardiographic measurements of left heart structures in healthy Han Chinese children. J Clin Ultrasound 46: 328-333. [Crossref]
- Mi J, Wang TY, Meng LH, Zhu GJ, Han SM, et al. (2010) Development of blood pressure reference standards for Chinese children and adolescents (in Chinese). Chin J Evid Based Pediatr 5: 4–14.
- Henry WL, Ware J, Gardin JM, Hepner SI, McKay J, et al. (1978) Echocardiographic measurements in normal subjects. Growth-related changes that occur between infancy and early adulthood. Circulation 57: 278-285.
- Tan TH, Wong KY, Cheng TK (2003) Coronary normograms and the coronary-aorta index: objective determinants of coronary artery dilation. Pediatr Cardiol 24: 328-335.[Crossref]
- Lai WW, Geva T, Shirali GS, Frommelt PC, Humes RA, et al. (2006) Guidelines and standards for performance of a pediatric echocardiogram: a report from the Task Force of the Pediatric Council of the American Society of Echocardiography. J Am Soc Echocardiogr 19: 1413-1430. [Crossref]
- Lang RM, Badano LP, Mor-Avi V, Afilalo J, Armstrong A, et al. (2014) Recommendations for cardiac chamber quantification by echocardiography in adults: an update from the American Society of Echocardiography and the European Association of Cardiovascular Imaging. J Am Soc Echocardiogr 28: 1-39. [Crossref]
- Lopez L, Colan SD, Frommelt PC, Ensing GJ, Kendall K, et al. (2010) Recommendations for quantification methods during the performance of a pediatric echocardiogram: a report from the Pediatric Measurements Writing Group of the American Society of Echocardiography Pediatric and Congenital Heart Disease Council. J Am Soc Echocardiogr 23: 465-495. [Crossref]
- Lopez L, Colan S, Stylianou M, Granger S, Trachtenberg F, et al. (2017) Relationship of Echocardiographic Z Scores Adjusted for Body Surface Area to Age, Sex, Race, and Ethnicity: The Pediatric Heart Network Normal Echocardiogram Database. Circ Cardiovasc Imaging 10: e006979. [Crossref]
- Pettersen MD, Du W, Skeens ME, Humes RA (2008) Regression equations for calculation of z scores of cardiac structures in a large cohort of healthy infants, children, and adolescents: an echocardiographic study. J Am Soc Echocardiogr 21: 922-934. [Crossref]
- Neilan TG, Pradhan AD, King ME, Weyman AE (2009) Derivation of a size-independent variable for scaling of cardiac dimensions in a normal paediatric population. Eur J Echocardiogr 10: 50-55. [Crossref]
- Colan SD (2012) The why and how of Z scores. J Am Soc Echocardiogr 26: 38-40. [Crossref]
- François K, Bové T, Panzer J, De Groote K, Vandekerckhove K, et al. (2012) Univentricular heart and Fontan staging: analysis of factors impacting on body growth. Eur J Cardiothorac Surg 41: e139-145. [Crossref]
- Lytrivi ID, Bhatla P, Ko HH, Yau J, Geiger MK, et al. (2011) Normal values for left ventricular volume in infants and young children by the echocardiographic subxiphoid five-sixth area by length (bullet) method. J Am Soc Echocardiogr 24: 214-218. [Crossref]
- Daubeney PE, Blackstone EH, Weintraub RG, Slavik Z, Scanlon J, et al. (1999) Relationship of the dimension of cardiac structures to body size: an echocardiographic study in normal infants and children. Cardiol Young 9: 402-410. [Crossref]
- O'Leary PW, Durongpisitkul K, Cordes TM, Bailey KR, Hagler DJ, et al. (1998) Diastolic ventricular function in children: a Doppler echocardiographic study establishing normal values and predictors of increased ventricular end-diastolic pressure. Mayo Clin Proc 73: 616-628. [Crossref]
- de Simone G, Devereux RB, Daniels SR, Meyer RA (1995) Gender differences in left ventricular growth. Hypertension 26: 979-983. [Crossref]
- Zilberman MV, Khoury PR, Kimball RT (2005) Two-dimensional echocardiographic valve measurements in healthy children: gender-specific differences. Pediatr Cardiol 26: 356-360. [Crossref]
Editorial Information
Editor-in-Chief
Michael A. Portman
University of Washington, USA
Article type
Research Article
Publication History
Received: Dec 06, 2021
Accepted: Dec 20, 2021
Published: Dec 26, 2021
Copyright
©2021 Xia B. This is an open-access article distributed under the terms of the Creative Commons attribution License, which permits unrestricted use, distribution, and reproduction in any medium, provided the original author and source are credited.
Citation
Xia B, Chen S, Chen W, Liu W, Zhao X, et al. (2021) Multicenter normal reference value and Z-score mathematical model of the left heart in Chinese children by echocardiography: A comparative study. Pediatr Dimensions 6: DOI: 10.15761/PD.1000218.
Figure 1. The logarithmic mathematical model of M-mode Echocardiography. The trend curves of correlation distribution between LVEDd (A1), LVEDs (B1), LAD (C1) and BSA of M-mode Echocardiography are all non-linear and positive correlation. The specific gravity bar graphs of LVEDd (A2), LVEDs (B2) and LAD (C2) Z score distribution are normal distribution. The scatter plots of LVEDd (A3), LVEDs (B3), LAD (C3) Z score distribution under different BSA.
Figure 2. The logarithmic mathematical model of left heart diameter. The distribution trend curves of MVD (A1), ARD (B1), ASD (C1), STJ (D1), AAO (E1), PTA (F1), DTA (G1), AI (H1) and BSA were non-linear and positive correlation. The distribution of MVD (A2), ARD (B2), ASD (C2), STJ (D2), AAO (E2), PTA (F2), DTA (G2), AI (H2) Z sores results showed normal distribution. The Z score scatter plots of MVD (A3), ARD (B3), ASD (C3), STJ (D3), AAO (E3), PTA (F3), DTA (G3), AI (H3) distribution under different BSA.
Figure 3. The logarithmic mathematical model of Left heart volume. A: The trend curve between LAV (A1), LVEDV (B1), LVESV (C1), SV (D1) and BSA were non-linear and positive correlation. The distribution of LAV (A2), LVEDV (B2), LVESV (C2), SV (D2); the Z scores showed normal distribution. The Z scores distribution of LAV (A3), LVEDV (B3), LVESV (C3), SV (D3) under different BSA.
Figure 4. Comparison of ARD with previously published nomograms (PHN’s and Michingan’s formula) for children with BSA of 0.2 ~1m2. A: Black line, our study results; Blue line, published Single center study of Michingan’s report[Michael 2008]; Red line, published PHN’s Committee study [lopez2017]. B: The Z scores distribution of PHN (B1), Michigan (B2), our study (B3) under different BSA. C: The Z scores of PHN (C1), Michigan (C2) showed non-normal distribution, and the Z scores of this study (C3) showed normal distribution.
Figure 5. Comparison of MV-D with previously published nomograms (PHN’s and Michingan’s formula) for children with BSA of 0.2 ~1m2. A: Black line, our study results; Blue line, published Single center study by Michingan [Michael 2008]; Red line, published Committee study by PHN[lopez2017]. B: The Z scores scatter plot distribution of PHN (B1), Michigan (B2), this study (B3) under different BSA. C: The Z scores of PHN (C1), Michigan (C2) showed non-normal distribution, and the Z scores of our study (C3) showed normal distribution.
Figure 6. Comparison of LVEDd with previously published nomograms(Germany) for children with BSA of 0.2 ~1m2. A: Black line, our study results; Green line, published nomograms of Germany [Kampmann 2008]. B: The Z scores distribution of Germany (B1), this study (B2) under different BSA. C: The Z scores of Germany (C1) and our study (C2) showed normal distribution.
Figure 7. Comparison of LAD with previously published nomograms(Germany) for children with BSA of 0.2 ~1m2. A: Black line, average prediction curve by our study; Green line, published nomograms of Germany’s curve [Kampmann 2008]. B: The Z scores distribution of Germany (B1), this study(B2) under different BSA. C: The Z scores of Germany (C1) showed non-normal distribution, and the Z scores of our study (C2) showed normal distribution.
Figure 8. Comparison of LVEDV with previously published nomograms (PHN) for children with BSA of 0.2 ~1m2. A: Black line, average prediction curve by our study; Red line, published Committee study of PHN[lopez2017]. B: The Z scores distribution of PHN (B1), ENRCC (B2) under different BSA. C: The Z scores of PHN (C1) showed non-normal distribution, and the Z scores of this study (C2) showed normal distribution.
Table 1. Participating Medical Multi-center Members.
Member |
Affiliation |
City, Province |
Bei Xia |
Shenzhen Children's Hospital Affiliated to China Medical University |
Shenzhen, Guandong |
Wei Yu |
Shenzhen Children's Hospital Affiliated to China Medical University |
Shenzhen, Guandong |
Shu-Bao Chen |
Shanghai Children's Medical Center, Medical College of Shanghai Jiaotong University |
Shanghai |
Qing-Hua Liu |
Qilu Children's Hospital of Shandong University |
Jinan, Shandong |
Wen-juan Chen |
Children's Hospital of Hunan Province |
Changsha, Hunan |
Shan-liang Zhu |
Nanjing Children's Hospital, |
Nanjing, Jiangsu |
Mei Jin |
Chengdu Women's and Children's Center Hospital |
Chengdu, Sichuan |
Jie-Qin Min |
Children's Hospital Affiliated to Kunming Medical University |
Kunming,Yunan |
Yang Xu |
The First Affiliated Hospital of Jilin University |
Chuangchun, Jilin |
Table 2. Comparison of basic indicators and echocardiographic results of Male and Female children.
Index |
Male
(n=300) |
Female
(n=286) |
t |
p |
Age (month) |
35.06 ± 23.26 |
34.96 ± 22.70 |
0.96 |
0.69 |
Heart rate (times/min) |
101.90 ± 17.32 |
106.03 ± 17.93 |
0.01 |
0.56 |
Height (cm) |
93.19 ± 17.85 |
91.24 ± 17.88 |
0.21 |
0.95 |
Weight (kg) |
14.44 ± 5.49 |
13.65 ± 5.58 |
0.10 |
0.76 |
BSA(m2) |
0.61 ± 0.16 |
0.59 ± 0.17 |
0.10 |
0.64 |
SBP(mmHg) |
93.23 ± 12.33 |
91.95 ± 12.06 |
0.25 |
0.76 |
DBP(mmHg) |
56.12 ± 10.98 |
56.08 ± 11.22 |
0.96 |
0.71 |
EF(%) |
63.97 ± 4.70 |
64.32 ± 4.55 |
0.62 |
0.39 |
SV(ml) |
15.44 ± 5.96 |
14.77 ± 6.34 |
0.22 |
0.31 |
CO(L/min) |
1.54 ± 0.49 |
1.47 ± 0.49 |
0.12 |
0.78 |
CI(L/min·m2) |
2.59 ± 0.49 |
2.54 ± 0.46 |
0.27 |
0.51 |
BSA: body surface area; SBP: Systolic blood pressure; DBP: Diastolic blood pressure
Table 3. M-mode Echocardiography of Z-score mathematical mode.
Parameter(y) |
|
Mathematical mode |
R2 |
SE |
LVEDd(mm) |
Power |
1.438 + 84.81 x2 -74.73x2 + 26.76x3 |
0.764 |
2.138 |
|
Logarithmic |
lny=5.59-26.89x+103.35x2-178.89x3+146.73x4-46.31x5 |
0.7816* |
0.0685 |
LVEDs(mm) |
Power |
y=4.34+34.96x-12.58x2 -2.19x3 |
0.707 |
1.753 |
|
Logarithmic |
lny=2.10 +2.18 x -1.08 x2 |
0.721* |
0.0853 |
LAD(mm) |
Power |
y=-3.95+79.61x-96.20x2+41.12 x3 |
0.445 |
1.63 |
|
Logarithmic |
lny=1.77+3.96x-4.64x2 +1.94 x3 |
0.637* |
0.0906 |
*Mathematical mode representing the highest R2 value
Table 4. Echocardiography left heart diameter of Z score mathematical mode.
Parameter(y) |
|
Mathematical mode |
R2 |
SE |
MV-D(mm) |
Power |
y=4.43+34.67x-29.45x2+11.22x3 |
0.581 |
1.683 |
|
Logarithmic |
lny=2.17+1.54 x-0.69 x2 |
0.5821* |
0.0961 |
ARD(mm) |
Power |
y=2.16+22.66x-13.32x2 + 2.69x3 |
0.655 |
1.104 |
|
Logarithmic |
lny=1.39+3.16 x-2.92x2+1.06 x3 |
0.6585* |
0.0968 |
ASD(mm) |
Power |
y= 2.31+34.99x-24.86 x2 + 6.87 x3 |
0.648 |
1.489 |
|
Logarithmic |
lny=1.68+3.30 x-3.15x2+1.15 x3 |
0.6529* |
0.0945 |
STJ(mm) |
Power |
y= 4.72 + 13.97 x + 0.29 x2-4.25 x3 |
0.559 |
1.316 |
|
Logarithmic |
lny=1.74+1.81 x-0.86 x2 |
0.5662* |
0.107 |
AAO(mm) |
Power |
y= 2.65+23.69 x -11.73 x2 + 1.07 x3 |
0.612 |
1.335 |
|
Logarithmic |
lny=1.71+2.01 x-0.96 x2 |
0.6181* |
0.1052 |
PTA(mm) |
Power |
y=0.53+30.62 x -25.54 x2 + 9.02 x3 |
0.629 |
1.261 |
|
Logarithmic |
lny=1.57+2.11 x-1.03 x2 |
0.6378* |
0.1084 |
DTA(mm) |
Power |
y= 1.01 + 27.10 x -23.78 x2 + 9.24 x3 |
0.593 |
1.230 |
|
Logarithmic |
lny=1.54+1.95 x-0.92 x2 |
0.629* |
0.1152 |
AI(mm) |
Power |
y= 1.09 + 21.91 x + -13.66 x2 + 2.53 x3 |
0.526 |
1.251 |
|
Logarithmic |
lny=1.35+2.31 x-1.22 x2 |
0.5235* |
0.129 |
Table 5. Echocardiography left heart volume of Z score mathematical mode.
Parameter(y) |
|
Mathematical mode |
R2 |
SE |
LAV(mm) |
Power |
y=-13.24+72.55 x-80.91 x2+ 41.33 x3 |
0.531 |
3.722 |
|
Logarithmic |
lny=-1.74+14.14 x-16.40 x2+6.90 x3 |
0.6136* |
0.2933 |
LVEDV(mm) |
Power |
y= -12.99 + 75.69 x -39.43 x2 + 23.27 x3 |
0.806 |
4.787 |
|
Logarithmic |
lny=0.70+5.73 x-2.67x2 |
0.8179* |
0.1863 |
LVESV(mm) |
Power |
y=-3.12 + 20.78 x -5.96 x2 + 5.41 x3 |
0.701 |
2.326 |
|
Logarithmic |
lny=-0.16+5.22x-2.30x2 |
0.7217* |
0.2384 |
SV(mm) |
Power |
y= 0.66 -1.06x + 59.55 x2 -30.32 x3 |
0.766 |
3.485 |
|
Logarithmic |
lny=0.17+5.98x-2.84x2 |
0.8094* |
0.1958 |
*Mathematical mode representing the highest R2 value