Abstract
Near-patient testing eliminates times for transportation and processing of samples thus reducing test turnaround times. Complete blood counts (CBC) are often requested in primary care. The aim of the present study was to evaluate if the HemoScreen™ instrument could be used in a primary care setting. We compared CBC results from 160 primary care samples measured with both the Sysmex XN and the HemoScreen™ instruments. When HemoScreen™ were used by primary care staff the Deming correlations were WBCHemoScreen™ = 0.970* WBCSysmex - 0.087; r = 0.983, RBCHemoScreen™ = 0.955* RBCSysmex + 0.112; r = 0.97, PLTHemoScreen™ = 1.025* PLTSysmex + -4.860; r = 0.983, HemoglobinHemoScreen™ = 1.010* HemoglobinSysmex -3.246; r = 0.963, HematocritHemoScreen™ = 0.999* HematocritSysmex -0.0171; r = 0.950, MCHHemoScreen™ = 0.864* MCHSysmex + 4.241; r = 0.921, MCVHemoScreen™ = 0.890* MCVSysmex + 7.778; r = 0.927. The HemoScreen™ instrument provided rapid and accurate test results for CBC parameters in a primary care setting.
Key words
primary care, red blood cells, white blood cells, platelets, point of care testing
Introduction
Blood cell counts are among the most frequently requested laboratory tests both in primary care and for patients in the hospital [1,2]. In primary care blood cell counts are used for several different patient groups. The focus is mainly on red and white blood cells with less emphasis on platelets. White blood cell (WBC) counts are widely used to quantify the magnitude of inflammation or to differentiate between viral and bacterial infections [3]. Red blood cell counts (RBC) and red blood cell parameters are primarily used for patients with suspected anemia [4,5]. In the primary care centers it is not possible to perform microscopic counting of blood cells blood in a counting chamber. Manual microscopy requires highly trained staff and is time consuming and thus is not available at the primary care centers. Today, blood cell counts are mainly analyzed using automated blood cell counters. Blood cell counters are relatively expensive and requires careful maintenance to work properly. This makes the technology less suited for small primary care centers. This means that blood cell counts usually must be sent to the central laboratory for analysis and the test results are not available until several hours after blood sampling. Infectious diseases are acute conditions and if the test results are not available during the initial consultation the decision on antibiotics treatment or not will be based on the clinical evaluation. Considering the rapid increase in antibiotics resistance it is important to only treat the patients that benefit from the treatment with antibiotics [6,7].
During the past decade, a few point-of-care (POC) tests have been introduced to provide on-site white blood cell counts to contribute to the diagnostic work-up of patients in e.g. primary care [8]. It is an advantage if the POC instrument can provide both red and white blood cell counts.
In the Region of Uppsala, we have from primary care facilities 160 complete blood cell counts and 220 hemoglobin requests per 1,000 inhabitants per year.8 Presently, the primary care centers in our county perform patient-near testing for hemoglobin but only the larger primary care centers have the capability to analyze red and white blood cell counts.
HemoScreen™ is a new generation of POC hematology analyzer introduced by PixCell Medical. The instrument combines viscoelastic focusing and digital imaging in a single instrument [9,10]. The HemoScreen™ utilizes single use cartridges and is suitable for POC settings. After the cartridge has been inserted into the instrument, the preparation of the sample and the measurements are performed automatically. The sample volume is only 40 μL and the results are displayed within 6 min. The HemoScreen™ uses a disposable cartridge, which contains all required reagents. The blood is introduced into the cartridge, which then is inserted into the instrument and. The instrument has two modes for operation, with and without the full differential count. If only CBC and not the full differential count is requested the assay time is less than 3 min and only requires 20 microliter blood.
Materials and Methods
Study subjects
The study was approved by the local ethical committee (01-367). The ethical approval permits the use of surplus samples without patient identity for method evaluations.
The samples used were routine CBC requests from primary care physicians at the primary care center in Gimo, county of Uppsala, Sweden. The samples were first tested with the HemoScreen™ instrument (PixCell Medical, Yokneam Ilit, Israel). The instrument was operated by assistant nurses working at the primary care center. The samples were then sent to Akademiska Laboratoriet, Uppsala University Hospital, Uppsala for retesting using a Sysmex XN™ instrument (Sysmex, Kobe, Japan). The samples were collected in K2-EDTA vacutainer tubes (354664, Becton Dickinson, Franklin Lakes, NJ, USA. This study was approved by the ethics committee of Uppsala University (01-367).
Laboratory methods
The Sysmex XN™ used in this study is a cell counter. The instrument analyzes total fluorescent/scattered light emitted by the cells.
The HemoScreen™ utilizes viscoelastic focusing which is a novel technology that aligns the cells in a single plane. The instrument optics acquires many microscopic images of the focused cells. The images are then computer analyzed to identify the individual cells. The subcellular data is used to increase the specificity of the measurements.
Test turnaround time for the centralized testing
The test turnaround time for the Sysmex XN™ was calculated as the time difference in minutes between the sampling time and the time the test results were sent from the Sysmex XN instrument to the laboratory information system and the patient files.
Statistical analysis
Deming regression analysis was performed using Method Validator (Metz, France). Data are also presented as Bland-Altman plots [12].
Results
Correlation between the two analyzers
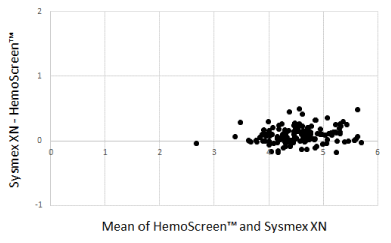
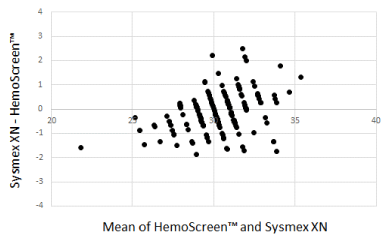
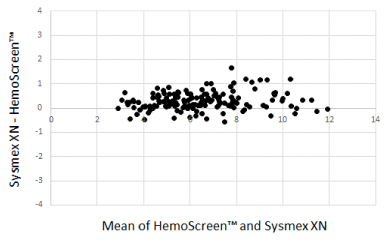
The Bland-Altman plots comparing WBC, RBC, and MCH analyzed by the two instruments are presented in Figure 1-3.

Figure 2. Bland-Altman plot for red blood cell counts (1012/L) with the mean of the two methods are plotted against the differences between the two methods. Mean bias between the methods was 0.04 x 10¹²/L

Figure 3. Bland-Altman plot for MCH (pg) with the mean of the two methods are plotted against the differences between the two methods. Mean bias between the methods was 0.12 pg
The Deming correlation equation for WBC (109/L) was WBCHemoScreen™ = 0.970* WBCSysmex - 0.087; r = 0.983. The 0.95 confidence interval (CI) for the slope was 0.938 – 1.001 and for the intercept -0.282 – 0.108. The bias was -0.286 x 10⁹/L (95% confidence interval -0.342 – -0.230).
The Deming correlation equation for RBC (1012/L) was RBCHemoScreen™ = 0.955* RBCSysmex + 0.112; r = 0.97. The 0.95 CI for the slope was 0.915 – 0.996 and for the intercept -0.074 – 0.297. The bias was -0.094 x 10¹²/L (95% confidence interval -0.114 – -0.074).
The Deming correlation equation for Platelets (109/L) was PLTHemoScreen™ = 1.025* PLTSysmex + -4.860; r = 0.983. The 0.95 CI for the slope was 0.988 – 1.062 and for the intercept -13.247 – 3.527. The bias was 1.38 x 10⁹/L (95% confidence interval -0.706 – 3.47).
The Deming correlation equation for Hemoglobin (g/L) was HemoglobinHemoScreen™ = 1.010* HemoglobinSysmex -3.246; r = 0.963. The 0.95 CI for the slope was 0.966 – 1.054 and for the intercept -9.309 – 2.818. The bias was -1.84 g/L (95% confidence interval -2.51 – -1.17).
The Deming correlation equation for Hematocrit (fraction) was HematocritHemoScreen™ = 0.999* HematocritSysmex -0.0171; r = 0.950. The 0.95 CI for the slope was 0.943 – 1.055 and for the intercept -0.04026 – 0.00590. The bias was -0.0176 (95% confidence interval -0.0197 – -0.0155).
The Deming correlation equation for MCH (pg) was MCHHemoScreen™ = 0.864* MCHSysmex + 4.241; r = 0.921. The 0.95 CI for the slope was 0.809 – 0.919 and for the intercept 2.606 – 5.875. The bias was 0.13 pg (95% confidence interval 0.0008 – 0.259).
The Deming correlation equation for MCV (fL) was MCVHemoScreen™ = 0.890* MCVSysmex + 7.778; r = 0.927. The 0.95 CI for the slope was 0.828 – 0.951 and for the intercept 2.288 – 13.268. The bias was -2.18 fL (95% confidence interval -2.48 – -1.87).
Test turnaround time for the centralized testing
The mean time from blood sampling to the test result report using standard measurement logistics with was 259 min (interquartile range 244-281 min, total range 106-352 min).
Discussion
In the present study we compared blood cell counts analyzed on the central hospital laboratory on a Sysmex NX cell counter with POC testing with the HemoScreen instrument.
These are two completely different techniques for analyzing blood samples [9,11]. Despite this we found a good agreement between the two instruments. We found good correlations between WBC, RBC, hemoglobin, MCV, MCH and platelet results obtained with the two instrument types. MCV showed a good correlation but a larger intercept than for WBC, RBC, hemoglobin and MCH. The bias may be due to differences in calibrations between the two instruments. In the studied range the slope and intercept has opposing effect reducing the absolute differences between the instruments. However, it would be desirable that the instrument bias for MCV was reduced. We did not encounter any technical problems with the instrument during the study and the instrument was considered easy to handle.
The HemoScreen instrument uses disposable cartridges and have limited maintenance requirements which makes it easy to operate and well adapted to POC testing.
The same venous tube was used for both instruments. The tubes were first analyzed with the HemoScreen instrument and then sent to the central laboratory by bus and then analyzed on the Sysmex XN™. There are two bus transports per day from Gimo. We used the same routine in this study. The distance between Gimo and Akademiska Hospital is 51 km which is shorter than for several of the other primary care units in the county. The time until the test results were reported varied between 106 and 352 min. The patient cannot be expected to remain ant the primary care unit until the test result is available. The variation in delay makes it impossible for the GP to review the results directly when they are ready. It means that the GP will review the results at the end of the day or the next morning at best. During this time interval the GP has seen several additional patients and to minimize errors the GP need to review the patient file an additional time. This adds time and costs.
The HemoScreen assay tubes were first mixed on a Triomix mixer (Triolab, Mölndal, Sweden) and then 40 μL blood were collected with the HemoScreen capillary device. The device was introduced into the cartridge and the cartridge was inserted into the HemoScreen instrument which initiated the analysis. Venous samples were used to avoid the sample variation associated with fingertip sampling and to ensure that we got enough material for both measurements.
POC provides rapid test results [13,14]. POC provides instant access to test results, compared with a delay of several hours caused by the sample transport to the central laboratory. The patient cannot be expected to wait at the primary care center for the centralized test results. Centralized testing causes the health care providers to spend time following up results with patients over the phone or during a subsequent visit, delaying treatment decisions.
The advantage of disposable sample-cartridges is that sample clots do not affect the instrument but only the cartridge. This technology requires less maintenance and allows analysis of blood cell parameters also at small primary care units [9].
In conclusion, the study indicates that the HemoScreen™ instrument permits rapid and accurate analysis of blood cell parameters which can improve the workup of patients with suspected bacterial infections or anemia in a primary care setting.
Funding
The Uppsala University Hospital Research Fund, Sweden supported this study.
Brief title
POC testing of blood cell counts.
Competing interests
The authors declared no conflicts of interest with respect to this article.
Acknowledgements
The reagent for the HemoScreen™ analyzer was generously provided by PixCell Medical (Yokneam Ilit, Israel). Thanks are due to Ulla Pettersson and the staff at Gimo primary care center, for their work to collect the blood samples and practical handling of the HemoScreen™ instrument.
References
- Buttarello M, Plebani M (2008) Automated blood cell counts: state of the art. Am J Clin Pathol 130: 104-116. [Crossref]
- Mindemark M, Wernroth L, Larsson A (2010) Costly regional variations in primary health care test utilization in Sweden. Scandinavian Journal of Clinical Laboratory Investigatons 70: 164-170.
- Kapasi AJ, Dittrich S, González IJ, Rodwell TC (2016) Host biomarkers for distinguishing bacterial from non-bacterial causes of acute febrile illness: A comprehensive review. PLoS One 11: e0160278. [Crossref]
- Eisenstaedt RS (2004) The prevalence of anemia in primary care. Postgrad Med 116: 7-11. [Crossref]
- Dubois RW, Goodnough LT, Ershler WB, Winkle LV, Nissenson AR, et al. (2006) Identification, diagnosis, and management of anemia in adult ambulatory patients treated by primary care physicians: evidence-based and consensus recommendations. Curr Med Res Opin 22: 385-395. [Crossref]
- Jee Y, Carlson J, Rafai E, Musonda K, Huong TTG, et al. (2018) Antimicrobial resistance: a threat to global health. Lancet Infect Dis 18: 939-940. [Crossref]
- Holmes AH, Moore LS, Sundsfjord A, Steinbakk M, Regmi S, et al. (2016) Understanding the mechanisms and drivers of antimicrobial resistance. Lancet 387: 176-187. [Crossref]
- Larsson A, Greig-Pylypczuk R, Huisman A (2015) The state of point-of-care testing: a European perspective.Ups J Med Sci 120: 1-10. [Crossref]
- Ben-Yosef Y, Marom B, Hirshberg G, D'Souza C, Larsson A, et al. (2016) The HemoScreen, a novel haematology analyser for the point of care. J Clin Pathol 69: 720-725. [Crossref]
- Larsson A, Smekal D, Lipcsey M (2018) Rapid testing of red blood cells, white blood cells and platelets in intensive care patients using the HemoScreen™ point-of-care analyzer. Platelets 30: 1013-1016. [Crossref]
- Seo J, Lee ST, Kim SH (2015) Performance evaluation of the new hematology analyzer Sysmex XN‐series. Int J Lab Hematol 37: 155‐164. [Crossref]
- Bland JM, Altman DG (1995) Comparing methods of measurement: why plotting difference against standard method is misleading. Lancet 346: 1085-1087. [Crossref]
- Basile K, Kok J, Dwyer DE (2018) Point-of-care diagnostics for respiratory viral infections. Expert Rev Mol Diagn 18: 75-83. [Crossref]
- Urusov AE, Zherdev AV, Dzantiev BB (2019) Towards lateral flow quantitative assays: detection approaches. Biosensors 9: E89. [Crossref]


