Background and aim: Recent research has shown that non high-density lipoprotein cholesterol (non-HDL-C), a lipid measure that includes cholesterol of all potentially atherogenic lipoproteins, is a useful marker of the risk of cardiovascular disease. On the other hand, associations of non-HDL-C with dyslipidemia and metabolic syndrome (MetS) in healthy general population appear to be of importance in primary prevention and management of diseases. We here aim to analyze the correlation of non-HDL-C and Friedewald-estimated low density lipoprotein-cholesterol (LDL-C) with several routine metrics including body mass index (BMI), systolic blood pressure (SBP), diastolic blood pressure (DBP), fasting plasma glucose, hemoglobin A1c (HbA1c), triglyceride, and uric acid for a healthy adult population in Japan.
Methods: Pearson correlation analysis was conducted using a dataset of 34,303 persons (17,103 men and 17,200 women) without known cardiovascular diseases who underwent health checkups under fasting state from 1998 to 2006. LDL-C was estimated using Friedewald formula, and non-HDL-C was calculated as total cholesterol minus HDL-C value.
Results: The correlations of non-HDL-C with cardiometabolic markers (BMI, SBP, DBP, fasting plasma glucose, HbA1c, triglyceride, and uric acid) were stronger than Friedewald-estimated LDL-C for subjects with a wide range of triglycerides values. Women generally showed stronger correlations than men. In receiver operating characteristic analysis, non-HDL-C showed greater areas under the curve than Friedwald-estimated LDL-C (0.689 vs. 0.556, P < 0.0001 in men, 0.710 vs. 0.641, P < 0.0001 in women) with a group of subjects who met our metabolic criteria comprised of SBP ≥ 130 mmHg, DBP ≥ 90 mmHg, triglyceride ≥ 150mg/dL and BMI ≥ 25 compared to Friedewald-estimated LDL-C for both men and women. 6.9 % of men and 3.6 % of women showed above-median non-HDL-C and below-median Friedewald-estimated LDL-C, and similar numbers of subjects had the opposite type of discordance between the two measures. For both genders, the group with the high non-HDL-C-type discordance had higher levels of the mean of the cardiometabolic markers than the low non-HDL-C-type discordance group.
Conclusions: Regardless of triglyceride levels of subjects, non-HDL-C showed stronger correlations with routine markers like triglycerides, blood pressures, fasting plasma glucose and uric acid compared to Friedewald-estimated LDL-C for healthy adults in Japan. For health checkup routines, especially for those intended for prevention of MetS and pre-MetS states, non-HDL-C may be a better metric than Friedewald-estimated LDL-C.
non-HDL-C, LDL-C, MetS, Health checkup routine markers
Cardiovascular disease (CVD) is the major health burden and the leading cause of death globally, with the World Health Organization (WHO) estimating that 17 million people die from the disease each year. A myriad of efforts toward early detection and intervention to prevent onset have established that increased concentrations of low density lipoprotein-cholesterol (LDL-C) are associated with the development of CVDs. Measuring LDL-C has thus been the cornerstone of CVD risk assessment and prevention for the past decade. More recently, however, increasing number of studies have shown evidence that cardiovascular risk in healthy subjects may be more closely related to non-HDL-cholesterol, apoB or LDL-particle compared with LDL-C [1,2]. For instance, several studies have implicated the trapping of certain types of apolipoprotein B (apoB)-containing lipoprotein particles within the arterial wall as a causative factor for atherosclerosis. Lowering the number of such lipoprotein particles in plasma has been proposed to reduce the risk of cardiovascular events [3-5].
Non-HDL-C, which is easily calculated as total cholesterol minus HDL-cholesterol (HDL-C), corresponds to the cholesterol content of a broader range of atherogenic apoB-containing lipoproteins including LDL, very low-density lipoprotein (VLDL), intermediate-density lipoprotein (IDL), and lipoprotein(a) (Lp(a)) as well as chylomicron remnants and VLDL remnants. This feature of non-HDL-C presents a contrast with LDL-C, which has been intended for description of cholesterol of LDL, only one of the several apoB-containing lipoproteins [6]. Several studies have shown importance and/or superiority of non-HDL-C concentration as a predictor of CVD development and as a target for statin-based therapy over LDL-C [3,7-10]. Although there remains some controversy as the non-HDL-C superiority was not clear in some studies [2,11], Atherosclerosis Society Expert Dyslipidemia Panel [12] and the National Lipid Association [13] have recommended non-HDL-C also as a primary target of therapy of coronary artery disease. Non-HDL-C has also been shown to correlate more strongly with atherogenic lipoprotein subtractions compared to LDL-C [14].
Several studies focused on the relationship of non-HDL-C and metabolic syndrome (MetS) in apparently healthy adolescents and adults [15-17]. A study on US adults by Kilgore et al, showed that subjects with high non-HDL-C and normal LDL-C were about 11 times more likely to have MetS than the subjects with normal levels for both metrics [18]. As occurrence of dyslipidemia is an important feature of MetS, the latter study was considered to highlight the importance of atherogenic dyslipidemia rather than high LDL-C levels [18], while both are features related to, or integrated in, non-HDL-C values. In regard of atherogenic dyslipidemia, small dense LDL-C has been shown to strongly associated with an increased risk of coronary heart disease [19]. Of note, non-HDL-C shows a better correlation with small dense LDL particles than do other lipid parameters including LDL-C [20].
In the present study, to better understand potential usefulness of plasma non-HDL-C relative to LDL-C as a marker especially for the population-based screening in health checkup, we compared non-HDL-C and Friedewald-estimated LDL-C in terms of the associations with other routine metrics using data from a health-screening program.
We used a dataset derived from the health screening program performed by the Yuport Medical Checkup Center in Tokyo, Japan, described in our previous studies [21]. Through the study period of 8 years from April 1998 to March 2006, 34,303 persons aged 15-93 years participated in this checkups. For repeat participants who attended the screening twice or more, data from first checkup was used. By the past and present medical history, the persons with CVD were excluded because of the possibility of being treated for the risk factors assessed in this study. In accordance with the Private Information Protection Law, information that might identify subjects was safeguarded by the center. Informed consent for anonymous participation in epidemiological research was obtained at every check-up.
Blood samples were obtained after overnight fasting and measured at the center’s laboratory. For measurements of triglyceride, total cholesterol, and HDL-C levels, a Toshiba TBA-40FR Autoanalyzer (Toshiba Medical Systems, Tokyo, Japan) was used. Triglyceride and total cholesterol levels were measured using enzymatic methods utilizing glycerol kinase and cholesterol oxidase, respectively (Daiichi Pure Chemicals Co., LTD, Tokyo, Japan). HDL-C was measured after selective solubilization of non-HDL lipoproteins (Daiichi Pure Chemicals Co., LTD, Tokyo, Japan). LDL-C levels was estimated by Friedewald formula (LDL-C = total cholesterol - HDL-C - (1/5) triglyceride). HbA1c levels were measured using the latex immuno-agglutinin method (Determiner hemoglobin A1c; Kyowa Medex, Tokyo, Japan) assigned by the Japan Diabetes Society (JDS). Comparison of the JDS primary standard material with the assay of the anchor laboratory of the National Glycohemoglobin Standardization Program (NGSP) in the USA revealed that the NGSP value (%) = JDS value (%) - 0.4% [22]. Thus, the JDS values were converted into NGSP values by adding 0.4% and the NGSP values are reported in this study. The remaining parameters were measured with the methods recommended by manufacturers. Body mass index (BMI) was calculated as weight as kilograms divided by height as meters squared (kg/m2). The Japan Society for the Study of Obesity (JASSO) defined BMI = 22 as an optimum and ≥ 25 as obesity class 1 in Japan [23]. During the study period, all checkups were performed in the same manner.
All statistical analyses were performed using SPSS for windows 15.0 (SPSS Inc., Tokyo, Japan) and MEDCALC 10.0 for Windows (Medcalc Software, Mariakerke, Belgium).
Table 1 shows the basic characteristics of the men and women groups. The mean (± SD) of age of this study subjects was 51.2 (± 13.2) in 17,103 men and 52.4 (± 13.0) years old in 17,200 women subjects. There were significant differences between men and women in all parameters (p < 0.001). As expected for the Japanese population of this range of age, BMI, SBP, DBP, fasting plasma glucose, HbA1c, triglyceride, and non-HDL-C values were significantly higher in men than in women. Conversely, total cholesterol, HDL-C, and Friedewald-estimated LDL-C values were significantly higher in women than in men.
Table 1. Basic characteristics of the 34,303 study subjects
|
Men n=17103 |
Women n=17200 |
Age (year) |
51.2 ± 13.2 |
52.4 ± 13.0 |
Body mass index (kg/m2) |
23.6 ± 3.0 |
22.1 ± 3.1 |
Systolic blood pressure (mmHg) |
126.7 ± 17.5 |
120.7 ± 18.5 |
Diastolic blood pressure (mmHg) |
77.4 ± 11.0 |
72.6 ± 11.0 |
Fasting plasma glucose (mg/dL) |
102.2 ± 21.4 |
94.4 ± 15.9 |
Hemoglobin A1c (%) |
5.1 ± 0.8 |
5.0 ± 0.7 |
Triglycerides (mg/dL) |
110 (77-160) |
78.0 (57-109) |
Total cholesterol (mg/dL) |
198.0 ± 34.0 |
206.6 ± 36.4 |
HDL cholesterol (mg/dL) |
52.3 ± 13.3 |
62.6 ± 14.2 |
non HDL cholesterol (mg/dL) |
145.7 ± 35.1 |
143.9 ± 36.8 |
LDL cholesterolFr (mg/dL) |
120.0 ± 30.7 |
125.9 ± 32.9 |
Aspartate aminotransferase (U/L) |
22 (18-27) |
19 (17-20) |
Alanine aminotransferase (U/L) |
22 (16-32) |
15 (12-20) |
γ-Glutamyl transpeptidase (U/L) |
28 (17-49) |
14 (10-22) |
Uric acid (mg/dL) |
6.1 ± 1.3 |
4.5 ± 1.0 |
Data are expressed as mean ± SD or median (25-75% range). Significant between-gender differences were seen in all variables (p<0.001).
Next, we performed a Pearson correlation analysis between non-HDL-C and Friedewald-estimated LDL-C with several routine parameters: BMI, SBP, DBP, fasting plasma glucose, HbA1c, triglyceride, and uric acid. For both men and women, non-HDL-C showed stronger correlations for all these parameters compared to LDL-C (Table 2). Intriguingly, the correlations between the cholesterol metrics with the routine parameters were stronger in women than in men.
The above results support the advantage of non-HDL-C over Friedewald-estimated LDL-C in terms of evaluation of metabolic state when all subjects were covered as a whole. Thus, it is not clear whether the advantage of non-HDL-C can be seen for diverse subjects with a wide range of triglyceride levels. Further, given the significant correlation of non-HDL-C with triglyceride (Table 2), the fact that Friedewald formula simply uses a fixed ratio to estimate non-LDL cholesterol from triglyceride seemed to make interpretation of the results somewhat difficult due to confounding effects by triglycerides. Hence, we stratified the subjects according to the triglyceride levels and performed a similar Pearson correlation analysis. Table 3 shows the correlation coefficients of non-HDL-C and Friedewald-estimated LDL-C with the routine parameters (BMI, SBP, DBP, fasting plasma glucose, HbA1c, triglyceride, and uric acid) in five groups divided according to triglyceride levels. Non-HDL-C and Friedewald-estimated LDL-C were significantly correlated with the parameters in both men and women groups with low triglyceride values (< 300 mg/dL). However, neither of non-HDL-C and LDL-C had significant relationship with SBP, DBP in men with high triglyceride levels and with uric acid in men and women with high triglyceride. In both men and women, non-HDL-C showed a slightly higher or similar correlation with all the parameters compared to LDL-C. Although the small sample numbers prevent us from conclusive discussion, for men with very high triglyceride values (>400 m/dL), LDL-C showed negative correlations with blood pressures and HbA1c.
Table 2. Correlation coefficients
|
non HDL-C |
LDL-CFr |
TG |
BMI |
SBP |
DBP |
FPG |
HbA1c |
UA |
Men N=17103 |
non-HDL-C LDL-CFr |
1.000 0.864** |
0.864** 1.000 |
0.510** 0.107** |
0.314** 0.180** |
0.157** 0.087** |
0.175** 0.103** |
0.177** 0.107** |
0.203** 0.156** |
0.158** 0.044** |
Women N=17200 |
non-HDL-C LDL-CFr |
1.000 0.959** |
0.959** 1.000 |
0.552** 0.348** |
0.339** 0.271** |
0.320** 0.268** |
0.302** 0.255** |
0.271** 0.227** |
0.373** 0.327** |
0.247** 0.191** |
non-HDL-C: Non-High-Density Lipoproteins Cholesterol (mg/dL); LDL-CFr: Low-Density Lipoprotein Cholesterol estimated by Friedewald formula (mg/dL); TG: Triglycerides (mg/dL); BMI: Body Mass Index (kg/m2); SBP: Systolic Blood Pressure (mmHg); DBP: Diastolic Blood Pressure (mmHg); FPG: Fasting Plasma Glucose (mg/dL); HbA1c: Hemoglobin A1c (%); UA: uric acid(mg/dL); **p < 0.001
Table 3. Correlation coefficients for stratified subjects according to triglyceride (TG)
|
TG level (mg/dL) |
|
BMI |
SBP |
DBP |
HbA1c |
FPG |
UA |
Men |
TG < 100 n=7428 |
non-HDL-C LDL-CFr |
0.219** 0.196** |
0.124** 0.113** |
0.147** 0.137** |
0.105** 0.097** |
0.089** 0.080** |
0.060** 0.049** |
100 ≤ TG < 200 n=7105 |
non-HDL-C LDL-CFr |
0.166** 0.146** |
0.078** 0.065** |
0.092** 0.081** |
0.082** 0.074** |
0.047** 0.036** |
0.054** 0.038** |
200 ≤ TG < 300 n=1731 |
non-HDL-C LDL-CFr |
0.149** 0.145** |
0.041 0.033 |
0.044 0.037 |
0.192** 0.181** |
0.141** 0.134** |
0.024 0.015 |
300 ≤ TG < 400 n=499 |
non-HDL-C LDL-CFr |
0.223** 0.223** |
0.078 0.069 |
0.067 0.056 |
0.131** 0.128** |
0.070 0.069 |
0.090* 0.090* |
TG ≥ 400 n=337 |
non-HDL-C LDL-CFr 1) |
0.122* 0.184** |
0.033 -0.045 |
0.072 -0.029 |
0.153** 0.062 |
0.117* 0.008 |
0.003 0.009 |
Women |
TG < 100 n=11959 |
non-HDL-C LDL-CFr |
0.250** 0.229** |
0.257** 0.241** |
0.247** 0.233** |
0.249** 0.236** |
0.152** 0.142** |
0.163** 0.151** |
100 ≤ TG < 200 n=4596 |
non-HDL-C LDL-CFr |
0.132** 0.111** |
0.158** 0.143** |
0.143** 0.130** |
0.182** 0.168** |
0.143** 0.129** |
0.112** 0.093** |
200 ≤ TG < 300 n=521 |
non-HDL-C LDL-CFr |
0.100* 0.107* |
0.123* 0.115* |
0.093* 0.085 |
0.210** 0.211** |
0.187** 0.187** |
0.077 0.064 |
300 ≤ TG < 400 n=83 |
non-HDL-C LDL-CFr |
0.331** 0.341** |
0.248* 0.250* |
0.289* 0.278* |
0.101 0.117 |
0.054 0.074 |
0.097 0.082 |
TG ≥ 400 n=38 |
non-HDL-C LDL-CFr 1) |
0.186 0.345* |
0.267 0.202 |
0.039 -0.015 |
0.251 0.120 |
0.308 0.083 |
0.140 0.252 |
non-HDL-C: Non-High-Density Lipoproteins Cholesterol (mg/dL); LDL-CFr: Low-Density Lipoprotein Cholesterol estimated by Friedewald formula (mg/dL); BMI: Body Mass Index (kg/m2); SBP: Systolic Blood Pressure (mmHg); DBP: Diastolic Blood Pressure (mmHg); FPG: Fasting Plasma Glucose (mg/dL); HbA1c: Hemoglobin A1c (%); UA: Uric Acid(mg/dL); 1)Use of Friedewald formula for subjects with triglyceride > 400 mg/dL has not been recommended; we used the formula here only for reference purpose.*p<0.05, **p <0.01,*** p<0.001
Next, to examine the predictive ability of non-HDL-C and Friedewald-estimated LDL-C for the metabolic disorder or pre-MetS state, we carried out a receiver operating characteristic (ROC) analysis on the sensitivity and specificity of the cholesterol metrics in predicting the subjects who met the following criteria: SBP ≥ 130 mmHg, DBP ≥ 90 mmHg, triglyceride ≥ 150mg/dL and BMI ≥ 25. These cutoffs for blood pressures were based on international diagnostic criteria for hypertension based on the Japanese Society of Hypertension Guidelines for the Management of Hypertension 2014 [24,25] and that of triglyceride was on the Japan Atherosclerosis Society Guideline [26], and BMI was on Japan Society for the Study of Obesity (JASSO) Guideline for obesity diagnosis 2011. West circumferences data were unavailable. The ROC analysis showed that the area under the curve (AUC) of non-HDL-C was 0.689 (95% CI = 0.682-0.696) in men and was 0.710 (95% CI = 0.703-0.717) in women, which were significantly higher than those of Friedewald-estimated LDL-C (0.556, 95% CI = 0.548-0.563 in men and 0.641, 95% CI = 0.634-0.649 in women) (Figure 1). The frequencies of subjects whose routine markers fell within the abnormal ranges increased as the non-HDL-C level increased (Figure 2).
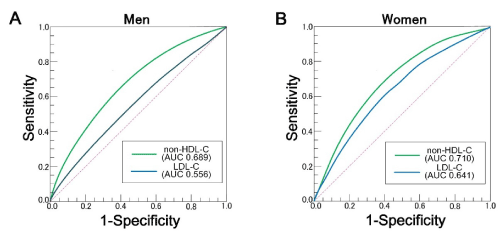
Figure 1. The ROC curve of non-HDL-C and Freidewald-estimated LDL-C for prediction of the risk groups defined based on the criteria of SBP ≥ 130 mmHg, DBP ≥ 90 mmHg, triglyceride ≥ 150mg/dL and BMI ≥ 25. (A) Results for men. (B) Result for women.
Figure 2. The proportion (in %) of the subjects with the indicated (poorer) profiles for the quartiles according to non-HDL-C (from blue to purple). The same abbreviations and units as in Table 2 are used.
For a more intuitive understanding of potential usefulness of non HDL-C as a predictor for cardiometabolic disorders in standard health checkups, we performed a discordance/concordance analysis, in which the levels of the routine parameters were compared among the four subgroups obtained by categorization based on being greater or less than the median of non-HDL-C and that of Friedewald-estimated LDL-C (Table 4). Most subjects showed concordance between non-HDL-C and Friedewald-estimated LDL-C (85.9% in men, 92.2% in women). The prevalence of subjects with either type of discordance was 14.2% in men and 7.7% in women. The discordant subgroup with high non-HDL-C and low Friedewald-estimated LDL-C had higher values of cardiometabolic markers than the other discordant subgroup with low non HDL-C. Intriguingly, the discordant subgroup with high non-HDL-C and low Friedewald-estimated LDL-C showed even worse cardiometabolic marker values in comparison with the concordant subgroup with both high, signifying the practical merits of prioritizing non-HDL-C over Friedewald-estimated LDL-C in routine health checkups.
Table 4. The mean of the routine parameters for each of the four subgroups categorized using the median of non HDL-C and that of Friedewald-estimated LDL-C as the cutoff values.
|
Concordant |
Discordant |
|
Below- median non-HDL-C Below- median LDL-CFr |
Above- median non-HDL-C Above- median LDL-CFr |
Above- median non-HDL-C Below- median LDL-CFr |
Below- median non-HDL-C Above- median LDL-CFr |
Men total = 17102 |
n ( % ) |
7400(43.3) |
7278(42.6) |
1179(6.9) |
1245(7.3) |
non-HDL-C |
114.89 |
175.48 |
163.10 |
138.06 |
LDL-CFr |
93.51 |
147.11 |
97.16 |
122.97 |
TG |
106.90 |
141.82 |
329.73 |
75.45 |
BMI |
22.8 |
24.2 |
25.0 |
22.9 |
SBP |
124.42 |
128.42 |
131.02 |
125.00 |
DBP |
75.82 |
78.71 |
80.41 |
76.44 |
FPG |
100.07 |
104.13 |
106.19 |
99.31 |
HbA1c |
5.0 |
5.2 |
5.2 |
5.0 |
UA |
5.95 |
6.22 |
6.73 |
5.84 |
Women total = 17198 |
n (%) |
7998(46.5) |
7864(45.7) |
626(3.6) |
708(4.1) |
non-HDL-C |
112.84 |
175.30 |
153.54 |
138.70 |
LDL-CFr |
98.57 |
154.30 |
113.98 |
127.75 |
TG |
71.33 |
105.02 |
199.29 |
54.71 |
BMI |
21.3 |
22.9 |
23.8 |
21.4 |
SBP |
115.69 |
125.43 |
127.30 |
117.61 |
DBP |
69.84 |
75.31 |
76.23 |
71.25 |
FPG |
91.56 |
97.11 |
99.48 |
91.53 |
HbA1c |
4.8 |
5.2 |
5.3 |
4.9 |
UA |
4.3 |
4.7 |
5.0 |
4.3 |
*Parameter names were abbreviated based on the scheme used in Table 3
In the present study based on healthy population, we analyzed associations of non-HDL-C with several routine metrics with implications for cardiometabolic risks. When compared to Friedewald-estimated LDL-C, non-HDL-C showed stronger correlations with triglycerides, fasting plasma glucose, HbA1c, and uric acid. For both non-HDL-C and Friedewald-estimated LDL-C, these correlations were relatively clearer for women than men. Using our criteria representing a MetS-like status, we showed that the use of non-HDL-C as a primary screening for metabolic disorder is a useful approach than Friedewald-estimated LDL-C.
As a limitation, we did not perform direct measurement of LDL-C. However, unlike Friedewald-estimated LDL-C that uses inputs from the standardized measures and is considered to have small between-facility errors, direct homogenous LDL-C methods using detergents may suffer from large errors at least at present [27]. Further, direct homogeneous methods have been shown to yield inconsistent data when IDL is elevated [28]. On the other hand, Friedewald-estimated LDL-C has problems especially for subjects with high triglyceride values (>400 mg/dL). In Japan, the 2012 guidelines JAS has recommended the use of Friedewald-estimated LDL-C for < 400 mg/dL, while promoting the non-HDL-C for subjects with triglyceride levels > 400 mg/dL [24]. Of note, the 2014 position paper from International Atherosclerosis Society has stated that "It is expected that in future guidelines non-HDL-C will replace LDL-C as the better target for treatment" of CVD [29]. It is quite possible that use of non-HDL-C may be recommended in Japan not only for high triglyceride subjects, but also for subjects with low triglyceride group for health screening purpose.
In regard of the difference of the estimated and direct LDL-C values, it is noteworthy that Mora et al used both methods in one study [8]. In their analysis on discordance between LDL-C and non-HDL-C, the use of Friedewald-estimated LDL-C led to attenuation of statistical significance in hazard ratio despite the significant hazard ratio obtained with the direct homogenous LDL-C method. Thus, at least in Mora et al, use of Friedewald-estimated LDL-C attenuated the impact of discordance seen when the directly measured LDL-C was used. Nonetheless, our discordant analysis (Table 4) suggested limited usefulness of Friedewald-estimated LDL-C as predictor of cardiometabolic disorders for subjects with discordant. From these findings, we surmise that it is possible that the use of direct homogenous method in our analysis could have widen the difference, leading to an apparently even higher correlations of non-HDL-C relative to LDL-C with other routine metrics and to even greater discrepancies in the discordance analysis. Yet, the aforementioned usefulness of non-HDL-C as well as its cost benefit may limit the relative utility of direct LDL-C methods in routine health checkup.
In general, non-HDL-C may be associated with cardiovascular risk mainly through similarity to LDL-C that is atherogenic processes, whereas triglycerides can be considered to be associated with the risk mainly through MetS, insulin resistance and a prothrombin state [16]. Thus, compared to the LDL-C-mediated process, the processes through MetS have profound implications for dyslipidemia and atherogenic complex. Dyslipidemia in MetS is characterized by high triglyceride concentrations, decreased levels of HDL-C and increased number of small dense LDL particles [30]. In a study on hospital patients, Huang et al observed that non-HDL-C levels were elevated in individuals with MetS, whereas LDL-C did not show significant elevation [15]. This led to the view that some increase of risk for cardiovascular diseases is likely accounted for by the lipoprotein fractions other than LDL in persons with MetS [16]. Thus, our observation of relatively strong correlation of non-HDL-C with triglyceride is likely to reflect non only the unsurprising correlation between VLDL-triglycerides and VLDL-cholesterol, but also some presence of triglyceride-rich lipoproteins, remnant, and abnormal small particles and low HDL-C concentration, which have been proposed as atherogenic lipoprotein phenotype [31,32]. Of note, the correlation coefficient of non-HDL-C with small dense LDL-C has been shown to be high (r = 0.76) compared to Friedewald-estimated LDL-C (r = 0.60) [19,20].
At least for metabolic disorders, even with future improvements of direct methods for LDL-C achieving adequate accuracy, our finding suggests limited predictive ability of LDL-C compared to non-HDL-C. It is plausible that it is the complementary effect of triglyceride that has brought about the today's routine use of LDL-C in the health checkup despite of its limited ability. As another disadvantages of Friedewald-estimated LDL-C, in addition to the well-known problem of taking negative values for high TG subjects, we observed that Friedewald-estimated LDL-C shows inconsistency in terms of the positive and negative correlations as we have seen for blood pressures in Table 3.
Although the stratification according to triglyceride value itself should affect the correlation coefficients and this is nothing more than a qualitative discussion, there was a trend that the association of non-HDL-C with triglyceride was more evident for low-triglyceride subjects (<100 mg/dL) than in the high-triglyceride subjects (>200 mg/dL) (data not shown). So, relatively strong associations between the cholesterol metrics and other routine measures (blood pressures, glucose and uric acid) observed for low-triglyceride subjects may have been caused by the indirect effects brought about strong association with triglyceride that may reflect unnoticed dyslipidemia. Another possibility is that, for the low-triglyceride group, understandably normal lipid metabolism may have increased the relative impact of cholesterol metrics, thereby causing clear correlation especially for blood pressures. For high-triglyceride subjects, relative usefulness of cholesterol metrics may decrease as lipid-related parameters other than cholesterol such as small dense LDL and remnants are likely to bring additional influences on blood pressures, glucose metabolism, uric acid levels and cholesterol values themselves. Further population-based analyses of non-HDL-C focusing on subjects with mild dyslipidemia and/or pre-diabetic state, in particular, may bring about further insights useful for primary prevention and management of CVDs.
The authors declare that they have no conflicts of interests.
- Ingelsson E, Schaefer EJ, Contois JH, McNamara JR, Sullivan L, et al. (2007) Clinical utility of different lipid measures for prediction of coronary heart disease in men and women. JAMA 298: 776-785. [Crossref]
2021 Copyright OAT. All rights reserv
- Emerging Risk Factors Collaboration, Di Angelantonio E, Gao P, Pennells L, Kaptoge S, et al. (2012) Lipid-related markers and cardiovascular disease prediction. JAMA 307: 2499-2506. [Crossref]
- Sniderman AD, Williams K, Contois JH, Monroe HM, McQueen MJ, et al. (2011) A meta-analysis of low-density lipoprotein cholesterol, non-high-density lipoprotein cholesterol, and apolipoprotein B as markers of cardiovascular risk. Circ Cardiovasc Qual Outcomes 4: 337-345. [Crossref]
- Rye KA, Bright R, Psaltis M, Barter PJ (2006) Regulation of reconstituted high density lipoprotein structure and remodeling by apolipoprotein E. J Lipid Res 47: 1025-1036. [Crossref]
- Cole TG, Contois JH, Csako G, McConnell JP, Remaley AT, et al. (2013) Association of apolipoprotein B and nuclear magnetic resonance spectroscopy-derived LDL particle number with outcomes in 25 clinical studies: assessment by the AACC Lipoprotein and Vascular Diseases Division Working Group on Best Practices. AACC Lipoproteins and Vascular Diseases Division Working Group on Best Practices. Clin Chem 59: 752-770.
- Ridker PM (2014) LDL cholesterol: controversies and future therapeutic directions. Lancet 384: 607-617. [Crossref]
- Boekholdt SM, Arsenault BJ, Mora S, Pedersen TR, LaRosa JC, et al. (2012) Association of LDL cholesterol, non-HDL cholesterol, and apolipoprotein B levels with risk of cardiovascular events among patients treated with statins: a meta-analysis. JAMA 307: 1302-1309. [Crossref]
- Mora S, Buring JE, Ridker PM (2014) Discordance of low-density lipoprotein (LDL) cholesterol with alternative LDL-related measures and future coronary events. Circulation 129: 553-561. [Crossref]
- Ito T, Arima H, Fujiyoshi A, Miura K, Takashima N, et al (2016) Relationship between non-high-density lipoprotein cholesterol and the long-term mortality of cardiovascular diseases: NIPPON DATA 90. Int J Cardiol 220: 262-267. [Crossref]
- Zhang Y, Wu NQ, Li S, Zhu CG, Guo YL, et al. (2016) Non-HDL-C is a Better Predictor for the Severity of Coronary Atherosclerosis Compared with LDL-C. Heart Lung Circ 25: 975-981. [Crossref]
- Frontini MG, Srinivasan SR, Xu JH, Tang R, Bond MG, et al. (2007) Utility of non-high-density lipoprotein cholesterol versus other lipoprotein measures in detecting subclinical atherosclerosis in young adults (The Bogalusa Heart Study). Am J Cardio 100: 64-68. [Crossref]
- Expert Dyslipidemia Panel of the International Atherosclerosis Society Panel members (2014) An International Atherosclerosis Society Position Paper: global recommendations for the management of dyslipidemia--full report. J Clin Lipidol 8: 29-60. [Crossref]
- Jacobson TA, Ito MK, Maki KC, Orringer CE, Bays HE, et al. (2015) National lipid association recommendations for patient-centered management of dyslipidemia: part 1--full report. J Clin Lipidol 9: 129-169. [Crossref]
- Zhu CG, Zhang Y, Xu RX, Li S, Wu NQ, et al. (2015) Circulating non-HDL-C levels were more relevant to atherogenic lipoprotein subfractions compared with LDL-C in patients with stable coronary artery disease. J Clin Lipidol 9: 794-800. [Crossref]
- Huang J, Parish R, Mansi I, Yu H, Kennen EM, et al. (2008) Non-high-density lipoprotein cholesterol in patients with metabolic syndrome. J Investig Med 56: 931-936. [Crossref]
- Li C, Ford ES, McBride PE, Kwiterovich PO, McCrindle BW, et al. (2011) Non-high-density lipoprotein cholesterol concentration is associated with the metabolic syndrome among US youth aged 12-19 years. J Pediatr 158: 201-207. [Crossref]
- Saito E, Okada T, Abe Y, Kazama M, Yonezawa R, et al. (2016) Non-high-density Lipoprotein Cholesterol Levels in Japanese Obese Boys with Metabolic Syndrome. J Atheroscler Thromb 23: 105-111. [Crossref]
- Kilgore M, Muntner P, Woolley JM, Sharma P, Bittner V, et al. (2014) Discordance between high non-HDL cholesterol and high LDL-cholesterol among US adults. J Clin Lipidol 8: 86-93. [Crossref]
- 19. Nishikura T, Koba S, Yokota Y, Hirano T, Tsunoda F, et al. (2014) Elevated small dense low-density lipoprotein cholesterol as a predictor for future cardiovascular events in patients with stable coronary artery disease. J Atheroscler Thromb 21: 755-767. [Crossref]
- Moriyama K, Takahashi E (2016) Non-HDL Cholesterol is a More Superior Predictor of Small-Dense LDL Cholesterol than LDL Cholesterol in Japanese Subjects with TG Levels<400 mg/dL. J Atheroscler Thromb 23: 1126-1137. [Crossref]
- Kashima S, Inoue K, Matsumoto M, Akimoto K (2015) Prevalence and characteristics of non-obese diabetes in Japanese men and women: the Yuport Medical Checkup Center Study. J Diabetes 7: 523-530. [Crossref]
- International Expert committee (2009) International Expert Committee report on the role of the A1C assay in the diagnosis of diabetes. Diabetes Care 32: 1327-1334. [Crossref]
- Kanazawa M, Yoshiike N, Osaka T, Numba Y, Zimmet P, et al. (2005) Criteria and classification of obesity in Japan and Asia-Oceania. World Rev Nutr Diet 94: 1-12. [Crossref]
- Teramoto T, Sasaki J, Ishibashi S, Birou S, Daida H, et al. (2012) Comprehensive Risk Management for the Prevention of cardiovascular Disease Executive Summary of the Japan Atherosclerosis Society(JAS)Guidelines for the Diagnosis and Prevention of Atherosclerotic Cardiovascular Diseases in Japan-2012 version. J Atheroscler Thromb 20: 603-615. [Crossref]
- Takashima N, Ohkubo T, Miura K, Okamura T, Murakami Y, et al (2012) NIPPON DATA80 Research Group. Long-term risk of BP values above normal for cardiovascular mortality: a 24-year observation of Japanese aged 30 to 92 years. J Hypertens 30: 2299-2306. [Crossref]
- Teramoto T, Sasaki J, Ishibashi S, Birou S, Daida H, et al (2013) Japan Atherosclerosis Society. Executive summary of the Japan Atherosclerosis Society (JAS) guidelines for the diagnosis and prevention of atherosclerotic cardiovascular diseases in Japan -2012 version. J Atheroscler Thromb 20: 517-523. [Crossref]
- Martin SS, Michos ED (2014) Are we moving towards concordance on the principle that lipid discordance matters? Circulation 129: 539-541. [Crossref]
- Miller WG, Myers GL, Sakurabayashi I, Bachmann LM, Caudill SP, et al. (2010) Seven direct methods for measuring HDL and LDL cholesterol compared with ultracentrifugation reference measurement procedures. Clin Chem 56: 977-986. [Crossref]
- Expert Dyslipidemia Panel of the International Atherosclerosis Society Panel members (2014) An International Atherosclerosis Society Position Paper: global recommendations for the management of dyslipidemia--full report. J Clin Lipidol 8: 29-60. [Crossref]
- Stone NJ (2008) Nonpharmacologic management of mixed dyslipidemia associated with diabetes mellitus and the metabolic syndrome: a review of the evidence. Am J Cardiol 102: 14L-18L. [Crossref]
- Grundy SM (1998) Hypertriglyceridemia, atherogenic dyslipidemia, and the metabolic syndrome. Am J Cardiol 81: 18B-25B. [Crossref]
- Varbo A, Benn M, Tybjærg-Hansen A, Jørgensen AB, Frikke-Schmidt R, et al. (2013) Remnant cholesterol as a causal risk factor for ischemic heart disease. J Am Coll Cardiol 61: 427-436. [Crossref]