Introduction: Inflammation plays an important role in the pathogenesis of Bell’s palsy. Neutrophil to lymphocyte ratio (NLR) and platelet to lymphocyte ratio (PLR) are indicators of inflammation.
Objectives: The aim of this study was to find the prevalence of Bell's palsy and the mean of neutrophil to lymphocyte ratio and platelet to lymphocyte ratio among them.
Methods: This descriptive cross-sectional study was conducted from 1st March 2018 to 1st March 2020 after receiving ethical approval from Institutional Review Committee (Ref. No: 2020-046). Convenience sampling method was used for case selection. Data entry and analysis were done in Statistical Package for the Social Sciences Version 20. Point estimate at 95% confidence interval was calculated along with frequency and proportion for binary data.
Result: Out of all patients who visited ENT outpatient department during the study period, the overall prevalence of Bell’s palsy was 0.6% (117) at a 95% confidence interval (0.5-0.72%). Among them, the mean neutrophil to lymphocyte ratio was 5.014 ± 1.63, and the mean platelet to lymphocyte ratio was 207.38 ± 54.59.
Conclusion: NLR and PLR can be used as auxiliary parameters in the management of Bell’s palsy.
Bell's palsy, neutrophil, platelet, lymphocyte
Bell’s palsy (BP) is the most common cause of lower motor neuron facial paralysis at a rate of 60-75% [1]. The exact etiopathogenesis of BP is unclear. Vascular causes, autoimmune diseases and inflammation of the nerve sheath are thought to be the etiological factors of the disease [2]. Both Neutrophil to Lymphocyte ratio (NLR) and Platelet to Lymphocyte Ratio (PLR) are regarded as markers of inflammation. NLR is used to assess the risk of cardiovascular disease and the prognosis of patients with cardiovascular disease and with several types of cancer [3-6]. PLR is found to be high in peripheral vascular diseases, coronary artery diseases and gynecological and hepatobiliary malignancies [7].
Bell’s palsy can lead to significant facial asymmetry. As this is an inflammatory condition, rapid response is seen with increase in the activity of leukocytes and plasma proteins. Therefore, NLR and PLR can be used as prognostic markers in Bell’s palsy [7].
The aim of this study is to find out the prevalence of Bell's palsy and the mean values of NLR and PLR among them.
This descriptive cross-sectional study was conducted in the Department of Otorhinolaryngology and Head and Neck Surgery (ENT HNS) in the College of Medical Sciences, Chitwan, Nepal from 1st March 2018 to 1st March 2020. Ethical approval was obtained from the Institutional Review Board (Ref. No: 2020-046). Patients visiting the ENT out-patient department (OPD) were included in the study.
All participants gave a written informed consent. Patients diagnosed as BP were divided into groups based on severity of their facial palsy as per the House-Brackmann (HB) grading system. The demographic features like age and sex of the patients were also recorded. Complete blood count (CBC) was determined and based on CBC values, leukocyte, neutrophil, lymphocyte, and platelets counts were used to determine PLR and NLR. Convenience sampling was done.
One hundred and seventeen patients diagnosed as Bell’s palsy (BP) were included in the study. In Bell’s palsy patients, NLR and PLR values were calculated. An observation between the NLR and PLR values of Bell’s palsy group and the group with intact facial nerve function was then made. The latter group had neither active ear disease nor facial nerve pathology and they came for preoperative tests in the ENT OPD for septoplasty or myringoplasty surgery. Other conditions of facial paralysis like trauma, Ramsey-Hunt syndrome and tumoral masses were excluded. Diseases conditions which could affect NLR and PLR, such as active ear disease, acute or chronic renal failure, chronic liver disease, heart disease, chronic obstructive pulmonary disease, neurological disorders, or neoplasm were also excluded. Patients diagnosed as BP were divided into groups based on severity of their facial palsy as per the House-Brackmann (HB) grading system. All BP patients were treated with steroids, antiviral medication, and physical therapy.
Data entry and analysis was done in the Statistical Package for the Social Sciences (SPSS) for Windows, version 20.0 (SPSS Inc., Chicago, IL, USA). Descriptive statistics were presented as mean ± standard deviation, and the categorical variables were presented as the number of the cases and percentage. Normality was assessed using the Shapiro-Wilk test. Categorical variables were compared using the chi-square test, and continuous variables were compared using Student t-test. The comparison of differences in complete blood count parameters between the patient and control groups was performed using a t-test. The relationship between the severity of Bell’s palsy and NLR and PLR values was assessed using Coefficient of Variation test. P < 0.05 value was considered significant.
Out of all patients who visited ENT outpatient department during the study period, the overall prevalence of Bell’s palsy was 0.6% (117 patients) at a 95% confidence interval (0.5-0.72%). The BP group contained 64 males (54.7%) and 53 (45.3%) females. The mean age in the BP group was 36.96 ± 10.33 years (Table 1).
Table 1. Patient demographic and complete blood count parameters
|
BP Group |
Control Group |
Age |
36.96 ± 10.33 |
38.78 ± 5.61 |
Gender-Male |
54.7% |
53% |
NLR |
5.014 ± 1.63 |
3.05 ± 0.92 |
PLR |
207.38 ± 54.59 |
155.62 ± 96.61 |
WBC |
9.11 ± 1.83 |
9.3 ± 6 |
Neutrophil |
7.22 ± 1.45 |
6.4 ± 0.8 |
Lymphocyte |
1.44 ± 0.37 |
2.1 ± 1.3 |
Platelet |
326.8 ± 13 |
298.63 ± 15 |
The mean NLR was 5.014 ± 1.63 in the BP group. In the control group, the mean NLR was 3.05 ± 0.92. The mean NLR was statistically significantly higher in the BP group (p < 0.001) (Figure 1).

Figure 1. Box and whisker plot showing NLR patients with Bell’s palsy and control population
The mean PLR was 207.38 ± 54.59 in the BP group. In the control group, the mean PLR was 155.62 ± 96.62. The mean PLR was statistically significantly higher in the BP group (p < 0.001) (Figure 2).
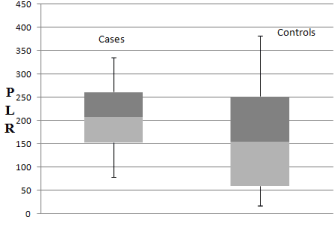
Figure 2. Box and whisker plot showing PLR patients with Bell’s palsy and Normal population
On comparing whether the severity of facial paralysis (as per House Brackmann grading) correlated with high NLR and PLR ratio, it was found that a very weak positive correlationship was seen between severity of facial palsy and NLR ratio, r(115)=0.03, p = 0.69. This result was not significant at p < 0.05. Similarly, a very weak positive correlationship was seen between severity of facial palsy and PLR ratio, r(115)=0.01, p=0.89. This result was not significant at p < 0.05. The scatter plot also showed increased NLR and PLR values did not necessarily increase the chance of severity of facial nerve palsy (Figures 3 and 4).
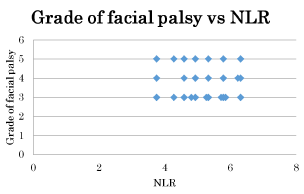
Figure 3. Scatter plot showing the grade of facial nerve palsy against the NLR
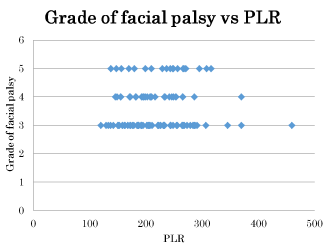
Figure 4. Scatter plot showing the grade of facial nerve palsy against the PLR
This study evaluated the prevalence of Bell’s palsy among patients who visited ENT OPD during the study period. The prevalence was found to be 117 (0.6%) at a 95% confidence interval (0.5-0.72%). 54.7% of the cases were male. The mean age in the BP group was 36.96 ± 10.33 years. The study done by Chang et al in South Korea found the prevalence to be 0.12% at 95% confidence interval (0.07% to 0.17%). The disease was seen more in females and the most common age group was 70-79 years [8].
This study evaluated whether blood parameters NLR and PLR could be used as prognostic marker of Bell’s palsy. Both NLR and PLR are markers of systemic inflammation [9,10]. As the pathogenesis of Bell’s palsy is related to inflammatory mechanism, both NLR and PLR are higher in patients with Bell’s palsy than in normal subjects [3]. Our study also showed similar findings.
Some studies show positive correlation between high NLR and poor prognosis in patients with Bell’s palsy whereas some show no significant relationship between the degree of facial paralysis and NLR and PLR [11,12]. This study showed increased NLR and PLR values didn’t necessarily increase the chance of severity of facial nerve palsy.
Viral infection, ischemic neuropathy, and autoimmune responses are held responsible for Bell’s palsy [13]. This can lead to inflammatory changes resulting in swelling of the facial nerve, compressing the nerve and ultimately facial nerve paralysis. Increased pressure on the nerve further prevents vein reflux, with congestion of the blood vessels leading to a vicious cycle of edema, compression, and ischemia of the facial nerve [11].
This study had several limitations. First, this was a cross-sectional study. A prospective study with regular monitoring of patient with NLR and PLR would have been better. Second, NLR and PLR before and after treatment of Bell’s palsy were not assessed. Third, we did not measure other inflammatory markers like erythrocyte sedimentation rate or C-reactive protein concentration in this study.
High NLR and PLR values in Bell’s palsy patients support the inflammatory feature of this disease. NLR and PLR are recommended as a supportive parameter in the management of Bell’s palsy.
- 1. Bleicher JN, Hamiel S, Gengler JS, Antimarino JA (1996) Survey of facial paralysis: etiology and incidence. Ear Nose Throat J 75: 355-338. [Crossref]
- 2. McCaul JA, Cascarini L, Godden D, Coombes D, Brennan PA, et al. (2014) Evidence based management of Bell’s palsy. Br J Oral Maxillofac Surg 52: 387-391. [Crossref]
- 3. Xu N, Tang XF, Yao Y, Zhao X, Chen J, Gao Z, et al. (2018) Predictive value of neutrophil to lymphocyte ratio in long-term outcomes of left main and/or three-vessel disease in patients with acute myocardial infarction. Catheter Cardiovasc Interv 91: 551-557. [Crossref]
- 4. Song JY, Chen MQ, Guo JH, Lian SF, Xu BH (2018) Combined pretreatment serum CA19-9 and neutrophil-to-lymphocyte ratio as a potential prognostic factor in metastatic pancreatic cancer patients. Medicine (Baltimore) 97: e9707. [Crossref]
- 5. Mascarella MA, Mannard E, Silva SD, Zeitouni A (2018) Neutrophil-to-lymphocyte ratio in head and neck cancer prognosis: A systematic review and meta-analysis. Head Neck 40: 1091-1100. [Crossref]
- 6. Huang QT, Zhou L, Zeng WJ, Ma QQ, Wang W, et al. (2017) Prognostic Significance of Neutrophil-to-Lymphocyte Ratio in Ovarian Cancer: A Systematic Review and Meta-Analysis of Observational Studies. Int J Exp Cell Physiol Biochem Pharmacol 41: 2411-2418. [Crossref]
- 7. Volk GF, Klingner C, Finkensieper M, Witte OW, Guntinas-Lichius O (2013) Prognostication of recovery time after acute peripheral facial palsy: a prospective cohort study. BMJ Open 3: e003007.
- 8. Chang YS, Choi JE, Kim SW, Baek SY, Cho YS (2016) Prevalence and associated factors of facial palsy and lifestyle characteristics: data from the Korean National Health and Nutrition Examination Survey 2010–2012. BMJ Open 6: e012628. [Crossref]
- 9. Toprak C, Tabakci MM, Simsek Z, Arslantas U, Durmus HI, et al. (2015) Platelet/lymphocyte ratio was associated with impaired myocardial perfusion and both in-hospital and long-term adverse outcome in patients with ST-segment elevation acute myocardial infarction undergoing primary coronary intervention. Adv Interv Cardiol 11: 288-297. [Crossref]
- 10. Sahin C, Varım C (2017) Neutrophil to Lymphocyte Ratio, Platelet to Lymphocyte Ratio, Mean Platelet Volume and Red Cell Distribution Width Measures in Bells Palsy. Open Access Maced J Med Sci 5: 14-18. [Crossref]
- 11. Townsend JJ, Collins PK (1986) Peripheral nervous system demyelination with herpes simplex virus. J Neuropathol Exp Neurol 45: 419-425. [Crossref]
- 12. Bucak A, Ulu S, Oruc S, Yucedag F, Tekin MS, et al. (2014) Neutrophil-to-lymphocyte ratio as a novel-potential marker for predicting prognosis of Bell palsy. Laryngoscope 124: 1678-1681. [Crossref]
- 13. Adour KK, Bell DN, Hilsinger RL (1975) Herpes simplex virus in idiopathic facial paralysis (Bell palsy). JAMA 233: 527-530.
Editorial Information
Editor-in-Chief
Chin-Lung Kuo
Taoyuan Armed Forces General Hospital
Taiwan
Article Type
Research Article
Publication history
Received date: May 18, 2020
Accepted date: June 05, 2020
Published date: June 08, 2020
Copyright
©2020 Pokharel A. This is an open-access article distributed under the terms of the Creative Commons Attribution License, which permits unrestricted use, distribution, and reproduction in any medium, provided the original author and source are credited.
Citation
Pokharel A, Mayya JP (2020) Novel predictive factors of Bell’s Palsy: Neutrophil to lymphocyte ratio and platelet to lymphocyte ratio. Otorhinolaryngol Head Neck Surg 5: doi: 10.15761/OHNS.1000242