Background: Nutritional Risk Screening (NRS) has not been investigated in hospitalised pregnant women. The aim of this study was to evaluate the association between Obstetric NRS in high risk pregnancy (HRP) and maternal morbidity.
Methods: This prospective cohort study included 180 pregnant patients admitted for HRP. Patients were allocated in two groups (n = 90 p/group) using the Obstetric NRS criteria at the first 24 hours of admission: no nutritional risk group (Group A, Obstetric NRS score < 3) and nutritional risk group (Group B, Obstetric NRS score > 3). NR status was reassessed upon discharge. Study variables included: Obstetric NRS scores, maternal age, gestational age, height, hospital length of stay (LOS) and maternal morbidity.
Results: Average maternal age, gestational age, height and LOS was 29.6 ± 0.6 and 27.7 ± 0.6 years (p <0.05); 31.8 ± 7.5 and 31.3 ± 8.3 weeks (p >0.05); 1.5 and 1.6 meters (p <0.001) and; 4.7 ± 0.3 and 7.4 ± 0.4 days (p <0.001) for Groups A and B, respectively. Hospital morbidity was identified in 10 (11.1%) and 44 (48.8%) patients in the no nutritional risk and nutritional risk groups, respectively (p <0.05. RR = 2.23; 95% CI 0.36 - 0.81). Average Obstetric NRS scores were 1.2 and 3.5, on admission and 2.6 and 4.8 at discharge, on Groups A and B, respectively (p <0.001).
Conclusion: There was a positive association between the presence of nutritional risk in HRP patients and maternal morbidity. Nutritional Risk Status worsened when HRP patients were screened at discharge.
malnutrition, nutritional risk screening, nutritional status, undernutrition, high risk pregnancy, morbidity
Malnutrition has been regarded as a condition that has a negative effect in both clinical and surgical arena. Hospital length of stay (LOS), surgical complications, altered wound healing and immune dysfunction are some of the condition commonly affected by undernutrition in the hospital setting [1-4]. It is widely accepted that not only undernutrition deteriorates during hospital stay; it actually worsens the patient´s outcome and increases health care costs [5-8]. Malnutrition has been reported in up to 50% of hospitalised patients and diet components can play a critical role on the outcome [9,10]. Therefore, devising an extensively accepted protocol to identify undernourished patients on hospital admission has been the goal for many years [2,6,7]. Accordingly, J. Kondrup developed a set of nutritional screening guidelines (NRS-2002) that can predict the possibility of a worse or better outcome due to nutritional conditions and whether nutritional therapy can have a positive impact on outcome. That is, NRS-2002 methodology can detect the presence of undernutrition and the risk of developing undernutrition in the hospital setting [11,12]. Kondrup´s proposed NRS-2002 scoring system has been validated and is recommended by Eastern and European Countries and by the European Society of Parenteral and Enteral Nutrition (ESPEN) [1-3,11]. Reports indicate that NRS-2002 sensitivity and specificity are over 80% [2,3,12]. It incorporates MUST (malnutrition universal screening tool) elements and a scoring of severity of disease as an evidence of an increased metabolic rate [1-3,6]. The importance of proper nutritional screening in the hospitalised patient has already been reported in different clinical scenarios [5,6]. Such as, in elderly patients with hip fracture and male patients with severe COPD (chronic obstructive pulmonary disease); but not in the obstetric patient [13-16].
Maternal nutrition has been reported to play a critical role in both the development and outcome of pregnancy. Poor maternal nutrition can lead to an adverse outcome of pregnancy and childbirth. It is well known that nutritional requirements increase during pregnancy in order to cope with the needs of fetal growth [17-20]. However, intake of total energy, macronutrients and micronutrients are often inadequate during pregnancy. Therefore, a good nutritional adequacy in pregnant women is critical in order to optimise outcome. Unfortunately, there is not an international guide that can be used as a reference for antenatal professional counselling. But, a recent review of major dietary guidelines reports a general agreement in most aspects of nutrition in pregnancy [21]. Although some controversies about specific nutrients deserve further investigation. There is, though, universal agreement on eating the recommended amounts of daily servings, adequate daily hydration with a closely monitored weight control during pregnancy. International guidelines agree on basic protein, fat and carbohydrate requirements. With small differences, most international guidelines recommend increasing calorie intake from the second trimester (340 and 450 kcal/d increase in the 2nd and 3rd trimester, respectively). For women who start their pregnancy with a body mass index (BMI) < 18.5 kg/m2, a slight calorie increase (70 kcal/d) from the first trimester is recommended. This review analysis on international guidelines concludes that routine micronutrients supplementation is not recommended; unless there are specific deficiencies. This is true for vitamins A, E and C. While, there is not a general agreement regarding vitamin D. Although, deficiency and insufficiency of this vitamin are common during pregnancy; some guidelines do not recommend routine supplementation. Nevertheless, studies report a better neonatal outcome when vitamin D supplements are offered during pregnancy. Therefore, some international societies concur that vitamin D supplements should be recommended for all pregnant women. Since maternal anaemia has been associated with adverse birth and neonatal outcome, iron supplementation is recommended for women at high risk for anemia. Although, routine prescription in nonanemic pregnant women is not recommended. The best advice, as indicated by the review, is that pregnant women should be individually screened about their diet and counselled accordingly [21].
Maternal undernutrition is well recognized among low and middle income countries. Current information indicates that, in these countries, education level as well as a series of social conditions, including availability of home services, are responsible for the nutritional status of women of childbearing age [22]. Accordingly, the negative contribution of maternal undernutrition leads the way to women´s low weight, stunting and poor health status of their offspring [22,23]. There is, therefore, a clearly accepted relationship between maternal undernutrition and adverse pregnancy outcome. Increased number of cesarean deliveries, preeclampsia and stunting are some of the consequences of poor maternal nutritional status [22-26]. The latter along with poor weight gain during gestation are considered the most important contributing factors to birth weight in high risk pregnancy (HRP). This idea is supported by the knowledge that nutritional requirements increase during pregnancy to maintain both fetal growth and maternal metabolism [17,18]. Consequently, poor maternal nutrition can lead to an adverse outcome of pregnancy and childbirth [17-20]. A link between poor dietary quality in pregnancy and increased risk for preeclampsia has been reported; since placental development may be affected by low levels of micronutrients. A condition reported in undernourished pregnant women [21,27]. However, there are additional contributing risk factors to pregnancy outcome. These include obesity and overweight (the 21st century pandemic). Some studies indicate that obesity or high body mass index (BMI) increase the risk of preeclampsia and gestational hypertension; since maternal plasma lipids are significantly elevated during pregnancy. In fact, more substantial lipid changes have been observed in women who develop preeclampsia [27]. Therefore, the connection between maternal nutritional status; either as undernutrition, obesity or overweight (malnutrition as a global) and HRP remains to be further studied. Other than the possible association between poor maternal nutrition and the risk for preeclampsia; nutritional risk, in the obstetric patient with HRP has not been investigated before. The purpose of this work was to analyse the association between nutritional risk, on hospital admission, in HRP and maternal morbidity.
In this prospective cohort study, we included 180 pregnant patients admitted for delivery and because of High Risk Pregnancy (HRP) to Hospital of Obstetrics and Gynaecology at Western National Medical Centre, Mexican Institute of Social Security (IMSS). Patients were allocated in two groups (n = 90 p/group) using the Nutritional Risk Screening (NRS 2002) criteria developed by ESPEN and adapted for the Obstetric patient (obstetric NRS): no nutritional risk group (Group A, Obstric NRS score < 3) and nutritional risk group (Group B, Obstetric NRS score > 3) [11,12]. Groups were then compared to identify possible association between nutritional risk status on hospital admission and maternal morbidity; which was the main outcome. Maternal morbidity was defined as any condition that is attributed to or aggravated by pregnancy and childbirth which has a negative impact on the woman´s health [28]. Study variables included: Obstetric NRS scores, maternal age, gestational age, height, hospital length of stay, fasting, maternal morbidity, APGAR score and neonatal morbidity. A formula to calculate a sample size for cohort studies with a 95% confidence interval (1~a) and an 80% power (1~b) was utilised (Epi-info 2002, Statcalc). Therefore, with a 2.8 relative risk (RR), a sample size of 180 patients was determined: 90 exposed (nutritional risk) and 90 non-exposed (no nutritional risk) subjects, respectively. This study included all adult (> 18 y/o) HRP pregnant patients who stayed for a minimum of 3 days in the department of HRP (Figure 1). A high-risk pregnancy (HRP) was defined as one with either an abnormal or pathologic condition, concomitant to gestation or delivery, that threaten the life or health of the mother or fetus [28].
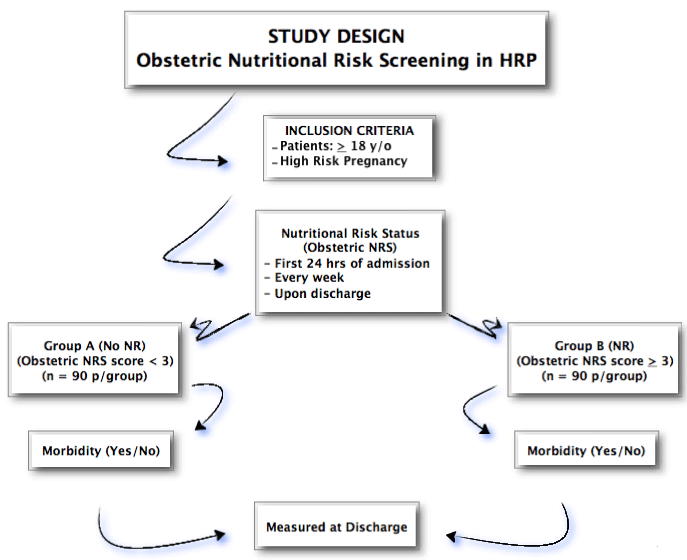
Figure 1. Experimental design for this study that includes selection criteria and the integration of two groups of patients: no nutritional risk group (Group A, Obstetric NRS score < 3) and nutritional risk group (Group B, Obstetric NRS score > 3), following the NRS criteria developed by ESPEN (NRS-2002) [11,12] and adapted for the obstetric patient. HRP, high risk pregnancy; NRS, nutritional risk screening; NR, nutritional risk; hrs, hours; y/o, years-old
Study design
HRP patients were assessed by the group of investigators, at the first 24 hours of admission, about their nutritional risk status in accordance with Obstetric NRS criteria (Table 1). Though, “they did not intervene in the patient management”. Thereafter, Obstetric NRS was performed every week or upon discharge. Accordingly, every patients received a NRS score based on two main categories: nutritional status and disease severity. Nutritional risk screening methodology has previously been described and was adapted for the obstetric patient with HRP [11,12]. It was validated by a round of experts in strict adherence to NRS-2002 criteria. It includes specific pathologies to syndromic clinical conditions from the original scoring system. Briefly, the Obstetric NRS score (0 - 6) was obtained by adding nutritional status score (0 - 3) and disease severity score (0 - 3). A total score > 3 was considered nutritionally at-risk. Nutritional status was scored as absent, mild, moderate and severe (0 - 3) based on three different variables: a) changes in estimated food intake, measured in quartiles; b) changes in body weight within the last 1 - 3 months, measured in percentage of body weight loss, and; c) changes in BMI, measured in kg/m2. Gestational weight gain (GWG) by trimester and pregravid BMI status according to the World Health Organization (WHO) categories: Underweight < 18.5 kg/m2; Normal weight 18.5 - 24.9 kg/m2; Overweight 25.0 - 29.9 kg/m2; Obese > 30 kg/m2, were considered for BMI range in different scores. Thus, BMI was categorised after gestational age, GWG by trimester and pregravid BMI [29]. The disease severity score was categorized as absent, mild, moderate and severe (0 - 3) based on admission (primary) diagnosis; which defines a “high risk pregnancy”. Table 1 summarizes how Obstetric NRS scores were calculated to categorize patients in either group: not at-risk (Group A) and nutritionally at-risk (Group B).
Table 1. Nutritional Risk Screening Scores in the Obstetric Patient with HRP
IMPAIRED NUTRITIONAL STATUS |
SEVERITY OF DISEASE |
Absent: Score 0
Normal nutritional status or PG BMI ≥ 20 kg/m2, 1st Trim BMI ≥ 20.6 kg/m2, 2nd Trim BMI ≥ 23.6 kg/m2, 3rd Trim BMI ≥ 25.6 kg/m2 |
Absent: Score 0
Normal nutritional requirements during gestation. |
Mild: Score 1
Wt lose > 5% in 3 months or food intake below 50-75% of normal requirements in preceding week or PG BMI 18.6-19.9 kg/m2, 1st Trim BMI 19.6-20.5 kg/m2, 2nd Trim BMI 21.6-23.5 kg/m2, 3rd Trim BMI 23.6-25.5 kg/m2 |
Mild: Score 1
Urinary tract infection, respiratory infection, cervicovaginitis, anemia, deep vein thrombosis, antiphospholipid syndrome, thrombocytopenia, systemic lupus erythematosus, epilepsy, gestational hypertension, HIV+, gestational DM, threatened abortion, recurrent abortion, depression, uterine myomatosis, uterine malformations, benign tumor, hypothyroidism, threatened preterm birth |
Moderate: Score 2
Wt lose > 5% in 2 months or food intake 25-50% of normal requirements in preceding week + impaired general condition or PG BMI 17.5-18.5 kg/m2, 1st Trim BMI 18.6-19.5 kg/m2, 2nd Trim BMI 20.6-21.5 kg/m2, 3rd Trim BMI 22.6-23.5 kg/m2 |
Moderate: Score 2
Major abdominal surgery, stroke, ROM, preeclampsia, intestinal adhesion syndrome, abruptio placentae, placenta previa, IUGR, oligohydramnios, prematurity, fetal malformations, fetal death, ≥ 3 previous CS, ovarian hyperstimulation, maternal cardiopathy, CRI, post-transplant, AIDS |
Severe: Score 3
Wt lose > 5% in 1 month or > 15% in 3 months or food intake 0-25% of normal requirements in preceding week + impaired general condition or PG BMI ≤ 17.4 kg/m2, 1st Trim BMI ≤ 18.5 kg/m2, 2nd Trim BMI ≤ 20.5 kg/m2, 3rd Trim BMI ≤ 22.5 kg/m2 |
Severe: Score 3
SAH, diabetic ketoacidosis, PTE, AKF, placenta accreta, CS with hysterectomy, bowel injury, hemorrhagic shock, trauma in general, TBI, eclampsia, hellp syndrome, chorioamnionitis, sepsis, liver abscess, malignancy, patient in ICU |
Obstetric Nutritional Risk Screening score can be obtained by adding the scores of impaired nutritional status (1-3) and severity of disease (1-3). If total score is ≥3, the patient is considered nutritionally at-risk. If total score is <3 the patients is not considered nutritionally at-risk. PG, Pregravid; Trim, Trimester; Wt, weight; HIV, human immunodeficiency virus, DM, diabetes mellitus; ROM, rupture of membranes; IUGR, intrauterine growth restriction; CS, cesarean section; CRI, chronic renal insufficiency; AIDS, acquired immunodeficiency syndrome; SAH, subarachnoid haemorrhage; PTE, pulmonary thromboembolism; AKF, acute kidney failure; TBI, traumatic brain injury; hellp, haemolysis, elevated liver enzymes, low platelets; ICU, intensive care unit. Adapted for the Obstetric patient with HRP from Kondrup J, et al. ESPEN Guidelines for Nutrition Screening 2002. Clinical Nutrition 2003;22(4):415-421 [11].
Ethics approval and consent to participate
The protocol was submitted and approved by the Local Hospital Ethics and Research Committee (IRB: protocol # F-2006-1310-34) and all information and patient data were handled and processed by the investigators, ensuring confidentiality at all times. Even though this investigation adhered to principles of good clinical practice, in accordance with the Declaration of Helsinki, and that the risk was less than the minimum, informed consent was obtained and all patients agreed to participate in this study.
Statistic analysis
Outcome variables are presented in raw numbers or percentages. For qualitative variables, the Pearson´s Chi2 test was utilised. The Fisher exact test was utilised when any of the values in the contingency table was equal or less than 5 and results are presented in percentages and proportions. Quantitative variables are expressed as mean ± standard deviation of the mean (SDM) and were compared by Student's t test for independent samples and results are reported on averages. The Mann-Whitney rank sum test was applied when normality test failed. Data were analysed by one-way analysis of variance (ANOVA) procedure, followed by the Student-Newman-Keuls’ test to determine differences between individual means. Turkey test and Dunn method were also utilised for paired multiple comparisons. In order to identify how different components of the scoring system influenced patient categorisation on risk and not at-risk; a logistic regression analysis was performed with the categories of BMI, recent body weight loss, recent diet intake and severity of the disease as independent continuous variables and patients nutritionally at-risk and at no nutritional risk as dependent binary variables. The analysis was performed using SigmaStat® (release 4.0), SPSS (release 8.0) and SAS (release 6.12). A p value equal to or less than 0.05 was considered statistically significant.
Average maternal age, gestational age, height and length of stay was 29.6 ± 0.6 and 27.7 ± 0.6 years (p =0.036); 31.8 ± 7.5 and 31.3 ± 8.3 weeks (p =0.181); 1.58 ± 0.0 and 1.64 ± 0.0 meters (p <0.001) and; 4.7 ± 0.3 and 7.4 ± 0.4 days (p <0.001) for the no nutritional risk and nutritional risk groups, respectively (Groups A and B). Total number of patients fasted on admission were 51 (56%) and 66 (73.3%) for groups A and B (p <0.001), respectively. Difference between the two groups was statistically significant, except for gestational age. Average APGAR score was 8 ± 1 and 6 ± 2 (p <0.05) for new born in groups A and B, respectively. Neonatal morbidity was observed in 10 (19%) and 30 (45%) (p <0.05) new born in groups A and B, respectively. Table 2 summarizes main characteristics of both groups of study (cohorts). Average weight on admission and at discharge was 76.6 ± 1.2 and 73.6 ± 1.3 kg; and 58.7 ± 0.5, and 54.1 ± 0.4 kg, for the no nutritional risk and nutritional risk groups, respectively (Figure 2A). Average BMI on admission and at discharge was 30.3 ± 0.4, and 29.2 ± 0.4 kg/m2; and 21.4 ± 0.1, and 19.8 ± 0.1 kg/m2, for the no nutritional risk and nutritional risk groups, respectively (Figure 2B). Paired multiple comparisons (Dunn method) found a statistically significant difference (P < 0.001), except when comparing weight and BMI on admission vs discharge in the no nutritional risk group.
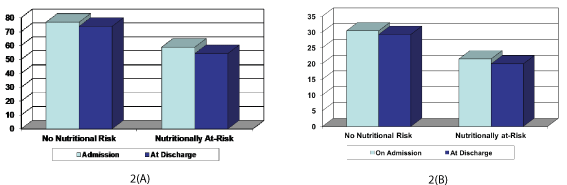
Figure 2A and 2B. This figure shows average weight (2A) and BMI (2B) on admission and at discharge for the no nutritional risk and nutritional risk groups, respectively. All pairwise multiple comparisons demonstrated a statistically significant difference (P < 0.001)*, except when comparing weight and BMI on admission vs discharge in the no nutritional risk group. ✝P > 0.05 vs on admission and at discharge in the no nutritional risk group
Table 2. Main characteristics of patients admitted for HRP and undergoing Obstetric NRS*
|
|
No Nutritional Risk
(n = 90) |
Nutritional Risk
(n = 90) |
P value |
|
|
|
|
|
|
|
|
|
|
|
Age |
(years ± SD) |
29.6 ± 5.7 |
27.7 ± 5.7 |
= 0.036 |
Gestational age |
(weeks ± SD) |
31.8 ± 7.5 |
31.3 ± 8.3 |
= 0.181 |
Height |
(meters ± SD) |
1.58 ± 0.06 |
1.64 ± 0.03 |
< 0.001 |
Length of stay |
(days ± SD) |
4.78 ± 0.30 |
7.44 ± 0.46 |
< 0.001 |
Fasting |
(n, %) |
51 (56%) |
66 (73.3%) |
< 0.001 |
APGAR Score |
(0-10 ± SD) |
8 ± 1 |
6 ± 2 |
< 0.05 |
Neonatal Morbidity |
(n, %) |
10 (19%) |
30 (45%) |
< 0.05 |
|
|
|
|
|
Occupation |
(n, %) |
|
|
|
|
|
|
|
|
Home |
|
47 (52%) |
43 (48%) |
= 0.88 |
Employee |
|
9 (19%) |
13 (14%) |
= 0.88 |
Accouter |
|
4 (4%) |
4 (4%) |
|
Lawyer |
|
0 |
1 (1%) |
|
Administrator |
|
2 (2%) |
1 (1%) |
|
Teacher |
|
1 (1%) |
0 |
|
Pharmacist |
|
1 (1%) |
0 |
|
Dentist |
|
3 (3%) |
0 |
|
Seamstress |
|
5 (5%) |
2 (2%) |
|
Secretary |
|
7 (8%) |
10 (11%) |
|
Receptionist |
|
0 |
3 (3%) |
|
Worker |
|
16 (18%) |
21 (23%) |
|
Retired |
|
1 (1%) |
1 (1%) |
|
Commerce |
|
3 (3%) |
0 |
|
Student |
|
0 |
2 (2%) |
|
|
|
|
|
|
Total |
|
90 (100%) |
90 (100%) |
|
|
|
|
|
|
*NRS, Nutritional Risk Screening; HRP, High Risk Pregnancy; APGAR, Appearance, pulse, grimace, activity, respiration; n, number; %, percentage; SD, Standard Deviation |
Nutritional risk and maternal morbidity
The use of nutritional risk screening tool (Obstetric NRS) in HRP demonstrated hospital morbidity in 10 (11.1%) and 44 (48.8%) patients in the no nutritional risk and nutritional risk groups, respectively (Figure 3). The difference between the two groups was statistically significant (p < 0.05. RR = 2.23; 95% CI 0.36 - 0.81; sensitivity p = 1.35). The most frequent morbidities were: chorioamnionitis, severe preeclampsia, and hellp syndrome in 13% and 1%, 9% and 1% and 8% and 1% in the nutritional risk and no nutritional risk groups, respectively. There was a positive association between the presence of nutritional risk, identified at the first 24 hour of admission, and hospital morbidity (p < 0.05, X2 = 30.58). That is, morbidity was significantly higher in patients who were identified nutritionally at-risk. The difference between morbidity and no morbidity was significantly (p < 0.05) and not significantly different (p > 0.05) in the no nutritional risk and the nutritionally at-risk groups, respectively.
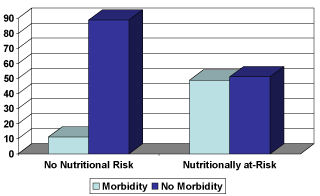
Figure 3. In this figure, HRP patients, who were “nutritionally at-risk”, demonstrated a higher morbidity than those patients in the “no nutritional risk group” (p < 0.05, X2 = 30.58). There was a positive association between nutritional risk identified at the first 24 hours of admission and morbidity (RR = 2.23; CI 95%, 0.36 - 0.81). *P < 0.05, no nutritional risk cohort vs nutritional risk cohort. ✝P < 0.05, morbidity vs no morbidity in the no nutritional risk group. ‡P > 0.05, morbidity vs no morbidity in the nutritionally at-risk group
On admission vs at discharge comparison of obstetric nutritional risk screening scores
Average Obstetric NRS scores were 1.2 ± 0.0 and 3.5 ± 0.0, on admission and 2.6 ± 0.1 and 4.8 ± 0.0 at discharge, for the “no nutritional risk” and the “nutritional risk” groups, respectively (Figure 4). Comparison of on admission and at discharge median scores were significantly different (p < 0.001) in both groups (Kruskal-Wallis ANOVA on ranks). We also found a statistically significant difference when pairwise multiple comparisons (Turkey test and Dunn method) were performed on all possible comparisons: on admission vs discharge; no nutritional risk vs nutritionally at-risk. Thirty-three percent (n = 30) of the patients whose Obstetric NRS score indicated “no nutritional risk” (NRS score < 3), became “nutritionally at-risk” (NRS score > 3) when screened at discharge (p < 0.05). Similarly, 73.3% (n = 66) of the patients identified as “nutritionally at-risk” (NRS score > 3) on admission, developed higher scores when screened at discharge (p < 0.05). Specifically, 45 (88.2%) of the HRP patients whose score was 3, 4 and 5 on admission, developed scores of 4 (n = 10 -19.6%-), 5 (n = 23 -45%-), and 6 (n = 12 -23.5%-) at discharge, respectively; while 16 (64%) of the HRP patients admitted with a score of 4, developed scores of 5 (n = 12 -48%-) and 6 (n = 4 -16%-) when screened at discharge. Finally, 5 (35.7%) of the patients whose Obstetric NRS indicated a score of 5 on admission, showed a score of 6 when assessed at discharge (Table 3).
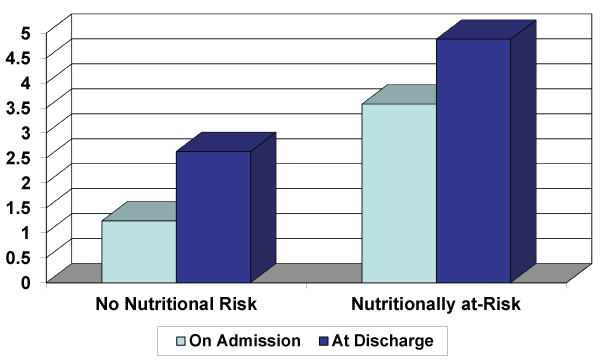
Figure 4. Obstetric NRS mean scores of patients admitted to the Department of High Risk Pregnancy. There was a statistically significant difference (p < 0.05) when paired multiple comparisons (Turkey test and Dunn method) were performed on all possible combinations. †P < 0.05 vs no nutritional risk at discharge and nutritionally at-risk on admission and at discharge, respectively. ‡P < 0.05 vs no nutritional risk on admission and nutritionally at-risk on admission and at discharge, respectively. ✻P < 0.05 vs nutritionally at-risk at discharge and no nutritional risk on admission and at discharge, respectively. µP < 0.05 vs nutritionally at-risk on admission and no nutritional risk on admission and at discharge
Table 3. On Admission vs At Discharge Comparison of Obstetric NRS Scores*
|
|
On Admission
(n)* (%) |
At Discharge
(n)* (%) |
|
|
|
|
|
|
|
|
|
|
|
|
NOT AT-RISK COHORT
Score |
|
|
|
|
|
|
|
|
|
1 |
|
66 (73.3%) |
31 (34.4%) |
|
2 |
|
24 (26.5%) |
29 (33.3%) |
|
3 |
|
|
0 |
|
4 |
|
|
7 (6.7%) |
|
5 |
|
|
16 (17.8%) |
33.33%* |
6 |
|
|
7 (7.8%) |
|
|
|
|
|
|
Total |
|
90 (100%) |
90 (100%) |
|
|
|
|
|
|
AT-RISK COHORT
Score
|
|
|
|
|
3 |
|
51 (56.7%) |
6 (6.6%) |
|
|
|
|
|
|
4 |
|
25 (27.8%) |
19 (21.1%) |
|
5 |
|
14 (15.6%) |
44 (48.9%) |
73.33%* |
6 |
|
0 |
21 (23.3%) |
|
|
|
|
|
|
Total |
|
90 (100%) |
90 (100%) |
|
|
|
|
|
|
Note that, 33.3% of the patients who were not nutritionally at-risk upon admission (scores 1 and 2), became nutritionally “at-risk” when screened at discharge (P < 0.05)*. Similarly, 73.3% of the patients identified as nutritionally “at-risk” (score > 3) upon admission, developed higher scores (4, 5 and 6) at discharge (P < 0.05)*.NRS, nutritional risk screening; n, number of patients.
|
In this study, we found a positive association between Obstetric Nutritional Risk and maternal morbidity in High Risk Pregnancy patients. Obstetric NRS scores worsened when patients were screened at discharge. And, preterm pregnancies were observed in both groups of study. However, nutritionally at-risk patients had a significantly higher morbidity and longer hospital stay. Housewife was the most prevalent occupation. Yet, there was not a direct relationship between occupation and the presence or not of NR. These results demonstrate that Obstetric NRS is a useful tool to identify HRP patients with either poor or good nutritional condition. Thus, screening for NR, at hospital admission, should be performed on HRP patients, as suggested for other clinical conditions [30,31]. Whether nutritionally at-risk patients might benefit from some type of nutritional support, remains to be investigated. Accordingly, our results are consistent with those reported in scenarios (Pathologies) different that the obstetric patient. That is, nutritionally at-risk patients show a higher complication (morbidity) rate. In a large cross-sectional study performed by Eli Skeie, et al., in mixed surgical patients, a positive association between NR and incidence of surgical site infection (SSI) was demonstrated [32]. In our study, only one patient in the nutritionally at-risk group developed sepsis. However, chorioamnionitis, preeclampsia, and Hellp syndrome were the most frequent complications. Current knowledge, in non-pregnant patients, indicates that specific nutrients may be involved in some steps in the pathogenesis of preeclampsia. It has also been suggested that nutrients such as trace elements, fatty acids and folic acid can contribute to insulin resistance, which is a key risk factor for preeclampsia [21,24,26]. Therefore, in order to lower morbidity and mortality as well as the consequences of a prolonged hospital stay, proper nutritional interventions should be instituted on nutritionally at-risk patients [5,6]. It can be presumed that, there would be a positive effect on hospital LOS and costs. Further investigation will be necessary to demonstrate this hypothesis. Thus, the risk of malnutrition with its consequences, in the hospital setting, is latent and pregnant women are not the exception [10]. Similar studies have found a significant association between NR and increased LOS in hospitalised elderly patients [5,33-35]. Furthermore, protein-energy malnutrition is a strong and independent risk factor associated with morbidity, mortality, prolonged LOS and higher complication rates, including infections [36-38]; as shown in our study.
Weeks of gestation demonstrated, on average, preterm pregnancies for both groups. This findings support the idea that maternal nutritional status has an impact on pregnancy outcome [17,18,26]. Since, most of our patients were either underweight or overweight (malnutrition as a whole). Nutritional requirements increase during pregnancy and despite the fact that there is a physiological adaptation (hypothesis of nutritional fetal origins) to nutritional status; there´s still unconvincing evidence about the impact of improving nutritional condition during pregnancy and offspring outcome [17-20,39,40]. Nevertheless, most major Guidelines recommend a good prenatal weight control along with an adequate intake of energy, protein, vitamins and minerals; in order to meet maternal and fetal needs [21]. This in turn would improve pregnancy and childbirth outcome. Some reports accept a link between reduced birthweight and poor fetal growth or stunting [22,25,26]. So, maternal undernutrition has a real impact on outcome for both the mother herself and her offspring [17,22,25,26]. Additionally, nutritional status of the hospitalised patient may further be compromised by fasting, loss of appetite, depression, along with a poor hospital diet. In our study, most of the patients were fasted on hospital admission. A condition that most likely contributed to the negative effect (worsening) observed on the NR status of patients in both groups of study. Although, the purpose of our study was not to investigate a possible association between NR and offspring outcome; we were able to identify both a significantly higher neonatal morbidity and lower APGAR scores in the nutritionally at-risk group. Interestingly enough, women in this group of study were undernourished and had longer hospital stays. Possible explanations are, as suggested by other, antenatal deficiencies of specific nutrients [21]. Therefore, improving maternal nutritional status before pregnancy or from the first trimester is highly advisable.
Irregardless of pregnancy, nutritional status has been involved in the occurrence of a great number of diseases [1-4]. And, maternal nutrition has been reported to play a critical role in both the development and outcome of pregnancy [17]. In fact, some studies have documented the global prevalence of maternal undernutrition and its short and long-term consequences in low and middle-income countries [22,25,26]. Thus, screening for malnutrition of the hospitalised patient has been the main concern in recent years. The idea has been to identify the already malnourished patients and those at increased risk of malnutrition; so an early and adequate nutritional plan can be tailored in order to lower in-hospital morbidity and mortality. But, the lack of evidence about nutritional risk (NR), in the obstetric patient, justified the inclusion of a protocol in patients admitted for HRP. NRS-2002 has been demonstrated to be useful to assess for NR in the hospital setting. The importance of this proven approach has been demonstrated in different specialties; such as cancer patients and those being treated for ischaemic and/or valvular heart disease [11-13,41-47]. However, NRS has not been explored at all in the obstetric patient with HRP.
Some studies indicate that outcome improves when nutritionally at-risk patients are properly treated [48]. Munk T et al. [49] compared an energy-enriched food menu versus a standard hospital food menu and found a significant positive impact on overall protein intake and on weight-adjusted energy intake in nutritionally at-risk patients. In our hospital, NRS is not performed on a regular basis. Possible explanation, as recognised by others, are lack of nutritional education, undefined responsibilities and time of the healthcare personnel [5,33,50]. Nevertheless, we acknowledge the need for an adequate nutritional screening and therapy in order to lower maternal morbidity and mortality as well as to improve pregnancy outcome. In our study, BMI measurements indicated that nutritionally at-risk patients were underweight; while not at-risk patients were, on average, overweight (malnutrition as a whole). These results are similar to those reported in low and middle-income countries [22,25,26]. Specific nutrient deficiencies may have contributed to an altered NR, on hospital admission, as well as to the development of a complicated pregnancy (HRP); as suggested in preeclamptic patients [19]. It can be argued that a better prenatal weight control might modify NR status; thus, improving pregnancy and childbirth outcome. Therefore, efforts should be aimed at improving maternal nutritional condition.
Consequently, a number of problems were identified with the use of the Obstetric NRS system in patient with HRP: morbidity was higher and hospital LOS was longer in patients who were nutritionally at-risk. HRP has been associated to perinatal morbidity and mortality; however, the impact of maternal NR status on neonatal outcome remains to be fully elucidated [51]. Although, we observed that neonatal morbidity was higher and APGAR scores were lower in nutritionally at-risk patients. So, maternal NR status had an impact on neonatal outcome. Studies have already demonstrated that NRS-2002 has a low inter-observer variation, among healthcare professionals, and a high predictive validity for clinical outcome [11,33,46]. That is, outcome improves when nutritionally at-risk patients are properly treated. Other screening tools have a lower predictive validity. They´ve shown that outcome remains unchanged when patients at-risk are treated [51]. Obstetric NRS combines nutritional status with severity of disease (admission diagnosis). This may help to anticipate the possible nutritional dysfunction induced by an increased metabolic stress. This, in turn, allows the physician to somehow predict the outcome and tailor appropriate nutritional plans accordingly [52]. Further investigations will focus on whether weight control (prior to or early in pregnancy) along with better prenatal care will modify NR status; thus improving pregnancy and offspring outcome.
To the best of our knowledge, this is the first study that evaluates NR on pregnant patients with HRP. Since an association between maternal undernutrition and maternal health conditions has been reported; we suggest screening for NR in non-pathologic pregnancy. Whether nutritional therapy can have a positive impact on both pregnancy and perinatal outcome remains to be elucidated. Despite promising results, this work has several limitations. This study was performed on pregnant patients with a pathologic condition (HRP). Therefore, a group of patients with a healthy pregnancy is missing in this study. Another limitation is the lack of information regarding newborn morbidity. That is, a more thorough analysis of neonate variables could identify a possible association between Obstetric NRS and childbirth outcome.
The Authors report no declarations of interest
This research did not receive any specific grant from funding agencies in the public, commercial or not-for-profit sectors.
We would like to express our gratitude to all the peer reviewers for their opinions and suggestions.
- Budzynski J, Tojek K, Czerniak B, Banaszkiewicz Z (2016) Scores of nutritional risk and parameters of nutritional status assessment as predictors of in-hospital mortality and readmissions in the general hospital population. Clin Nutr 35: 1464-1471. [Crossref]
- Koren-Hakim T, Weiss A, Hershkovitz A, Otzrateni I, Anbar R, et al. (2016) Comparing the adequacy of the MNA-SF, NRS-2002 and MUST nutritional tools in assessing malnutrition in hip fracture operated elderly patients. Clin Nutr 35: 1053-1058. [Crossref]
- van Bokhorst-de van der Schueren MA, Guaitoli PR, Jansma EP, de Vet HC (2014) Nutrition screening tools: does one size fit all? A systematic review of screening tools for the hospital setting. Clin Nutr 33: 39-58. [Crossref]
- Ulltang M, Vivanti AP, Murray E (2013) Malnutrition prevalence in medical assessment and planning unit and its association with hospital readmission. Aust Health Rev 37: 636-641. [Crossref]
- Khalarbari-Soltani S, Marques-VIdal P (2016) Impact of nutritional risk screening in hospitalized patients on management, outcome and costs: A retrospective study. Clin Nutr 35: 1340-1346. [Crossref]
- Rasmussen HH, Kondrup J, Staun M, Ladefoged K, Kristensen H, et al. (2004) Prevalence of patients at nutritional risk in Danish hospitals. Clin Nutr 23: 1009-1015. [Crossref]
- Sorensen J, Kondrup J, Prokopowicz J, Schiesser M, Krahenbuhl L, et al. (2008) EuroOOPS: an international, multicenter study to implement nutritional risk screening and evaluate clinical outcome. Clin Nutr 28: 340-349. [Crossref]
- Jie B, Jiang ZM, Nolan MT, Efron DT, Zhu SN, et al. (2010) Impact of nutritional support on clinical outcome in patients at nutritional risk: a multicenter, prospective cohort study in Baltimore and Beijing teaching hospitals. Nutrition 26: 1088-1093. [Crossref]
- Calleja A, Vidal A, Cano I, Ballesteros M (2014) Malnutrition in hospitalized patients receiving nutritionally complete menus: prevalence and outcomes. Nutr Hosp 30: 1344-1349. [Crossref]
- Knudsen AW, Naver A, Bisgaard K, Nordgaard-Lassen I, Becker U, et al. (2015) Nutrition impact symptoms, handgrip strength and nutritional risk in hospitalized patients with gastrointestinal and liver diseases. Scand J Gastroenterol 50: 1191-1198. [Crossref]
- Kondrup J, Allison SP, Elia M, Vellas B, Plauth M (2003) ESPEN guidelines for nutrition screening 2002. Clin Nutr 22: 415-421. [Crossref]
- Kondrup J, Rasmussen HH, Hamberg O, Stanga Z (2003) Nutritional Risk Screening (NRS 2002): a new method based on an analysis of controlled clinical trials. Clin Nutr 22: 321-336. [Crossref]
- Zanetti M, Cappellari GG, Ratti C, Ceschia G, Murena L, et al. (2018) Poor nutritional status but not cognitive or functional impairment per se independently predict 1 year mortality in elderly patients with hip fracture. Clin Nutr 38: 1607-1612. [Crossref]
- Shan X, Liu J, Luo Y, Xu X, Han Z, et al. (2015) Relationship between nutritional risk and exercise capacity in severe chronic obstructive pulmonary disease in male patients. Int J Chron Obstruct Pulmon Dis 10: 1207-1212. [Crossref]
- Bloomer RJ (2007) The role of nutritional supplements in the prevention and treatment of resistance exercise-induced skeletal muscle injury. Sports Med 37: 519-532. [Crossref]
- Hoppeler H, Weibel ER (2000) Structural and functional limits for oxygen supply to muscle. Acta Physiol Scand 168: 445-456. [Crossref]
- Bianchi CM, Mariotti F, Verger EO, Huneau JF (2016) Pregnancy requires major changes in the quality of the diet for nutritional adequacy: Simulations in the French and the United States populations. PLoS One 11: 1-17. [Crossref]
- Christian P, Stewart CP (2010) Maternal micronutrient deficiency, fetal development, and the risk of chronic disease. J Nutr 140: 437-445. [Crossref]
- Blumfield ML, Hure AJ, MacDonald-Wicks LK, Smith R, Simpson SJ, et al. (2012) Dietary balance during pregnancy is associated with fetal adiposity and fat distribution. Am J Clin Nutr 96: 1032-1041.
- Bath SC, Steer CD, Golding J, Emmett P, Rayman MP (2013) Effect of inadequate iodine status in UK pregnant women on cognitive outcomes in their children: results from the Avon Longitudinal Study of Parents and Children (ALSPAC). Lancet 382: 331-337. [Crossref]
- Tsakiridis I, Kasapidou E, Dagklis T, Leonida I, Leonida C, et al. (2020) Nutrition in Pregnancy: a comparative review of major guidelines. Obstet Gynecol Surv 75: 692-702. [Crossref]
- Khanam R, Lee ASC, Ram M, Quaiyum M, Begum N, et al. (2018) Levels and correlates of nutritional status of women of childbearing age in rural Bangladesh. Public Health Nutr 21: 3037-3047.
- Khan MN, Rahman MM, Shariff AA, Rahman MM, Rahman MS, et al. (2017) Maternal undernutrition and excessive body weight and risk of birth and health outcomes. Arch Public Health 75: 12. [Crossref]
- Xu H, Shatenstein B, Luo ZC, Wei S, Fraser W (2009) Role of nutrition in the risk of preeclampsia. Nutr Clin Care 67: 639-657. [Crossref]
- Victora CG, Adair L, Fall C, Hallal PC, Martorell R, et al. (2008) Maternal and child undernutrition: consequences for adult health and human capital. Lancet 371: 340-357. [Crossref]
- Black RE, Victora CG, Walker SP, Bhutta ZA, Christian P, et al. (2013) Maternal and child undernutrition and overweight in low-income and middle-income countries. Lancet 382: 427-451.
- Samur G, Akkus ÖÖ, Ede G, Ayaz A, Akyol A, et al. (2016) Nutritional status among women with preeclampsia and healthy pregnant women. Proper Nutr 18: 360-368.
- Cunningham, F.G., et al., 2018. Williams Obstetrics. 25th ed. New York. McGraw-Hill.
- National Research Council. Weight gain during pregnancy: Reexamining the Guidelines. Rasmussen KM, Yaktine AL, editors. Washington, DC: The National Academies Press 2009.
- Lim SL, Ong KC, Chan YH, Loke WC, Ferguson M, et al. (2012) Malnutrition and its impact on cost of hospitalization, length of stay, readmission and 3-year mortality. Clin Nutr 31: 345-350.
- Waitzberg DL, Caiaffa WT, Correia MITD (2001) Hospital malnutrition: the Brazilian national survey (IBRANUTRI): a study of 4000 patients. Nutrition 17: 573-580.
- Skeie E, Koch AM, Harthug S, Fosse U, Sygnestveit K, et al. (2018) A positive association between nutritional risk and the incidence of surgical site infections: A hospital-based register study. PLoS One 13: e0197344.
- Kondrup J, Johansen H, Plum LM, Bak L, Hojlund L, et al. (2002) Incidence of nutritional risk and causes of inadequate nutritional care in hospitals. Clin Nutr 21: 461-468.
- Bauer JM, Vogl T, Wicklein S, Trögner J, Mühlberg W, et al. (2005) Comparison of the mini nutritional assessment, subjective global assessment, and nutritional risk screening (NRS 2002) for nutritional screening and assessment in geriatric hospital patients. Z Gerontol Geriatr 38: 322-327.
- Martins CPAL, Correia JR, Do Amaral TF (2005) Undernutrition risk screening and length of stay of hospitalized elderly. J Nutr Elder 25: 5-21. [Crossref]
- Merker M, Gomes F, Stanga Z, Schultz P (2019) Evidence-based nutrition for the malnourished, hospitalized patient: one bite at a time. Swiss Med Wkly 149: w20112. [Crossref]
- Felder S, Braun N, Stanga Z, Kulkarni P, Faessler L, et al. (2016) Unraveling the link between malnutrition and adverse clinical outcomes: Association of acute and chronic malnutrition measures with blood biomarkers from different pathophysiological states. Ann Nutr Metab 68: 164-172.
- Felder S, Lechtenboehmer C, Bally M, Fehr R, Deiss M, et al. (2015) Association of nutritional risk and adverse medical outcomes across different medical inpatient populations. Nutrition 31: 1385-1393. [Crossref]
- Macleod J, Tang L, Hobbs FDR, Wharton B, Holder R, et al. (2013) Effects of nutritional supplementation during pregnancy on early adult disease risk: Follow up of offspring of participants in a randomized controlled trial investigating effects of supplementation on infant birth weight. PLoS One 8: e83371. [Crossref]
- Bateson P, Barker D, Clutton-Brock T, Deb D, D’Udine B, et al. (2004) Developmental plasticity and human health. Nature 430: 419-421.
- Naber TH, Schermer T, de Bree A, Nusteling K, Eggink L, et al. (1997) Prevalence of malnutrition in nonsurgical hospitalized patients and its association with disease complications. Am J Clin Nutr 66: 1232-1233. [Crossref]
- Mc Whirther JP, Pennington CR (1994) Incidence and recognition of malnutrition in hospital. BMJ 308: 945-948. [Crossref]
- Edington J, Boorman J, Durrant ER, Perkins A, Giffin CV, et al. (2000) Prevalence of malnutrition on admission to four hospitals in England. The malnutrition prevalence group. Clin Nutr 19: 191-195.
- Rasmussen HH, Kondrup J, Ladefoged K, Staun M (1999) Clinical nutrition in Danish hospitals: A questionnaire based investigation among doctors and nurses. Clin Nutr 18: 153-158. [Crossref]
- Kelly IE, Tessier S, Cahill A, Morris SE, Crumley A, et al. (2000) Still hungry in hospital: identifying malnutrition acute hospital admissions. QJM 93: 93-98. [Crossref]
- Illa P, Tomiskova M, Skrickova J (2015) Nutritional risk screening predicts tumor response in lung cancer patients. J Am Coll Nutr 34: 425-429. [Crossref]
- Bodan M, Laviano A, Persic V, Rotim A, Jovanovic Z, et al. (2014) Characteristics of NRS-2002 nutritional risk screening in patients hospitalized for secondary cardiovascular prevention and rehabilitation. J Am Coll Nutr 33: 466-473. [Crossref]
- Rasmussen HH, Holst M, Kondrup J (2010) Measuring nutritional risk in hospitals. Clin Epidemiol 2: 209-216. [Crossref]
- Munk T, Beck AM, Holst M, Rosenbom E, Rasmussen HH, et al. (2014) Positive effect of protein-supplemented hospital food on protein intake in patients at nutritional risk: a randomized controlled trial. J Hum Nutr Diet 27: 122-132. [Crossref]
- Khalatbari-Soltani S, Marques-Vidal P (2018) Adherence to hospital nutritional status monitoring and reporting guidelines. PLoS One 13: e0204000. [Crossref]
- Zhu X, Niu H, Wang H, Li X, Qi T, et al. (2019) High risk pregnancy associated perinatal morbidity and mortality: a second with population-based survey in Huai’an in 2015. BMC Pregnancy and Childbirth 19: 1-15.
- Cao J, Peng L, Li R, Chen Y, Li X, et al. (2014) Nutritional risk screening and its clinical significance in hospitalized children. Clin Nutr 33: 432-436. [Crossref]
Editorial Information
Editor-in-Chief
John Livingston Powell
University of North Carolina School of Medicine
USA
Article Type
Research Article
Publication history
Received date: October 12, 2021
Accepted date: October 26, 2021
Published date: October 28, 2021
Copyright
©2021 Anaya-Prado R. This is an open-access article distributed under the terms of the Creative Commons Attribution License, which permits unrestricted use, distribution, and reproduction in any medium, provided the original author and source are credited.
Citation
KAnaya-Prado R, Torres-Mora LV, Anaya-Fernandez MM, Anaya-Fernandez R, Izaguirre-
Perez ME (2021) Obstetric nutritional risk screening in high-risk pregnancy and its association with maternal morbidity: A prospective cohort study. Clin Obstet Gynecol Reprod Med 7: DOI: 10.15761/COGRM.1000334
Figure 1. Experimental design for this study that includes selection criteria and the integration of two groups of patients: no nutritional risk group (Group A, Obstetric NRS score < 3) and nutritional risk group (Group B, Obstetric NRS score > 3), following the NRS criteria developed by ESPEN (NRS-2002) [11,12] and adapted for the obstetric patient. HRP, high risk pregnancy; NRS, nutritional risk screening; NR, nutritional risk; hrs, hours; y/o, years-old
Figure 2A and 2B. This figure shows average weight (2A) and BMI (2B) on admission and at discharge for the no nutritional risk and nutritional risk groups, respectively. All pairwise multiple comparisons demonstrated a statistically significant difference (P < 0.001)*, except when comparing weight and BMI on admission vs discharge in the no nutritional risk group. ✝P > 0.05 vs on admission and at discharge in the no nutritional risk group
Figure 3. In this figure, HRP patients, who were “nutritionally at-risk”, demonstrated a higher morbidity than those patients in the “no nutritional risk group” (p < 0.05, X2 = 30.58). There was a positive association between nutritional risk identified at the first 24 hours of admission and morbidity (RR = 2.23; CI 95%, 0.36 - 0.81). *P < 0.05, no nutritional risk cohort vs nutritional risk cohort. ✝P < 0.05, morbidity vs no morbidity in the no nutritional risk group. ‡P > 0.05, morbidity vs no morbidity in the nutritionally at-risk group
Figure 4. Obstetric NRS mean scores of patients admitted to the Department of High Risk Pregnancy. There was a statistically significant difference (p < 0.05) when paired multiple comparisons (Turkey test and Dunn method) were performed on all possible combinations. †P < 0.05 vs no nutritional risk at discharge and nutritionally at-risk on admission and at discharge, respectively. ‡P < 0.05 vs no nutritional risk on admission and nutritionally at-risk on admission and at discharge, respectively. ✻P < 0.05 vs nutritionally at-risk at discharge and no nutritional risk on admission and at discharge, respectively. µP < 0.05 vs nutritionally at-risk on admission and no nutritional risk on admission and at discharge
Table 1. Nutritional Risk Screening Scores in the Obstetric Patient with HRP
IMPAIRED NUTRITIONAL STATUS |
SEVERITY OF DISEASE |
Absent: Score 0
Normal nutritional status or PG BMI ≥ 20 kg/m2, 1st Trim BMI ≥ 20.6 kg/m2, 2nd Trim BMI ≥ 23.6 kg/m2, 3rd Trim BMI ≥ 25.6 kg/m2 |
Absent: Score 0
Normal nutritional requirements during gestation. |
Mild: Score 1
Wt lose > 5% in 3 months or food intake below 50-75% of normal requirements in preceding week or PG BMI 18.6-19.9 kg/m2, 1st Trim BMI 19.6-20.5 kg/m2, 2nd Trim BMI 21.6-23.5 kg/m2, 3rd Trim BMI 23.6-25.5 kg/m2 |
Mild: Score 1
Urinary tract infection, respiratory infection, cervicovaginitis, anemia, deep vein thrombosis, antiphospholipid syndrome, thrombocytopenia, systemic lupus erythematosus, epilepsy, gestational hypertension, HIV+, gestational DM, threatened abortion, recurrent abortion, depression, uterine myomatosis, uterine malformations, benign tumor, hypothyroidism, threatened preterm birth |
Moderate: Score 2
Wt lose > 5% in 2 months or food intake 25-50% of normal requirements in preceding week + impaired general condition or PG BMI 17.5-18.5 kg/m2, 1st Trim BMI 18.6-19.5 kg/m2, 2nd Trim BMI 20.6-21.5 kg/m2, 3rd Trim BMI 22.6-23.5 kg/m2 |
Moderate: Score 2
Major abdominal surgery, stroke, ROM, preeclampsia, intestinal adhesion syndrome, abruptio placentae, placenta previa, IUGR, oligohydramnios, prematurity, fetal malformations, fetal death, ≥ 3 previous CS, ovarian hyperstimulation, maternal cardiopathy, CRI, post-transplant, AIDS |
Severe: Score 3
Wt lose > 5% in 1 month or > 15% in 3 months or food intake 0-25% of normal requirements in preceding week + impaired general condition or PG BMI ≤ 17.4 kg/m2, 1st Trim BMI ≤ 18.5 kg/m2, 2nd Trim BMI ≤ 20.5 kg/m2, 3rd Trim BMI ≤ 22.5 kg/m2 |
Severe: Score 3
SAH, diabetic ketoacidosis, PTE, AKF, placenta accreta, CS with hysterectomy, bowel injury, hemorrhagic shock, trauma in general, TBI, eclampsia, hellp syndrome, chorioamnionitis, sepsis, liver abscess, malignancy, patient in ICU |
Obstetric Nutritional Risk Screening score can be obtained by adding the scores of impaired nutritional status (1-3) and severity of disease (1-3). If total score is ≥3, the patient is considered nutritionally at-risk. If total score is <3 the patients is not considered nutritionally at-risk. PG, Pregravid; Trim, Trimester; Wt, weight; HIV, human immunodeficiency virus, DM, diabetes mellitus; ROM, rupture of membranes; IUGR, intrauterine growth restriction; CS, cesarean section; CRI, chronic renal insufficiency; AIDS, acquired immunodeficiency syndrome; SAH, subarachnoid haemorrhage; PTE, pulmonary thromboembolism; AKF, acute kidney failure; TBI, traumatic brain injury; hellp, haemolysis, elevated liver enzymes, low platelets; ICU, intensive care unit. Adapted for the Obstetric patient with HRP from Kondrup J, et al. ESPEN Guidelines for Nutrition Screening 2002. Clinical Nutrition 2003;22(4):415-421 [11].
Table 2. Main characteristics of patients admitted for HRP and undergoing Obstetric NRS*
|
|
No Nutritional Risk
(n = 90) |
Nutritional Risk
(n = 90) |
P value |
|
|
|
|
|
|
|
|
|
|
|
Age |
(years ± SD) |
29.6 ± 5.7 |
27.7 ± 5.7 |
= 0.036 |
Gestational age |
(weeks ± SD) |
31.8 ± 7.5 |
31.3 ± 8.3 |
= 0.181 |
Height |
(meters ± SD) |
1.58 ± 0.06 |
1.64 ± 0.03 |
< 0.001 |
Length of stay |
(days ± SD) |
4.78 ± 0.30 |
7.44 ± 0.46 |
< 0.001 |
Fasting |
(n, %) |
51 (56%) |
66 (73.3%) |
< 0.001 |
APGAR Score |
(0-10 ± SD) |
8 ± 1 |
6 ± 2 |
< 0.05 |
Neonatal Morbidity |
(n, %) |
10 (19%) |
30 (45%) |
< 0.05 |
|
|
|
|
|
Occupation |
(n, %) |
|
|
|
|
|
|
|
|
Home |
|
47 (52%) |
43 (48%) |
= 0.88 |
Employee |
|
9 (19%) |
13 (14%) |
= 0.88 |
Accouter |
|
4 (4%) |
4 (4%) |
|
Lawyer |
|
0 |
1 (1%) |
|
Administrator |
|
2 (2%) |
1 (1%) |
|
Teacher |
|
1 (1%) |
0 |
|
Pharmacist |
|
1 (1%) |
0 |
|
Dentist |
|
3 (3%) |
0 |
|
Seamstress |
|
5 (5%) |
2 (2%) |
|
Secretary |
|
7 (8%) |
10 (11%) |
|
Receptionist |
|
0 |
3 (3%) |
|
Worker |
|
16 (18%) |
21 (23%) |
|
Retired |
|
1 (1%) |
1 (1%) |
|
Commerce |
|
3 (3%) |
0 |
|
Student |
|
0 |
2 (2%) |
|
|
|
|
|
|
Total |
|
90 (100%) |
90 (100%) |
|
|
|
|
|
|
*NRS, Nutritional Risk Screening; HRP, High Risk Pregnancy; APGAR, Appearance, pulse, grimace, activity, respiration; n, number; %, percentage; SD, Standard Deviation |
Table 3. On Admission vs At Discharge Comparison of Obstetric NRS Scores*
|
|
On Admission
(n)* (%) |
At Discharge
(n)* (%) |
|
|
|
|
|
|
|
|
|
|
|
|
NOT AT-RISK COHORT
Score |
|
|
|
|
|
|
|
|
|
1 |
|
66 (73.3%) |
31 (34.4%) |
|
2 |
|
24 (26.5%) |
29 (33.3%) |
|
3 |
|
|
0 |
|
4 |
|
|
7 (6.7%) |
|
5 |
|
|
16 (17.8%) |
33.33%* |
6 |
|
|
7 (7.8%) |
|
|
|
|
|
|
Total |
|
90 (100%) |
90 (100%) |
|
|
|
|
|
|
AT-RISK COHORT
Score
|
|
|
|
|
3 |
|
51 (56.7%) |
6 (6.6%) |
|
|
|
|
|
|
4 |
|
25 (27.8%) |
19 (21.1%) |
|
5 |
|
14 (15.6%) |
44 (48.9%) |
73.33%* |
6 |
|
0 |
21 (23.3%) |
|
|
|
|
|
|
Total |
|
90 (100%) |
90 (100%) |
|
|
|
|
|
|
Note that, 33.3% of the patients who were not nutritionally at-risk upon admission (scores 1 and 2), became nutritionally “at-risk” when screened at discharge (P < 0.05)*. Similarly, 73.3% of the patients identified as nutritionally “at-risk” (score > 3) upon admission, developed higher scores (4, 5 and 6) at discharge (P < 0.05)*.NRS, nutritional risk screening; n, number of patients.
|