Ongoing standardized verification of the packed cell volume of blood glucose meter systems for self-monitoring post-launch is important clinically and helps confirm appropriate continues performance of self-monitoring blood glucose (SMBG) - systems [1]. In addition, publication of such studies is increasingly becoming a component of evidence-based purchase decision making. ISO 15197:2015, [2] for which mandatory compliance is recommended for SMBG systems by 2015, [3] has tighter accuracy requirements than ISO 15197:2003, [4]and outlines current minimum packed cell volume standards necessary in Europe for CE marking.
In the present study, a post marketing evaluation of the CE-marked GL50 evo and GL44 systems were performed in accordance with ISO 15197:2015 protocols and requirements. The GL50 evo and GL44 systems were supplied in Germany from the Beurer GmbH, Germany. A declaration of conformity from the manufacturer of the two measuring systems was available before the start of the study, so that only the GL50 evo was used in the tests, but the results documented the quality of both systems.
The study was conducted on 17th/18th of August and 17th/18th of October 2017, respectively. At the study days, the room temperature was always at 21°C with humidity from 49 up to 52%. This met the measurement conditions specified in the device instructions in Table 1. On the research days, the room temperature and humidity were recorded in the room for blood collection and in the location of the YSI device as well.
Table 1. Defined hematocrit values/ranges (HC) were adjusted in the blood samples
|
HC 1
|
HC 2
|
HC 3
|
HC 3 median sample
|
HC 5
|
HC 6
|
HC 7
|
|
20 %
|
28 %
|
35 %
|
41 %
|
44 %
|
54 %
|
58 %
|
The mean hematocrit range of 41% was used as the reference (range) for the statistical evaluation as specified in the ISO standard.
Before and after each test measurement per sample, the glucose concentration of the sample was measured with the reference method doubly in the YSI 2300. Glucose concentrations of 38.1- 46.5 mg/dl, 103.8- 112.5 mg/dl and 317.8-351.8 mg/dl, respectively, were set in the five HC values/ranges. The drift in the concentrations, measured before and after the tests, was in none of the samples greater than 4 mg/dl (for the range <100 mg/dl) or 4 % (for the range >100 mg/dl). The glucose concentrations of each sample in the five HC values/ranges measured with the reference device are summarized in the following table 2.
Table 2. Glucose concentrations of the samples measured in the reference device YSI 2300
|
HK (%)
|
|
YSI (mg/dl)
|
|
Drift in mg/dl
|
Drift in %
|
|
Mean
|
Before
|
After
|
|
20
|
42.9
|
43.2
|
42.6
|
0.6
|
|
|
103.8
|
104.5
|
103.0
|
|
1.4
|
|
337.3
|
331.5
|
343.0
|
|
-3.5
|
|
28
|
41.9
|
42.2
|
41.6
|
0.6
|
|
|
112.5
|
112.5
|
112.5
|
|
0.0
|
|
317.8
|
319.0
|
316.5
|
|
0.8
|
|
35
|
38.1
|
38.2
|
38.1
|
0.1
|
|
|
112.5
|
110.5
|
114.5
|
|
-3.6
|
|
336.3
|
335.5
|
337.0
|
|
-0.4
|
|
41
|
44.0
|
44.3
|
43.7
|
0.5
|
|
|
111.0
|
111.5
|
110.5
|
|
0.9
|
|
333.3
|
328.5
|
338.0
|
|
-2.9
|
|
44
|
46.5
|
46.1
|
46.9
|
-0.7
|
|
|
111.0
|
111.0
|
111.0
|
|
0.0
|
|
327.5
|
326.5
|
328.5
|
|
-0.6
|
|
54
|
42.1
|
42.7
|
41.5
|
1.3
|
|
|
109.0
|
109.5
|
108.5
|
|
0.9
|
|
344.8
|
341.0
|
348.5
|
|
-2.2
|
|
58
|
38.1
|
38.4
|
37.7
|
0.7
|
|
|
105.5
|
106.0
|
105.0
|
|
0.9
|
|
351.8
|
355.0
|
348.5
|
|
1.8
|
Results
The systemic deviation component of glucose (Dev GC to YSI in mg/dl) and the percent systemic deviation component (Dev GC to YSI in%), the difference between the average systemic deviation component of glucose and the average systemic deviation component of mean sample (Difference of Dev. of the range to HC) and the mean differential deviation component of the mean probe (Difference of Dev. of the range to HC) as well as the mean and standard deviation for all three lots and each combination of packed cell volume and glucose concentration are shown in the following table 3.
Table 3. The values averaged from the three lots are listed in the following table. (Effect of packed cell volume on Beurer GL50 evo / GL44 measurements - 3 lots averaged)
|
HC (%)
|
GC (mg/dl)
|
Dev. GC to YSI (mg/dl)
|
Dev. GC to YSI
(%)
|
Difference of Dev. of the range to HC 41 (mg/dl)
|
Difference of Dev. of the range to HC 41 (%)
|
|
Mean
|
SD
|
|
20
|
46.8
|
1.7
|
4.0
|
9.3
|
3.3
|
7.8
|
|
113.8
|
2.9
|
10.1
|
9.7
|
3.9
|
4.2
|
|
346.8
|
8.2
|
9.6
|
2.8
|
21.4
|
6.4
|
|
28
|
44.8
|
1.7
|
2.9
|
6.9
|
2.2
|
5.4
|
|
123.7
|
3.2
|
11.2
|
10.0
|
5.1
|
4.5
|
|
329.6
|
8.4
|
11.9
|
3.7
|
23.8
|
7.3
|
|
35
|
42.3
|
1.1
|
4.1
|
10.9
|
3.5
|
9.4
|
|
122.0
|
2.3
|
9.5
|
8.4
|
3.3
|
2.9
|
|
332.2
|
7.2
|
- 4.0
|
- 1.2
|
7.9
|
2.4
|
|
41
|
44.6
|
1.1
|
0.7
|
1.5
|
0.0
|
0.0
|
|
117.1
|
3.6
|
6.1
|
5.5
|
0.0
|
0.0
|
|
321.4
|
6.9
|
- 11.9
|
- 3.6
|
0.0
|
0.0
|
|
44
|
47.1
|
1.8
|
0.6
|
1.3
|
0.0
|
-0.2
|
|
113.9
|
3.6
|
2.9
|
2.6
|
-3.3
|
-2.9
|
|
308.8
|
8.5
|
- 18.7
|
- 5.7
|
-6.8
|
-2.1
|
|
54
|
45.9
|
2.3
|
3.8
|
9.1
|
3.2
|
7.6
|
|
117.4
|
5.9
|
8.4
|
7.7
|
2.3
|
2.2
|
|
319.8
|
16.4
|
- 25.0
|
- 7.2
|
-13.1
|
-3.7
|
|
58
|
43.4
|
1.9
|
5.4
|
14.1
|
4.7
|
12.7
|
|
111.0
|
4.0
|
5.5
|
5.2
|
-0.6
|
-0.3
|
|
341.7
|
10.3
|
- 10.1
|
- 2.9
|
1.8
|
0.7
|
The attached figure 1 shows the calculated difference (ordinate for mg/dl (above) and % (below), respectively) to the corresponding reference value (HC 41%) for each average value of the samples measured with the Beurer GL50 evo / GL44 device.
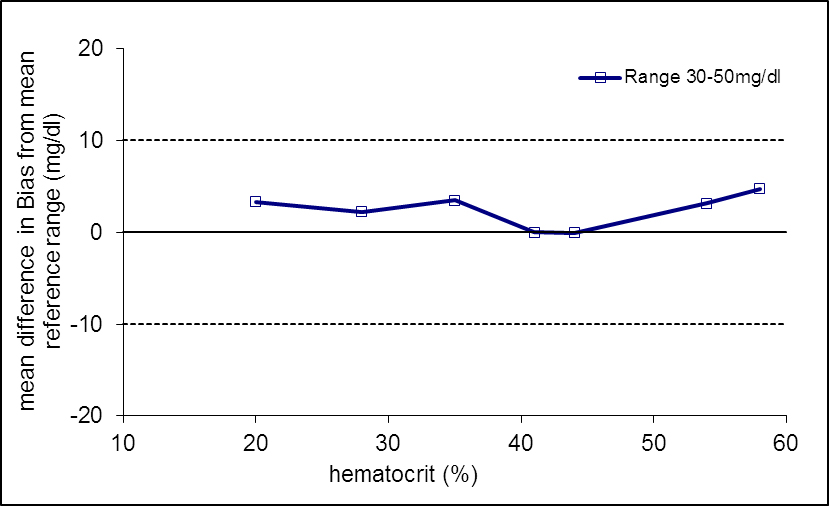
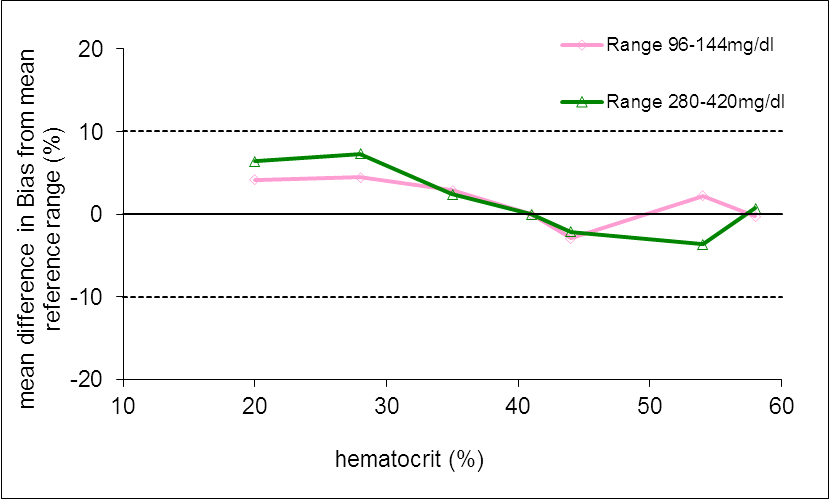
Figure 1. Measuring accuracy of the Beurer GL50 evo and GL44 device in relation to changed HC at three ranges of the blood glucose
Conclusion
- of the glucose values are within the acceptance limits / tolerance limits (solid lines).
In conclusion, the glucose meter Beurer GL50 evo and GL44 meet the criteria of the EN ISO standard 15197: 2015. In all three lots 100 % of all readings are within the acceptance limits defined by EN ISO 15197: 2015.
Acknowledgments
Beurer GmbH were permitted to review and comment on the manuscript, but final decision on content was retained by the authors.
Conflicts of interests
The author(s) declared the following potential conflicts of interest with respect to the research, authorship, and/or publication of this article: All authors are employees of the Institut of Diabetes, Karlsburg, Germany, which carries out studies evaluating blood glucose meter systems on behalf of various companies.
Funding
The author(s) disclosed receipt of the following financial support for the research, authorship, and/or publication of this article: This study was funded by Beurer GmbH Soflinger Str 218, 89077 Ulm Germany.
References
- Klonoff DC, Prahalad P (2015) Performance of cleared blood glucose monitors.J Diabetes Sci Technol 9: 895-910. [Crossref]
- International Organization for Standardization.In vitro diagnostic test systems-requirements for blood-glucose monitoring systems for self-testing in managing diabetes mellitus. ISO 15197: 2013.
- Baumstark A, Schmid C, Pleus S, Rittmeyer D, Haug C, et al. (2013) Accuracy assessment of an advanced blood glucose monitoring system for self-testing with three reagent system lots following ISO 15197:2013.J Diabetes Sci Technol 8: 1241-1242. [Crossref]
- International Organization for Standardization.In vitro diagnostic test systems-requirements for blood-glucose monitoring systems for self-testing in managing diabetes mellitus. EN ISO 15197: 2003.
- Parkes JL, Slatin SL, Pardo S, Ginsberg BH (2000) A new consensus error grid to evaluate the clinical significance of inaccuracies in the measurement of blood glucose.Diabetes Care 23: 1143-1148. [Crossref]
- Bland JM, Altman DG.Statistical methods for assessing agreement between two methods of clinical measurement.Lancet 1: 307-310.[Crossref]