Magnetic resonance imaging (MRI) of the pediatric brain has provided us with great insight into the maturation processes that take place after birth. However, in order for us to derive benefits from the information provided to us, it is imperative for us to first establish normality. This is extremely challenging especially in the first 2 years of life as the appearance of a normal brain changes according to the stage of development. Changes in normal appearances, clues on how to differentiate them from true pathologies as well as their clinical significance are outlined in this article. Several points of confusion that commonly arise in reviewing MR images of pediatric brain are emphasized, including 1) What are the normal signal intensities within the brain? When do we make a diagnosis of HIE or periventricular leukomalacia? 2) Ventriculomegaly : Is it benign external hydrocephalus, ex-vacuo ventricular dilatation or communicating hydrocephalus? 3) Corpus callosum : More than just another midline structure. When to call it abnormal, what are the common associated abnormalities and how to use it to estimate the time of insult? 4) Thickened cerebral cortex : Malformations of cortical development (MCD) and “pseudothickening” of cortex 5) Dandy Walker syndrome, inferior vermian hypoplasia, persistent Blake pouch cyst or mega cisterna magna?
An understanding of the normal myelination process is crucial in allowing an accurate diagnosis of signal abnormalities within the pediatric brain. The introduction of clinical MRI in the 1980s [1] enables us to evaluate this complicated but important process.
T1-weighted images are useful in the earlier stages of myelination when an increase in levels of cholesterol and galactocerebrosides within the cell membranes result in an increase in T1 signal [2]. In the more advanced stages, when there is reduction in free brain water, T2-weighted images are deemed more useful, showing reduction in T2 signal [1,3]. At one year of age, T1 contrast pattern would be similar to that of an adult, although the myelination process is still on going. Hence, T1-weighted images are of little value after the first year.
The thalamic nuclei and globus pallidi will start to myelinate at 24-25 weeks of gestation while the cortico-spinal tracts will myelinate by 36 weeks, best appreciated along the peri-rolandic cortex and posterior limb of the internal capsules (Figure 1 a - g). Hence, absence of T1 hyperintense and T2 hypointense signal within the ventrolateral thalami and posterior portion of the posterior limb of the internal capsule in a term neonate would be abnormal [4].
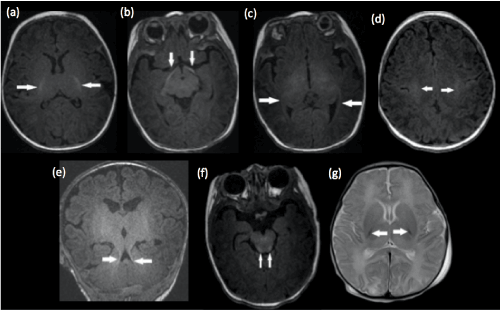
Figure 1. Structures of the brain that are myelinated at birth in a term infant. Axial T1-weighted images demonstrate normal T1 hyperintense signal within the (a) posterior limb of the internal capsule, (b) optic tracts, (c) optic radiations, (d) peri-rolandic cortex, (e) superior cerebellar peduncles and (f) dorsal brainstem. (g) Axial T2-weighted image shows the normal hypointense signal within the posterior portion of the posterior limb of the internal capsules. Faint T2 hypointense signal is also appreciated within the ventrolateral thalami and far lateral posterior putamen. These hypointense landmarks would be lost in the basal-ganglia-thalamus pattern of HIE.
Hypoxic ischemic encephalopathy (HIE) is a key etiology of neonatal morbidity and mortality. It is therefore important for radiologists to be familiar with its subtle findings. The challenge in the implementation of neuro-protective measures is the narrow time window for therapy initiation [5,6,7], making early detection critically important. Two major patterns of HIE are the border zone pattern and basal ganglia-thalamus pattern [8,9,10,11] (Figure 2 a-b).
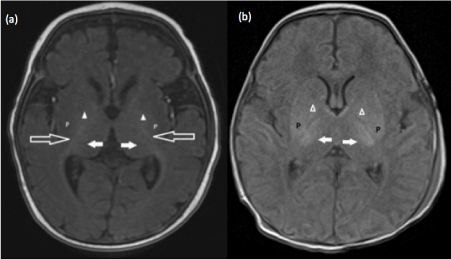
Figure 2. (a) Axial T1-weighted image at the level of the basal ganglia of a normal term neonate. As a general rule, the globus pallidi (∆) and the posterior limb of the internal capsules (long white arrows) should be more hyperintense than the posterolateral putamen (P). Note the normal T1 hyperintense signal within the ventrolateral thalamic nuclei (white short solid arrows), usually less than that seen within the posterior limb of internal capsules (b). T1-weighted image of the brain of a term neonate with hypoxic ischemic brain injury shows abnormal T1 hyperintense signal within the posterolateral putamen (P) and ventrolateral thalamic nuclei white short solid arrows). The posterior limbs of the internal capsules are not well visualized. This is known as the absent posterior limb sign. Note that the posterolateral putamen demonstrates higher signal compared to the globus pallidi (∆), a sign of pathology
Periventricular leukomalacia (PVL) is a subset of HIE which occurs primarily in preterm infants, due to the ventriculopetal vascular pattern. This results in a vascular border zone around the trigones and posterior horns of the lateral ventricles. Some believed that PVL is a result of selective vulnerability of cells of oligodendrocyte lineage to hypoxic-ischemic insult [12,13].
Several basic principles need to be kept in mind when assessing a child with possible hypoxic-ischemic injury:
- First, false negative finding on diffusion-weighted imaging (DWI) may occur in the first few hours of injury [14,15]. Some injuries may only be apparent few days after the insult due to delayed apoptosis [16,17]. Signal abnormalities on diffusion-weighted images may be very subtle due to the intrinsically high T2 signal of the neonatal brain. Hence, the corresponding ADC map should always be scrutinized [18,19].
- Secondly, there is often no signal abnormality on conventional T1 and T2-weighted images in the first 2-3 days [20].
- Thirdly, one should be aware of the presence of terminal zones of myelination at the peritrigonal regions. These should not be mistaken for periventricular leukomalacia [21]. A thin rim of normally myelinated T2 hypointense white matter may be seen between the ependymal surface and terminal zone of myelination, a useful clue to search for [22]. High T2 signal related to terminal zone of myelination is also almost always confined to the supero-posterior aspects of the posterior horns [23,24]. Another helpful clue is the triangular configuration of the terminal zones of myelination on coronal images, with the apex of the triangle directed superiorly [25] (Figure 3 a-c).
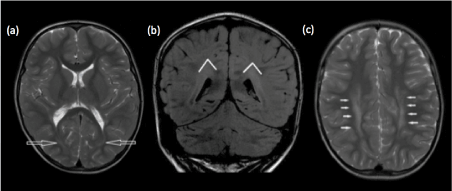
Figure 3. (a) Axial T2-weighted and (b) coronal FLAIR images show the normal terminal zone of myelination, posterior and superior to the occipital horns. Note the triangular configuration of the terminal zones of myelination on coronal image, with the apex of the triangle directed superiorly. (c) Axial T2-weighted image shows abnormal periventricular T2 hyperintense signal extending anteriorly around the bodies of the lateral ventricles, in a child with periventricular leukomalacia.
- Fourthly, one must be cognizant of factors that may affect imaging findings, such as the state of brain maturity, duration and severity of insult as well as timing of imaging studies.
- Bilateral signal abnormalities within the neonatal brain without clinical evidence of hypoxic-ischemic insult should raise the suspicion of underlying inborn errors of metabolism such as Leigh syndrome (Figure 4), Alexander disease (Figure 5) and metachromatic leukodystrophy (Figure 6).
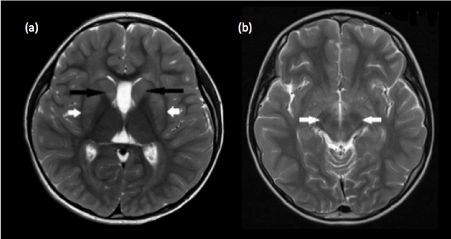
Figure 4. Leigh syndrome. (a) Bilateral signal abnormalities are seen within the putamina (white arrows) and caudate heads (black arrows) on T2-weighted axial image (b) Ill-defined abnormal T2 signal is also present within the cerebral peduncles, another common site of involvement in Leigh syndrome.
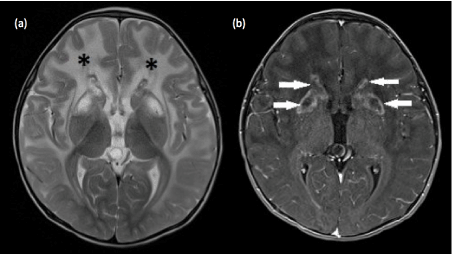
Figure 5. Alexander disease (a) Axial T2-weighted image demonstrates confluent and symmetrical signal abnormalities within the cerebral white matter, predominantly involving the frontal lobes (*) . Involvement of subcortical U-fibers is seen in the frontal lobes. Abnormal high signal is also noted within the putamen and caudate heads. (b) Axial T1-weighted post contrast image shows rim enhancement around the areas of signal abnormalities within the caudate and lentiform nuclei.
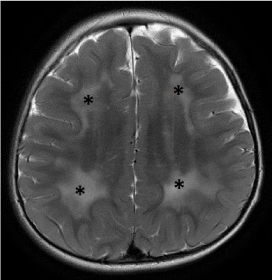
Figure 6. Metachromatic leukodystrophy. Axial T2-weighted image demonstrates confluent and symmetric signal abnormalities within the periventricular and deep white matter. Note the sparing of the subcortical U-fibers.
Benign external hydrocephalus is characterized by a rapid increase in head circumference, along with enlarged subarachnoid spaces (predominantly along the frontal convexities). The ventricles may be normal in size or mildly enlarged [26]. The increase in head circumference frequently occurs around the age of 6 months [27] and stabilizes at around 18 months [28,29,30]. It is often challenging for the reporting radiologist to define the limit between normal and enlarged subarachnoid spaces. However, a cranio-cortical width of more than 10mm is generally considered pathological [31,32]. Most believe that this condition is a result of immature arachnoid villi that are unable to keep up with the rate of CSF production [33]. Maturation of the arachnoid villi is often complete by 18 months, corresponding to the time when the increase in head circumference stabilizes. The frontal subarachnoid spaces enlargement shows reduction in size and resolves completely within 2-3 years of age [34,35].
A positive “cortical vein sign”, defined as visualization of bridging cortical veins within the enlarged subarachnoid spaces, assists the radiologist in differentiating external hydrocephalus from subdural fluid collection [37] (Figure 7,8). Cerebral atrophy with ex-vacuo ventriculomegaly can be differentiated from external hydrocephalus as there is often global enlargement of subarachnoid spaces, in contrast to frontal predominance in external hydrocephalus. There is also absence of macrocephaly. Communicating hydrocephalus will display clinical evidence of raised intracranial pressure [38] and is often associated with sulcal effacement rather than subarachnoid space enlargement (Figure 9). It is important to differentiate communicating hydrocephalus from ex-vacuo ventricular dilation as the prior may pose damage to the developing brain. The decision for therapeutic intervention is often based on the demonstration of progressive increase in ventricular dimensions on serial imaging [39]. One must be aware that there is often a small progressive increase in size of the anterior horn width in both term and preterm neonates in the first week and life and this physiological change should not be interpreted as progressive ventriculomegaly [40,41,42,43].
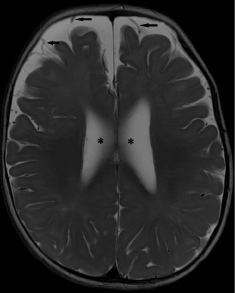
Figure 7. Benign external hydrocephalus. (a) Axial T2-weighted image shows enlargement of subarachnoid spaces along the frontal convexities and anterior interhemispheric falx. Note the presence of a positive “cortical vein sign” (black arrows). Mild ventriculomegaly is also noted (*). This child presented with macrocephaly without clinical evidence of raised intracranial pressure.
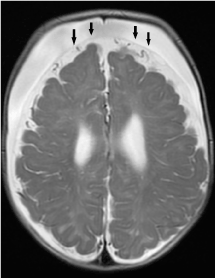
Figure 8. Bilateral subdural fluid collections with negative cortical vein sign. The cortical veins are displaced towards the cerebral surface (black arrows).
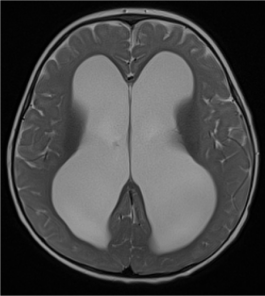
Figure 9. Axial T2-weighted image shows marked ventriculomegaly without subarachnoid space enlargement in a patient with communicating hydrocephalus. This child exhibits signs of raised intracranial pressure on physical examination.
The corpus callosum comprises of 4 main segments; the rostrum, genu, body and splenium (Figure 10). By 20 weeks, all the components of the corpus callosum are expected to be present at the midline. From then on, the corpus callosum will continue to grow in length and thickness. It will reach an adult appearance by approximately 9 to 10 months of age [44]. One should also be aware that growth of the corpus callosum is typically slower in premature infants compared to infants of the same gestational age [45].
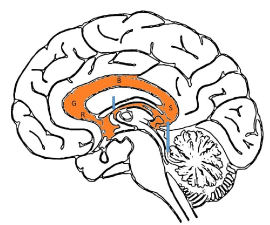
Figure 10. Four main segments of the corpus callosum; the rostrum (R), genu (G), body (B) and splenium (S). Two smaller interhemispheric commissural white matter tracts are the anterior commissure (short blue arrow) and hippocampal commissure (long blue arrow).
At birth, the corpus callosum remains uniformly thin without the normal bulbous enlargements seen at the genu and splenium of adults and older children [46] (Figure 11). This appearance should not be mistaken for hypoplasia of the corpus callosum, especially when no other intracranial abnormality is detected. Focal thinning of the corpus callosum at the junction of the body and splenium, when seen in isolation, is likely a normal variant, known as the isthmus (Figure 12). This normal variant is seen in approximately 22% of individuals [47] and should not be mistaken as focal hypoplasia. Primary complete and partial agenesis of the corpus callosum is often the result of insults occurring prior to 20 weeks of gestation. On the other hand, a complete but hypoplastic corpus callosum would denote an insult after 20 weeks of gestation (Figure 13).
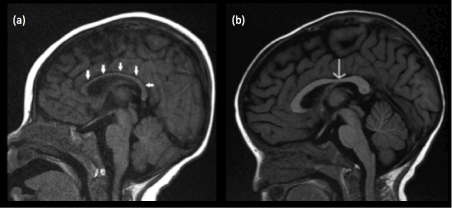
Figure 11. (a) Midline sagittal T1-weighted image of the brain of a normal 2 month old infant shows a diffusely thin corpus callosum (white arrows) which is of isointense signal to cortical grey matter (b) Midline sagittal T1-weighted image of the brain of a normal 12 month old infant shows a corpus callosum with bulbous enlargements at the genu and splenium. The corpus callosum has attained an adult appearance and is now hyperintense compared to cortical grey matter. The isthmus of the corpus callosum (thin white arrow) is seen as focal thinning between the posterior body and splenium.
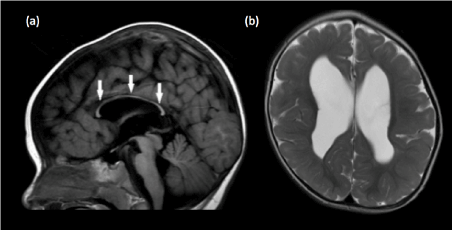
Figure 12. Diffuse corpus callosal hypoplasia in a 2-year old child (a) Sagittal T1-weighted image shows that the corpus callosum is completely formed but is diffusely thin in caliber (white arrows), with loss of the normal bulbous enlargements at the splenium and genu.(b) Axial T2-weighted image demonstrates markedly reduced extracallosal white matter volume within the bilateral cerebral hemispheres, with the cortical grey matter almost abutting the ependymal surface.
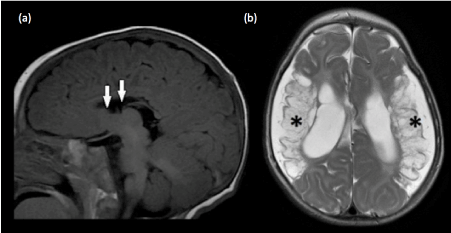
Figure 13. Secondary partial corpus callosal dysgenesis (a) Sagittal T1-weighted image shows absence of the rostrum, genu and anterior body of the corpus callosum, likely due to secondary destruction. This is derived from the knowledge that the development of the corpus callosum commence from the genu, and progresses in an anterior to posterior manner. The rostrum is the last portion to be formed. Hence, the genu of the corpus callosum is often present in cases of primary partial agenesis of the corpus callosum. (b)Axial T2-weighted image confirms the presence of encephalomalacia in the bilateral MCA territories (*) and ex-vacuo dilatation of the lateral ventricles. The absence of Probst bundles is in keeping with secondary destruction of the corpus callosum
The presence of corpus callosal dysgenesis should prompt the reporting radiologist to search for additional intracranial anomalies. Posterior fossa and sulcal-gyration abnormalities are seen most frequently in association with callosal dysgenesis [48,49]. The high incidence of sulcal-gyration abnormalities in patients with callosal dysgenesis may be explained by Van Essen’s theory of cortical folding [50]. Extracallosal white matter volume loss is also seen in patients with callosal dysgenesis, possibly related to primary dysplasia or secondary regression [51].
In primary callosal agenesis, white matter tracts that normally cross the midline to form the corpus callosum now reside along the superomedial wall of the lateral ventricles, giving rise to the callosal bundles of Probst. Therefore, the presence of Probst bundles is a strong evidence of primary callosal agenesis (Figure 14 a-c).
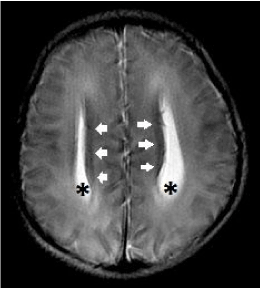
Figure 14. Complete primary agenesis of the corpus callosum. Axial T2-weighted image shows colpocephaly (*) and the presence of Probst bundles (white arrows) along the medial margins of the widely spaced lateral ventricles.
On T1-weighted images, non myelinated white matter is hypointense relative to cortical grey matter, providing a good contrast between cortical grey matter and subcortical white matter. However, between 4 to 8 months of age, gray matter and incompletely myelinated subcortical white matter are almost equal in signal intensity, resulting in blurring of the grey-white matter junction as well as pseudo-thickening of the cerebral cortex. One should not mistake this for MCD. During this period, the cortical ribbon is better depicted on T2-weighted images (Figure 15 a,b).
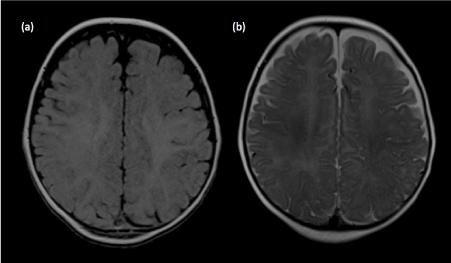
Figure 15. Pseudo-thickening of the cerebral cortex. (a) Axial T1-weighted image shows blurring of the grey-white matter junction in a 6-month old child. Between 4 to 8 months of age, gray matter and incompletely myelinated subcortical white matter are almost equal in signal intensity, resulting in blurring of the grey-white matter junction as well as pseudo-thickening of the cerebral cortex. (b) Axial T2-weighted image better delineates the grey-white matter junction in this age group.
MCD is a wide spectrum of heterogenous disorders with various imaging appearances, depending upon which stage of cortical development is interrupted. Proliferation of neuronal precursors occurs at the ventricular and subventricular zones [52]. Neuronal migration occurs between the 3rd and 5th months of gestation and movement of these migrating neurons needs to be arrested once they arrive at their appropriate laminar position. At their appropriate laminar position, these neurons will undergo cortical organization [53,54].
Microlissencephaly, hemimegalencephaly and focal cortical dysplasia (FCD) (Figure 16 a,b) are results of disturbances in neuronal proliferation [55,56]. Cortical thickening and blurred gray-white mater junction may be seen in these conditions. Differentiating FCD from low grade glioma is often a challenge. A frontal lobe location will favor FCD while low grade glioma is more commonly seen within the temporal lobe. T2 hyperintense signal seen within a low grade glioma is also often better circumscribed compared to the indistinct T2 hyperintense signal seen in FCD [57]. If the migration process is arrested, this will result in either gray matter heterotopia or Type 1 (Classic) Lissencephaly. Disruption of cortical organization on the other hand will result in either polymicrogyria (PMG) (Figure 17) or schizencephaly.
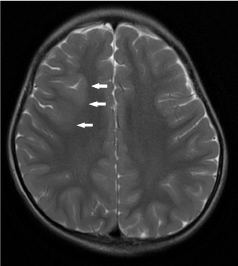
Figure 16. Right frontal focal cortical dysplasia (FCD). Axial T2-weighted image demonstrates an area of cortical thickening and blurring of grey-white matter junction (white arrows) at the right frontal lobe.
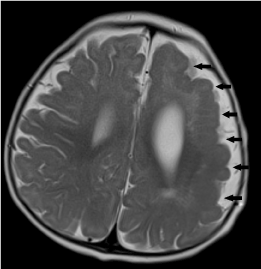
Figure 17. Left frontoparietal pachygyria-polymicrogyria. Axial T2-weighted image shows abnormal gyral-sulcation pattern and cortical thickening at the left fronto-parietal lobes. There is also blurring of the grey-white matter junction.
Cyst-like malformations of the posterior fossa encompass a wide spectrum of developmental anomalies, ranging from mega cisterna magna to classic Dandy Walker malformation.
Evaluation of the posterior fossa would include assessment of the posterior fossa volume, the morphology of the cerebellar vermis as well as the fourth ventricle and brainstem. The cerebellar vermis is divided into 3 main portions by the primary and pre-pyramidal fissures (Figure 18). The fastigium of the fourth ventricle should be sited just beneath the midpoint of the ventral pons on the sagittal plane and the posterior margin of the brainstem should be a straight line [58].
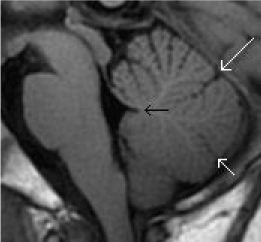
Figure 18. Normal anatomy of the cerebellar vermis and 4th ventricle. (a) Sagittal T1-weighted midline image of the posterior fossa shows the normal division of the cerebellar vermis into 3 main portions by the primary (long white arrow) and pre-pyramidal (short white arrow) fissures. The fastigium of the fourth ventricle (black arrow) should be sited just beneath the midpoint of the ventral pons on the sagittal plane.
The approach to cyst-like malformation within the posterior fossa is outlined in Figure 19. If the vermis is normal, the cyst-like malformation may be either a mega cisterna magna or persistent Blake pouch cyst. If the cystic structure does not communicate with the 4th ventricle, a diagnosis of mega cisterna magna should be made (Figure 20). Mega cisterna magna is defined as an enlarged cisterna magna which measures ≥10mm on mid sagittal plane [59,60,61]. It is postulated that mega cisterna magna is a consequent of delayed fenestration of the Blake pouch while absence of fenestration result in a Blake pouch cyst [62]. The presence of an abnormal communication with the 4th ventricle helps differentiate persistent Blake pouch cyst (Figure 21) from mega cisterna magna [63]. CSF diversion is often necessary and in the absence of shunt-related complications, the neurological outcome of Blake pouch cyst is extremely favourable.
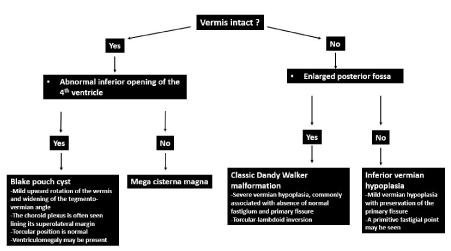
Figure 19. Approach to cyst-like malformation within the posterior fossa
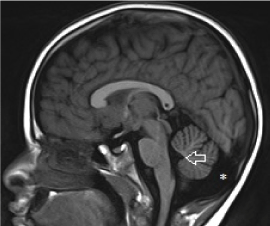
Figure 20. Mega cisterna magna. Sagittal T1-weighted midline image demonstrates a cyst-like structure within the posterior fossa with a normal vermis and 4th ventricle.
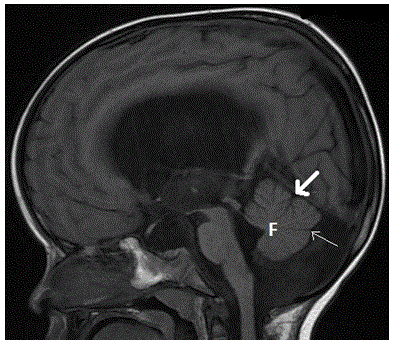
Figure 21. Persistent Blake pouch cyst. Sagittal T1-weighted midline image demonstrates a cyst-like structure within the posterior fossa with an abnormal communication with the 4th ventricle. The vermis is normal with presence of the fastigium (F), primary (thick arrow) and pre-pyramidal (thin arrow) fissures. Ventriculomegaly is noted, likely due to impaired CSF circulation.
If the cerebellar vermis is severely hypoplastic with an enlarged posterior fossa and supra-tentorial hydrocephalus, a diagnosis of classic Dandy Walker malformation can be made. The usually severely hypoplastic vermis is rotated superiorly and the torcular as well as the transverse sinuses are displaced cranially, resulting in torcular-lambdoid inversion [64]. Dandy Walker malformation usually presents in infancy with macrocephaly and signs of raised intracranial pressure. If the cerebellar vermis is only hypoplastic at its inferior aspect with a normal-sized posterior fossa and absence of hydrocephalus, inferior vermian hypoplasia is present (Figure 22). This diagnosis can only be made after 20 weeks of gestation. Before that, the growth of the inferior vermis is incomplete and may simulate inferior vermian hypoplasia [65].
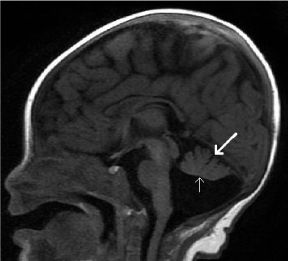
Figure 22. Inferior vermian hypoplasia. Sagittal T1-weighted midline image shows a cyst-like structure within the posterior fossa. There is incomplete lobulation of the vermis, with absence of the pre-pyramidal fissure. The vermis is rotated superiorly with widening of the tegmento-vermian angle
Accurate interpretation of MR studies of the pediatric brain is extremely challenging especially in the first 2 years of life as the appearance of a normal brain changes according to the stage of development. This article emphasizes on the changes in normal appearances, clues on how to differentiate them from true pathologies as well as their clinical significance. Several points of confusion that commonly arise in reviewing MR images of pediatric brain are outlined as well.
- Holland BA, Haas DK, Norman D, Brant-Zawadzki M, Newton TH (1986) MRI of normal brain maturation. AJNR Am J Neuroradiol 7: 201-208. [Crossref]
- Kucharczyk W, Macdonald PM, Stanisz GJ, Henkelman RM (1994) Relaxivity and magnetization transfer of white matter lipids at MR imaging: importance of cerebrosides and pH. Radiology 192: 521-529. [Crossref]
- Ruggieri PM (1997) Metabolic and neurodegenerative disorders and disorders with abnormal myelination. In: Ball WS, Ed. Pediatric Neuroradiology. Philadelphia: Lippincott-Raven.175-237
- Barkovich AJ (1998) MR of the normal neonatal brain: assessment of deep structures. AJNR Am J Neuroradiol 19: 1397-1403. [Crossref]
- Edwards AD, Brocklehurst P, Gunn AJ, Halliday H, Juszczak E, et al. (2010) Neurological outcomes at 18 months of age after moderate hypothermia for perinatal hypoxic ischaemic encephalopathy: synthesis and meta-analysis of trial data. BMJ 340: c363. [Crossref]
- Rutherford M, Ramenghi LA, Edwards AD, Brocklehurst P, Halliday H, et al. (2010) Assessment of brain tissue injury after moderate hypothermia in neonates with hypoxic-ischaemic encephalopathy: a nested substudy of a randomised controlled trial. Lancet Neurol 9: 39-45. [Crossref]
- Vannucci RC, Vannucci SJ (2005) Perinatal hypoxic-ischemic brain damage: evolution of an animal model. Dev Neurosci 27: 81-86. [Crossref]
- Izbudak I, Grant PE (2011) MR imaging of the term and preterm neonate with diffuse brain injury. Magn Reson Imaging Clin N Am 19: 709-731. [Crossref]
- Barkovich AJ (1992) MR and CT evaluation of profound neonatal and infantile asphyxia. AJNR Am J Neuroradiol 13: 959-972. [Crossref]
- Chao CP, Zaleski CG, Patton AC (2006) Neonatal hypoxic-ischemic encephalopathy: multimodality imaging findings. RadioGraphics 26: S159-S172.
- Barkovich AJ, Sargent SK (1995) Profound asphyxia in the premature infant: imaging findings. AJNR Am J Neuroradiol 16:1837-1846. [Crossref]
- McQuillen PS, Ferriero DM (2004) Selective vulnerability in the developing central nervous system. Pediatr Neurol 30:227-235. [Crossref]
- Back SA, Han BH, Luo NL, Chricton CA, Xanthoudakis S, et al. (2002) Selective vulnerability of late oligodendrocyte progenitors to hypoxia-ischemia. J Neurosci 22: 455-463. [Crossref]
- Barkovich AJ, Westmark KD, Bedi HS, Partridge JC, Ferriero DM, et al. (2001) Proton spectroscopy and diffusion imaging on the first day of life after perinatal asphyxia: preliminary report. AJNR Am J Neuroradiol 22: 1786-1794. [Crossref]
- Forbes KP, Pipe JG, Bird R (2000) Neonatal hypoxicischemic encephalopathy: detection with diffusion-weighted MR imaging. AJNR Am J Neuroradiol 21: 1490-1496. [Crossref]
- Johnston MV, Trescher WM, Ishida A, Nakajima W (2001) Neurobiology of hypoxic-ischemic injury in the developing brain. Pediatr Res 49: 735-741. [Crossref]
- McQuillen PS, Ferriero DM (2004) Selective vulnerability in the developing central nervous system. Pediatr Neurol 30:227-235. [Crossref]
- Barkovich AJ, Westmark K, Partridge C, Sola A, Ferriero DM (1995) Perinatal asphyxia: MR findings in the first 10 days. AJNR Am J Neuroradiol 16: 427-438. [Crossref]
- Barkovich AJ, Miller SP, Bartha A, Newton N, Hamrick SE, et al. (2006) MR imaging, MR spectroscopy, and diffusion tensor imaging of sequential studies in neonates with encephalopathy. AJNR Am J Neuroradiol 27: 533-547. [Crossref]
- Heinz ER, Provenzale JM (2009) Imaging findings in neonatal hypoxia: a practical review. AJR Am J Roentgenol 192: 41-47. [Crossref]
- Barkovich AJ, Kjos BO, Jackson DE Jr, Norman D (1988) Normal maturation of the neonatal and infant brain: MR imaging at 1.5 T. Radiology 166: 173-180. [Crossref]
- Baker LL, Stevenson DK, Enzmann DR (1988) End-stage periventricular leukomalacia: MR evaluation. Radiology 168: 809-815. [Crossref]
- Barkovich AJ, Mukherjee P (2011) Normal development of the neonatal and infant brain, skull, and spine. In: Barkovich AJ, Raybaud C, eds. Pediatric Neuroimaging. 5th Ed. Philadelphia: Wolters Kluwer Health/Lippincott Williams & Wilkins 20-80.
- Inder TE, Anderson NJ, Spencer C, Wells S, Volpe JJ (2003) White matter injury in the premature infant: a comparison between serial cranial sonographic and MR findings at term. AJNR Am J Neuroradiol 24: 805-809. [Crossref]
- Parazzini C, Baldoli C, Scotti G, Triulzi F (2002) Terminal zones of myelination: MR evaluation of children aged 20-40 months. AJNR Am J Neuroradiol 23: 1669-1673. [Crossref]
- Maytal J, Alvarez LA, Elkin CM, Shinnar S (1987) External hydrocephalus: radiologic spectrum and differentiation from cerebral atrophy. AJR Am J Roentgenol 148:1223-1230. [Crossref]
- Sahar A (1978) Pseudohydrocephalus–megalocephaly, increased intracranial pressure and widened subarachnoid space. Neuropadiatrie 9: 131-139. [Crossref]
- Carolan PL, McLaurin RL, Towbin RB, Towbin JA, Egelhoff JC (1985) Benign extra-axial collections of infancy. Pediatr Neurosci 12: 140-144. [Crossref]
- Alper G, Ekinci G, Yilmaz Y, Arikan C, Telyar G, et al. (1999) Magnetic resonance imaging characteristics of benign macrocephaly in children. J Child Neurol 14: 678-682
- Fessell DP, Frankel DA, Wolfson WP (2000) Sonography of extraaxial fluid in neurologically normal infants with head circumference greater than or equal to the 95th percentile for age. J Ultrasound Med 19: 443-447. [Crossref]
- Frankel DA, Fessell DP, Wolfson WP (1998) High resolution sonographic determination of the normal dimensions of the intracranial extraaxial compartment in the newborn infant. J Ultrasound Med 17:411-415. [Crossref]
- McArdle CB, Richard2021 Copyright OAT. All rights reservayden CK, et al. (1987) Developmental features of the neonatal brain: MR imaging. Part II. Ventricular size and extracerebral space. Radiology 162: 230-234. [Crossref]
- Barlow CF (1984) CSF dynamics in hydrocephalus--with special attention to external hydrocephalus. Brain Dev 6: 119-127. [Crossref]
- Muenchberger H, Assaad N, Joy P, Brunsdon R, Shores EA (2006) Idiopathic macrocephaly in the infant: long-term neurological and neuropsychological outcome. Childs Nerv Syst 22: 1242-1248. [Crossref]
- Wilms G, Vanderschueren G, Demaerel PH, Smet MH, Van CF, et al. (1993) CT and MR in infants with pericerebral collections and macrocephaly: benign enlargement of the subarachnoid spaces versus subdural collections. AJNR Am J Neuroradiol 14: 855-860. [Crossref]
- Nogueira GJ, Zaglul HF (1991) Hypodense extracerebral images on computed tomography in children. “External hydrocephalus”: a misnomer? Childs Nerv Syst 7: 336-341. [Crossref]
- Kuzma BB, Goodman JM (1998) Differentiating external hydrocephalus from chronic subdural hematoma. Surg Neurol 50: 86-88. [Crossref]
- Eide PK, Due-Tonnessen B, Helseth E, Lundar T (2002) Differences in quantitative characteristics of intracranial pressure in hydrocephalic children treated surgically or conservatively. Pediatr Neurosurg 36: 304-313. [Crossref]
- Soul JS, Eichenwald E, Walter G, Volpe JJ, du Plessis AJ (2004) CSF removal in infantile posthemorrhagic hydrocephalus results in significant improvement in cerebral hemodynamics. Pediatr Res 55: 872-876. [Crossref]
- Ichihashi K, Iino M, Eguchi Y, Uchida A, Honma Y, et al. (2002) Difference between left and right lateral ventricular sizes in neonates. Early Hum Dev 68: 55-64. [Crossref]
- Nelson MD Jr, Tavaré CJ, Petrus L, Kim P, Gilles FH (2003) Changes in the size of the lateral ventricles in the normal-term newborn following vaginal delivery. Pediatr Radiol 33: 831-835. [Crossref]
- Brann BS 4th, Qualls C, Wells L, Papile L (1991) Asymmetric growth of the lateral cerebral ventricle in infants with posthemorrhagic ventricular dilation. J Pediatr 118: 108-112. [Crossref]
- Brouwer MJ, de Vries LS, Groenendaal F, Koopman C, Pistorius LR, et al. (2012) New Reference Values for the Neonatal Cerebral Ventricles. Radiology 262: 224-233. [Crossref]
- Rakic P, Yakovlev PI (1968) Development of the corpus callosum and cavum septi in man. J Comp Neurol 132: 45-72. [Crossref]
- Anderson NG, Lauren I, Cook N, Woodward L, Inder TE (2005) Growth rate of corpus callosum in very premature infants. Am J Neuroradiol 26: 2685-2690. [Crossref]
- Barkovich AJ, Kjos BO (1988) Normal postnatal development of the corpus callosum as demonstrated by MR imaging. AJNR Am J Neuroradiol 9: 487-491. [Crossref]
- McLeod NA, Williams JP Machen B, Lum GB (1987) Normal and abnormal morphology of the corpus callosum. Neurology 37:1240-1242. [Crossref]
- Tang PH, Bartha AI, Norton ME, Barkovich AJ, Sherr EH, et al. (2009) Agenesis of the Corpus Callosum: An MR Imaging Analysis of Associated Abnormalities in the Fetus. AJNR 30: 257-263. [Crossref]
- Hetts SW, Sherr EH, Chao S, Gobuty S, Barkovich AJ (2006) Anomalies of the corpus callosum: an MR analysis of the phenotypic spectrum of associated malformations. AJR Am J Roentgenology 187: 1343-1348. [Crossref]
- Van Essen D (1997) Atension-based theory of morphogenesis and compact wiring in the central nervous system. Nature 385:313-318. [Crossref]
- Hetts SW (1998) To die or not to die: an overview of apoptosis and its role in disease. JAMA 279: 300-307. [Crossref]
- Anderson SA, Eisenstat DD, Shi L, Rubenstein JL (1997) Interneuron migration from basal forebrain to neocortex: dependence on Dlx genes. Science 278: 474-476. [Crossref]
- Barkovich AJ, Kuzniecky RI, Dobyns WB, Jackson GD, Becker LE, et al. (1996) A classification scheme for malformations of cortical development. Neuropediatrics 27: 59-63. [Crossref]
- Hansen PE, Ballesteros MC, Soila K, Garcia L, Howard JM (1993) MR imaging of the developing human brain. Radiographics 13:21-36. [Crossref]
- Barkovich AJ, Raybaud CA (2004) Neuroimaging in disorders of cortical development. Neuroimaging Clin N Am 14: 231-254, viii. [Crossref]
- Barkovich AJ, Kuzniecky RI, Jackson GD, Guerrini R, Dobyns WB (2005) A developmental and genetic classification for malformations of cortical development. Neurology 65: 1873-1887. [Crossref]
- Colombo N, Tassi L, Galli C, Citterio A, Lo Russo G (2003) Focal cortical dysplasias: MR imaging, his- topathologic, and clinical correlations in surgically treated patients with epi lepsy. AJNR Am J Neuroradiol 24: 724-733. [Crossref]
- Doherty D, Millen KJ, Barkovich AJ (2013) Midbrain and hindbrain malformations: advances in clinical diagnosis, imaging, and genetics. Lancet Neurol 12: 381-393. [Crossref]
- Tortori-Donati P, Fondelli MP, Rossi A, Carini S (1996) Cystic malformations of the posterior cranial fossa originating from a defect of the posterior membranous area: mega cisterna magna and persisting Blake’s pouch—two separate entities. Childs Nerv Syst 12: 303-308. [Crossref]
- Barkovich AJ, Kjos BO, Norman D, Edwards MS (1989) Revised classification of posterior fossa cysts and cystlike malformations based on the results of multiplanar MR imaging. AJR Am J Roentgenol 153: 1289-1300. [Crossref]
- Yildiz H, Yazici Z, Hakyemez B, Erdogan C, Parlak M (2006) Evaluation of CSF flow patterns of posterior fossa cystic malformations using CSF flow MR imaging. Neuroradiology 48: 595-605. [Crossref]
- Nelson MD Jr, Maher K, Gilles FH (2004) A different approach to cysts of the posterior fossa. Pediatr Radiol 34: 720-732. [Crossref]
- Cornips EM, Overvliet GM, Weber JW, Postma AA, Hoeberigs CM, et al. (2010) The clinical spectrum of Blake’s pouch cyst: report of six illustrative cases. Childs Nerv Syst 26: 1057-1064. [Crossref]
- Parisi MA, Dobyns WB (2003) Human malformations of the midbrain and hindbrain: review and proposed classification scheme. Mol Genet Metab 80: 36-53. [Crossref]
- Estroff JA, Scott MR, Benacerraf BR (1992) Dandy-Walker variant: prenatal sonographic features and clinical outcome. Radiology185: 755-758. [Crossref]


