Proprotein convertase subtilisin/kexin type 9 (PCSK9) genetic variants are associated with increased risk of type 2 diabetes mellitus (T2DM). Contradictory outcomes have been reported for the relationship between PCSK9 and increased diabetes risk. Furthermore, the relationship between PCSK9 levels, glycemic status, and vascular function among different ethnic groups is still not fully understood. African-Americans suffer disproportionately from many chronic diseases including T2DM due to many factors including environmental, socioeconomic and genetics factors. Thus, we aimed in this study is to examine the association between plasma PCSK9 and vascular dysfunction in African-Americans with T2DM. PCSK9 and total nitric oxide (NO) levels were measured by enzyme-linked immunosorbent assays (ELISA). Microvascular function was assessed by the vascular reactivity index (VRI) and large artery stiffness was assessed by carotid-femoral pulse wave velocity (PWV). A total of 146 participants with T2DM were enrolled in this study. Mean patients’ age was 60 ± 8 years. Eighty percent (80%) had hypertension, 90% had dyslipidemia and 15% had chronic kidney disease. Total population was categorized into two groups based on HbA1c median value (7.5%). PCSK9 levels negatively correlated with VRI but not PWV in the total population and in well controlled patients with HbA1c ≤7.5% (r=-0.175, p=0.036 and r=-0.293, p=0.010; respectively). PCSK9 levels positively correlated with total NO levels in total population and in well controlled patients (r=0.186, p=0.0024 and r=0.256, p=0.023; respectively). Univariate analysis exhibited that PCSK9 levels were associated with VRI, but not PWV, in total population and in well controlled patients (β=-0.175, p=0.036 and β=-0.293, p=0.010; respectively). Multivariable-adjusted regression analysis revealed that PCSK9 levels predicted VRI in well controlled patients (β=-0.384, p=0.033) but not in poorly controlled patients. Furthermore, changes in total NO availability did not impact the PCSK9-VRI association in well controlled diabetic patients. Larger studies are needed to confirm the association of circulating PCSK9 with subclinical microvascular changes in T2DM, particularly in patients with good glycemic control.
African Americans, cardiovascular disease, arterial stiffness, vascular reactivity, diabetes, endothelial function, PCSK9
BMI: Body mass index; Cre: Creatinine; PWV: Pulse wave velocity; VRI: Vascular reactivity index; LDL-c: Low-density lipoprotein cholesterol; HDL-c: High-density lipoprotein cholesterol; Ascvd score: Atherosclerotic cardiovascular disease score; NO: Nitric oxide; PCSK9: Proprotein convertase subtilisin/kexin type 9
T2DM results in serious microvascular and macrovascular complications that could lead to patient’s death. Patients with T2DM remain at high-risk of developing cardiovascular disease (CVD) despite the statin therapy which effectively reduces levels of low-density lipoprotein cholesterol (LDLc) with only partial reduction of CVD events in these patients [1].
African-Americans suffer disproportionately from many chronic diseases including T2DM; and the reason for this racial disparity could be attributed to many factors including environmental, socioeconomic and genetics factors [2]. Therefore, the strategies in place to prevent CVD progression particularly in patients with T2DM warrant further examination.
Proprotein convertase subtilisin/kexin type 9 (PCSK9) is a member of the proprotein convertase family of zymogens which modulates plasma levels of LDLc by promoting the degradation of LDL receptors (LDLRs), the main element for the removal of LDL from the circulation [3]. PCSK9 blocks the recycling of the LDLR leading to reduced clearance of LDLc in the circulation [4]. Experiments in tissue-specific PCSK9 knockout mice suggested that most circulating forms of PCSK9 are derived from the liver [5].
PCSK9 variants associated with reduced LDLc levels were observed with elevated fasting glucose concentration, abnormal bodyweight, waist-to-hip ratio, and increased risk of T2DM [6]. Gain-of-function mutations in PCSK9 are rare and cause an autosomal dominant form of severe hypercholesterolemia [7], and premature coronary heart disease [8]. Furthermore, mature PCSK9 has been shown to be associated with atheroma and altered vessels in heterozygous familial hypercholesterolemia patients with coronary artery disease [9]. These findings suggest that mature PCSK9 plays a crucial role in the propagation of coronary atherosclerosis in these patients [10]. In contrast, pharmacological inhibition of PCSK9 protein using monoclonal antibodies have been successful in the treatment of atherosclerosis and dyslipidemia. Results from different trials were very consistent suggesting that treatment of high-risk patients with PCSK9 inhibitors is advantageous in addition to statin therapy [11]. More importantly, treatment of diabetic patients with monoclonal anti-PCSK9 antibodies did not demonstrate any significant adverse effects [12]. Despite the tremendous discoveries of PCSK9 genetic variants associated with increased risk of T2DM, cohort studies reported conflicting results with respect to PCSK9 levels and glycemic status [6]. PCSK9 loss of function variants are associated with lower LDLc levels, higher plasma glucose and risk for T2DM [13]. Furthermore, recent study demonstrated that PCSK9-deficient mice exhibited impaired glucose tolerance and pancreatic islets abnormalities leading to decreased insulin release [5].
Hyperglycemia is associated with impaired NO availability [14]. Altered NO levels in T2DM were reported in different studies. Nevertheless, these reports were very controversial [15-17]. Although, short term inhibition of PCSK9 improved endothelial function in hypercholesterolemic subjects [18], direct relationship between circulating PCSK9 and NO availability in T2DM patients is not well established.
PCSK9 can directly or indirectly contribute to atherosclerosis progression leading to endothelial dysfunction [19]. PCSK9 is not only expressed in hepatocytes but it is also expressed in many other cells such as vascular smooth muscle cells, endothelial cells, macrophages, adipocytes, kidney, heart, brain etc. Recent studies strongly support PCSK9 direct contribution in the pathogenesis of vascular diseases [20]. However, exact mechanisms have not been yet fully elucidated. Although, recent clinical data suggest that PCSK9 inhibition could improve endothelial function by modulating vascular inflammatory response independently of action on LDLc [21], our understanding of the role of PCSK9 in vascular biology is still limited and substantial research is required to clarify how plasma PCSK9 changes could affect vascular reactivity in T2DM. Hence, in this study, we try to investigate the relationship of plasma PCSK9 levels with indices of vascular function in T2DM patients.
Study population, blood sampling and PCSK9 ELISA
A total of 146 African Americans with T2DM were enrolled in this study. Participants were recruited from the State University of New York Downstate Health Sciences University/Kings County Clinics between September 2016 and July 2017. The study protocol was approved by the Institutional Review Board of the State University of New York Downstate Health Sciences University (IRB protocol# 907067) and written informed consent was obtained from each participant. Participants were excluded from the study if, at baseline, patients are on chronic renal replacement therapy (hemodialysis, peritoneal dialysis, transplantation etc.), history of active malignancy (except those with basal cell carcinoma) within the last five years, systemic lupus erythematosis and other autoimmune diseases that may affect kidney function, history of type 1 diabetes, acute infection or fever, pregnancy, chronic viral hepatitis or HIV infection, current unstable cardiac disease, history of hypercoagulable disorders, history of blood clots in arms, weak pulses in arms indicating low brachial artery blood flow, or history of vasculitis. Standard methods and definitions were adopted: Diabetes- Subjects with history of T2DM on medication or HbA1c ≥ 6.5% or fasting glucose ≥126 mg/dL (≥7 mmol/L). Hypertension- Subjects with history of hypertension on medication. Dyslipidemia- Subjects with history of dyslipidemia on medication or fasting lipid profile with total cholesterol>200 mg/dL or LDL>70 mg/dL. CKD- Subjects with eGFR<90 mL/min using modification of diet in renal disease (MDRD) equation or proteinuria (≥2+ on urine dipstick). Fasting blood samples (12 h) were collected into EDTA-tubes and centrifuged at 4°C, 3,000 rpm for 10 min to separate the plasma. All the samples for the measurement of PCSK9 levels were stored at -80°C until analysis. Plasma levels of PCSK9 were measured in duplicate by enzyme-linked immunosorbent assay using a commercially available kit (Boster Biological Technology, Pleasanton CA, USA, Catalog # EK1147). Total Nitric oxide (NO) levels were measured by ELISA kit (My BioSource, Inc., San Diego, CA, Catalog #MBS732723).
Assessment of vascular function
Vascular reactivity (VRI) is an index of blood vessel responsiveness to stimuli which measures microvascular function using differential distal digital thermal response following proximal peripheral vascular occlusion and release (Endothelix Vendys II, Palo Alto, CA) [22]. Test was performed on each subject under ambient room temperature after an overnight 12 hour fasting consisting of abstinence from food, alcohol, tobacco, caffeine, exercise, and vasoactive medications. Subject was placed in supine position with cuff applied to both arms and baseline systolic blood pressure was obtained from non-test arm (left) after a rest interval of 30 minutes and recorded in the Vendys software. Temperature probes were placed on the palmar surface of index finger of both hands and the procedure was initiated and completed in 3 phases of 5 minutes duration generating a 15-minute curve: baseline stabilization, occlusion (cuff inflation of the test arm, right, to above 30mm Hg of systolic blood pressure baseline) and deflation phases. Testing was fully automated and outcome results were obtained from the Vendys software. The measured values of VRI which reflect endothelial function were expressed as poor reactivity: VRI<1; intermediate reactivity: 1<VRI<2; or good reactivity: VRI ≥2.
Pulse wave velocity (PWV) is a measurement of arterial stiffness of between two major arteries: carotid-femoral sites [23]. Two parameters were measured: the transit time of arterial pulse along the analyzed arterial segments and the distance on the skin between both recording sites. To obtain this measurement, subject was placed in a supine position for about 5 minutes to adjust physiologic baseline condition under ambient room temperature (22-24˚C) after which an average of 2 reading of blood pressure was obtained using automated blood pressure measurement device. The distance between carotid artery and sternal notch was subtracted from that between femoral artery and sternal notch and recorded. Actual measurement of carotid-femoral PWV (cf-PWV) was done using SphygmoCor system (ArtCor, Sydney, Australia). Pencil-shaped tonometer was placed in succession over the carotid and femoral arteries with both signals synchronized with R wave on EKG.
Statistical analyses
Statistical analyses were performed using SPSS software version 24 (IBM Corp., Armonk, NY-USA). Patients were stratified into 2 groups based on the median value of HbA1c in the entire population (HbA1c ≤ 7.5% vs. HbA1c>7.5%). Continuous variables were presented as means ± SD or medians (interquartile ranges), and comparisons between groups were performed by using Mann-Whitney U test/Wilcoxon rank-sum test. Categorical variables were presented as frequencies and percentages, and comparisons between groups were performed by using Pearson’s chi-square or Fisher’s exact test. PCSK9 distribution in the general population was skewed. Therefore, log transformed data was used to determine associations between PCSK9 levels and other variables. Univariate and multiregression analysis were conducted to determine possible associations between plasma PCSK9 and other variables. Multiple linear regression analysis was performed to evaluate the association between plasma PCSK9 levels and vascular outcome, using three models for covariates assessment (Model I: sex and age as independent variables), (Model II: sex, age, weight, hypertension, stroke, dyslipidemia, smoking and creatinine levels), and (Model III: sex, age, weight, hypertension, stroke, smoking, creatinine, total cholesterol, LDLc, HDLc, triglycerides, HbA1c, duration of diabetes and NO). All estimated β-coefficients were accompanied by approximate 95% confidence limits. Two-sided tests with P-values<0.05 were considered statistically significant.
Clinical and biochemical characteristics of study population and plasma PCSK9 distribution
The baseline of clinical and biochemical characteristics of study subjects are shown in Table 1. Patients population was divided in two groups based on HbA1c median value in the population (HbA1c ≤7.5%, N=79 vs. HbA1c >7.5%, N=67). Mean patient age was 60.1±7.9 years (female 64%). Eighty percent (80%) had hypertension, 90% had dyslipidemia and 15% had chronic kidney disease. Mean HbA1c levels were 8.1%±2.2% (median HbA1c=7.5%). Among all the variables, systolic blood pressure, HbA1c levels, duration of diabetes, and total NO levels were significantly elevated in poorly controlled group of participants (p< 0.0001) (Table 1). PWV and VRI were both increased in patients with HbA1c ≤7.5% (p=0.022 and p=0.011, respectively) (Table 1). PCSK9 levels were significantly reduced in patients with HbA1c ≤7.5% (p=0.012) (Table 1). Furthermore, plasma levels of PCSK9 varied by almost 100-fold range among the participants in this cohort (10ng/ml to 1110 ng/ml) (Figure 1). The distribution of PCSK9 levels was right-skewed with a median value of 233 ng/ml in the total population (Figure 1A). Median value of PCSK9 was higher in patients with HbA1c levels ≤7.5% (264ng/ml) than in patients with HbA1c>7.5% (214 ng/ml) (Figures 1B and 1C).
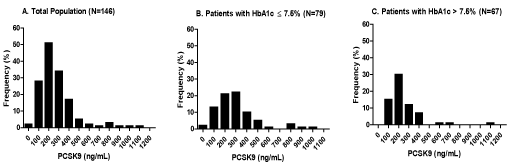
Figure 1. Distribution of plasma PCSK9 levels in the total population and stratified groups based on HbA1c median value
Table 1. Baseline characteristics of the total population and stratified groups based on HbA1c median value
Baseline Characteristics |
Total Population
(N=146) |
Patients with HbA1c ≤ 7.5 %
(N=79) |
Patients with HbA1c > 7.5 %
(N=67) |
p-Value |
Age (years)
Mean (SD) |
60.1 ± 7.9 |
60.5 ± 8.0 |
59.5 ± 7.7 |
0.822 |
Weight (kg)
Mean (SD) |
85.1 ± 20.7 |
85.4 ± 17.2 |
84.8 ± 24.3 |
0.554 |
Height (cm)
Mean (SD) |
164.3 ± 21.4 |
165.8 ± 9.9 |
162.6 ± 29.8 |
0.366 |
Waist Circumference (cm)
Mean (SD) |
96.0 ± 23.1 |
94.8 ± 26.2 |
97.5 ± 18.8 |
0.240 |
Systolic BP (mmHg)
Mean (SD) |
134.1 ± 18.7 |
130.5 ± 18.3 |
138.4 ± 18.5 |
0.0001 |
Diastolic BP (mmHg)
Mean (SD) |
75.9 ± 10.9 |
75.8 ± 10.1 |
76.2 ± 11.9 |
0.652 |
HbA1c (%)
Mean (SD) |
8.1 ± 2.1 |
6.7 ± 0.5 |
9.8 ± 1.9 |
0.0001 |
Diabetes duration (year)
Mean (SD) |
10.3 ± 7.6 |
7.7 ± 5.5 |
13.6 ± 8.5 |
0.0001 |
Total Cholesterol (mg/dL)
Mean (SD) |
173.9 ± 42.0 |
171.8 ± 36.8 |
176.6 ± 47.7 |
0.868 |
LDL-c (mg/dL)
Mean (SD) |
96.6 ± 36.4 |
98.8 ± 36.8 |
96.5 ± 36.1 |
0.757 |
HDL-c (mg/dL)
Mean (SD) |
54.9 ± 17.7 |
56.0 ± 18.3 |
53.5 ± 16.9 |
0.309 |
Triglycerides (mg/dL)
Mean (SD) |
112.7 ± 55.4 |
109.5 ± 57.9 |
116.6 ± 52.3 |
0.214 |
ASCVD
Median (IQR) |
19.5 (12.5, 28.9) |
18.7 (10.3, 28.6) |
20.1 (14.1, 29.7) |
0.094 |
Pulse Waive Velocity (m/s)
Median (IQR) |
8.2 (6.7, 10.3) |
8.0 (6.3, 9.5) |
8.7 (7.0, 10.8) |
0.022 |
Vascular Reactivity Index
Median (IQR) |
1.1 (0.9, 1.5) |
1.0 (0.8, 1.3) |
1.2 (1.0, 1.6) |
0.011 |
PCSK9 (ng/mL)
Median (IQR) |
233.2 (162.5, 318.2) |
264.0 (186.5, 376.0) |
213.9 (151.9, 285.5) |
0.012 |
Nitric Oxide (µmol/L)
Median (IQR) |
20.1 (16.3, 30.9) |
18.8 (16.2, 25.3) |
24.8 (17.9, 35.4) |
0.005 |
Insulin, n (%)
Sulfonylurea, n (%)
Metformin, n(%)
DPP-4 inhibitors, n (%)
GLP-1 agonists, n (%)
SGLT2 inhibitors, n (%)
Thiazolidinediones, n (%)
Meglitinide, n (%)
Calcium channel blockers, n (%)
ACE inhibitors, n (%)
Beta blockers, n (%)
Diuretics, n (%)
Nitrates, n (%)
Anti-platelets, n (%)
Statins, n (%) |
35 (27.7)
26 (20.6)
87 (68.4)
42 (32.9)
1 (0.6)
1 (0.6)
22 (17.4)
3 (2.6)
37 (29.0)
41 (32.3)
27 (21.3)
31 (24.5)
7 (5.2)
35 (27.1)
68 (53.5) |
17 (24.1)
11 (16.5)
54 (77.2)
19 (27.8)
1 (1.3)
8 (11.4)
8 (11.4)
3 (3.8)
26 (36.7)
23 (32.9)
11 (16.5)
18 (25.3)
2 (2.5)
20 (29.1)
36 (51.9) |
19 (34.3)
16 (28.4)
37 (65.7)
1 (1.8)
8 (14.9)
1 (1.5)
8 (14.9)
1 (1.5)
14 (23.9)
19 (34.3)
17 (29.9)
15 (26.9)
5 (9.0)
15 (26.9)
35 (61.2) |
0.452
0.470
0.605
0.239
0.980
0.850
0.999
0.777
0.883
0.925
0.436
0.579
0.773
0.343
0.176 |
For continuous variables data are presented as mean ± SD or median (25%-75% IQR), and as frequencies (percentages) for categorical variables.
Due to missing data, analysis of medication was performed on 128 patients (total population), 70 patients (HbA1c≤7.5%) and 57 patients (HbA1c>7.5%). Abbreviations: ASCVD: Pooled cohort score; BP: Blood pressure; LDL: Low-density lipoprotein; HDL: High-density lipoprotein; PCSK9: Proprotein convertase subtilisin/kexin type 9; SD; Standard deviation; IQR: Interquartile ranges. P values < 0.05 were considered statistically significant.
Correlations between plasma PCSK9 levels and clinical variables
In total population, plasma concentrations of PCSK9 were positively correlated with dyslipidemia and HDLc levels (r=0.200, p=0.022 and r=0.198, p=0.018; respectively) (Table 2) and negatively correlated with sex and VRI (r=-0.175, p=0.034 and r=-0.175, p=0.036; respectively) (Table 2). There was no significant correlation between plasma PCSK9 levels and LDLc nor total cholesterol in all the groups (Tables 2). In patients with HbA1c≤7.5%, plasma concentrations of PCSK9 levels were negatively correlated with VRI (r=-0.293, p=0.010) (Table 2) and positively correlated with dyslipidemia (r=0.331, p=0.005) (Table 2). In patients with HbA1c>7.5%, plasma concentrations of PCSK9 were positively correlated with HDLc (r=0.279, p=0.025) (Table 2). To further examine the effect of sex differences, we compared plasma PCSK9 levels in women and in men groups (Table 3). Plasma levels of PCSK9 positively correlated with HDLc and negatively correlated with total NO levels in women but not in men (r=0.222, p=0.034 and r=-0.235, p=0.022; respectively) (Table 3).
Table 2. Correlations between plasma PCSK9 levels and clinical variables in total population and categorized groups based on HbA1c levels
Variables |
Total Population |
Patients with HbA1c ≤ 7.5% |
Patients with HbA1c > 7.5% |
R |
p-Value |
R |
p-Value |
R |
p-Value |
Age |
0.041 |
0.624 |
0.073 |
0.523 |
-0.032 |
0.799 |
Sex |
-0.175 |
0.034a |
-0.138 |
0.227 |
-0.226 |
0.066 |
BMI |
0.005 |
0.952 |
0.110 |
0.332 |
-0.130 |
0.294 |
PWV |
0.021 |
0.807 |
0.146 |
0.207 |
-0.070 |
0.578 |
VRI |
-0.175 |
0.036a |
-0.293 |
0.010b |
0.047 |
0.707 |
Creatinine |
-0.007 |
0.939 |
0.050 |
0.688 |
-0.031 |
0.812 |
Total Cholesterol |
0.091 |
0.282 |
0.191 |
0.096 |
0.003 |
0.981 |
LDL-c |
0.052 |
0.535 |
0.154 |
0.182 |
-0.100 |
0.428 |
HDL-c |
0.198 |
0.018a |
0.136 |
0.239 |
0.279 |
0.025a |
Triglycerides |
0.028 |
0.737 |
0.153 |
0.182 |
-0.152 |
0.230 |
Ascvdscore |
-0.047 |
0.575 |
0.042 |
0.715 |
-0.162 |
0.196 |
Diabetes duration |
-0.027 |
0.771 |
0.061 |
0.623 |
0.054 |
0.701 |
Total NO |
-0.186 |
0.024a |
-0.256 |
0.023a |
-0.216 |
0.079 |
Hypertension |
0.088 |
0.319 |
0.149 |
0.220 |
0.049 |
0.705 |
Stroke |
0.077 |
0.413 |
0.087 |
0.502 |
0.073 |
0.602 |
Dyslipidemia |
0.200 |
0.022a |
0.331 |
0.005b |
0.034 |
0.792 |
Smoking |
0.057 |
0.496 |
0.127 |
0.271 |
-0.058 |
0.643 |
Results are expressed as R, Pearson correlation coefficient and (p-Value) for 2-tailed significance: a: p < 0.05; and b: p < 0.001. Abbreviations: BMI: Body mass index; Cre: creatinine; PWV: Pulse wave velocity; VRI: Vascular reactivity index; LDL-c: Low-Density lipoprotein cholesterol; HDL-c: High-density lipoprotein cholesterol; Ascvd score: Atherosclerotic cardiovascular disease score: NO: Nitric oxide. P values < 0.05 were considered statistically significant.
Association between plasma PCSK9 and total NO levels
In total population and in patients with HbA1c≤7.5%, plasma concentrations of PCSK9 were negatively correlated with total NO levels (r=-0.186, p=0.024 and r=-0.256, p=0.023; respectively) (Table 2). Furthermore, PCSK9 levels significantly correlated with NO levels in diabetic women but not in men (r=-0.235, p=0.022) (Table 3).
Table 3. Sex influence on correlation of plasma PCSK9 levels with metabolic and anthropometric variables and vascular outcome in African Americans diabetic patients
Variables |
Diabetic Women (N=94) |
Diabetic Men (N=52) |
R |
p-Value |
R |
p-Value |
Age |
0.141 |
0.176 |
-0.137 |
0.334 |
BMI |
0.064 |
0.538 |
0.077 |
0.588 |
PWV |
0.069 |
0.518 |
-0.169 |
0.235 |
VRI |
-0.174 |
0.098 |
-0.255 |
0.071 |
Cre |
0.078 |
0.493 |
0.012 |
0.937 |
Total Cholesterol |
0.119 |
0.261 |
-0.043 |
0.765 |
LDL-c |
0.100 |
0.344 |
-0.052 |
0.719 |
HDL-c |
0.222 |
0.034a |
-0.063 |
0.662 |
Triglycerides |
0.114 |
0.283 |
-0.107 |
0.455 |
Ascvdscore |
0.062 |
0.560 |
0.012 |
0.934 |
Diabetes duration |
-0.074 |
0.519 |
0.150 |
0.344 |
Total NO |
-0.235 |
0.022a |
-0.100 |
0.479 |
Hypertension |
0.126 |
0.259 |
0.079 |
0.590 |
Stroke |
0.098 |
0.419 |
0.182 |
0.227 |
Dyslipidemia |
0.214 |
0.053 |
0.275 |
0.056 |
Smoking |
0.093 |
0.377 |
0.254 |
0.069 |
Results are expressed as R, Pearson correlation coefficient and (p-Value) for 2-tailed significance: a, p < 0.05.
Univariable linear regression analysis between plasma PCSK9 levels and vascular outcome
Univariate analysis showed that plasma concentrations of PCSK9 levels were significantly correlated with VRI in total population (β=-0.175, p=0.036) (Table 4) and in patients with HbA1c≤7.5% (β=-0.293, p =0.010) (Table 4), but not in patients with HbA1c >7.5% (β=0.047, p =0.707) (Table 4).
Table 4. Univariate analysis of association between plasma PCSK9 levels and VRI in African Americans diabetic patients
Variable |
Total Population |
HbA1c ≤ 7.5 % |
HbA1c > 7.5 % |
Standardized
β coefficient |
95% CI |
p-Value |
Standardized
β coefficient |
95% CI |
p-Value |
Standardized
β coefficient |
95% CI |
p-Value |
PCSK9 |
-0.175 |
-0.331 0.157 |
0.036 |
-0.293 |
-0.923 -0.131 |
0.010 |
0.047 |
-0.410 0.601 |
0.707 |
VRI dependent variable. Data are expressed as regression coefficient beta and 95% confidence intervals (CI) with minimal and maximal range. P values < 0.05 were considered statistically significant.
Multivariable linear regression analysis between plasma PCSK9 levels and vascular outcome
Multiregression analysis revealed that plasma PCSK9 levels were independently associated with VRI in total population as well as in patients with HbA1c≤7.5% after adjustment to sex and age variables in base Model I (β=-0.195, p=0.023 and β=-0.324, p=0.005, respectively) (Table 5). This association remained significant in patients with HbA1c≤7.5% after adjusting base model with additional variables such as weight, hypertension, stroke, dyslipidemia, smoking and creatinine (β=-0.346, p=0.033; Model II) (Table 5). In total population, the association between PCSK9 levels and VRI was completely lost in Model III due to effects of confounding factors such as total cholesterol, LDLc, HbA1c, and total NO levels (Model III) (Table 5). In contrast, association between PCSK9 levels and VRI remained significant in the group of patients with HbA1c≤7.5% after even adjusting the base model with all additional variables (β=-0.378, p=0.046; Model III) (Table 5). In contrast to total population and in poorly controlled patients (HbA1c≤7.5%), total cholesterol, LDLc, and total NO levels have no effect on the association between PCSK9 levels and VRI in well controlled patients (HbA1c≤7.5%) (Model III) (Table 5).
Table 5. Multiregression analysis of the association between plasma PCSK9 levels and VRI outcome in african americans diabetic patients
Variables |
Total Population (N=146) |
HbA1c ≤ 7.5% (N=79) |
HbA1c > 7.5% (N=68) |
Model I (R Square=0.045) |
Model I (R Square =0.126) |
Model I (R Square =0.002) |
β 95% CI P
Min Max |
β 95% CI P
Min Max |
β 95% CI P |
PCSK9 |
-0.195 |
-0.686 |
-0.051 |
0.023 |
-0.324 |
-0.984 |
-0.183 |
0.005 |
0.049 |
-0.429 |
0.629 |
0.707 |
Sex |
-0.105 |
-0.288 |
0.068 |
0.223 |
-0.193 |
-0.456 |
0.032 |
0.087 |
0.011 |
-0.251 |
0.272 |
0.934 |
Age |
-0.049 |
-0.014 |
0.008 |
0.562 |
-0.057 |
-0.018 |
0.011 |
0.605 |
-0.012 |
-0.017 |
0.015 |
0.926 |
|
Model II (R Square =0.095) |
Model II (R Square =0.214) |
Model II (R Square =0.101) |
β 95% CI P
Min Max |
β 95% CI P
Min Max |
β 95% CI P
Min Max |
PCSK9 |
-0.212 |
-0.775 |
-0.006 |
0.047 |
-0.353 |
-1.097 |
-0.066 |
0.028 |
-0.024 |
-0.687 |
0.595 |
0.885 |
Sex |
-0.045 |
-0.352 |
0.260 |
0.766 |
-0.337 |
-0.869 |
0.204 |
0.218 |
0.005 |
-0.425 |
0.434 |
0.982 |
Age |
-0.126 |
-0.023 |
0.006 |
0.247 |
-0.155 |
-0.029 |
0.009 |
0.291 |
-0.035 |
-0.028 |
0.023 |
0.852 |
Weight |
-0.240 |
-0.012 |
-0.001 |
0.033 |
-0.180 |
-0.013 |
0.004 |
0.253 |
-0.310 |
-0.016 |
0.001 |
0.095 |
Hypertension |
0.068 |
-0.010 |
0.017 |
0.602 |
-0.055 |
-0.015 |
0.020 |
0.772 |
0.238 |
-0.010 |
0.036 |
0.267 |
Stroke |
-0.039 |
-0.097 |
0.065 |
0.697 |
-0.126 |
-0.159 |
0.059 |
0.357 |
0.014 |
-0.116 |
0.127 |
0.930 |
Dyslipidemia |
-0.018 |
-0.298 |
0.251 |
0.866 |
-0.050 |
-0.403 |
0.294 |
0.755 |
-0.035 |
-0.622 |
0.496 |
0.820 |
Smoking |
0.010 |
-0.238 |
0.259 |
0.933 |
0.167 |
-0.207 |
0.554 |
0.363 |
-0.037 |
-0.407 |
0.325 |
0.821 |
Creatinine |
0.057 |
-0.180 |
0.303 |
0.616 |
0.193 |
-0.248 |
0.749 |
0.318 |
-0.009 |
-0.288 |
0.304 |
0.956 |
|
Model III (R Square =0.274) |
Model III (R Square =0.225) |
Model III (R Square =0.416) |
β 95% CI Min Max P |
β 95% CI Min Max P |
β 95% CI Min Max P |
PCSK9 |
-0.236 |
-0.870 |
-0.028 |
0.037 |
-0.384 |
-1.210 |
-0.055 |
0.033 |
-0.039 |
-1.064 |
0.887 |
0.852 |
Sex |
0.003 |
-0.363 |
0.369 |
0.988 |
-0.425 |
-1.217 |
0.318 |
0.242 |
0.196 |
-0.411 |
0.829 |
0.492 |
Age |
-0.118 |
-0.026 |
0.009 |
0.337 |
-0.146 |
-0.037 |
0.016 |
0.423 |
-0.271 |
-0.055 |
0.017 |
0.290 |
Weight |
-0.053 |
-0.009 |
0.006 |
0.672 |
-0.218 |
-0.020 |
0.007 |
0.339 |
-0.036 |
-0.015 |
0.013 |
0.885 |
Hypertension |
0.022 |
-0.013 |
0.016 |
0.870 |
-0.100 |
-0.018 |
0.028 |
0.667 |
-0.101 |
-0.026 |
0.038 |
0.689 |
Stroke |
-0.096 |
-0.122 |
0.048 |
0.392 |
-0.178 |
-0.209 |
0.071 |
0.322 |
-0.043 |
-0.150 |
0.120 |
0.816 |
Smoking |
0.036 |
-0.267 |
0.351 |
0.786 |
0.246 |
-0.324 |
0.883 |
0.353 |
-0.057 |
-0.577 |
0.441 |
0.784 |
Creatinine |
-0.064 |
-0.384 |
0.234 |
0.631 |
0.110 |
-0.560 |
0.883 |
0.652 |
-0.191 |
-0.593 |
0.228 |
0.365 |
Total Cholesterol |
1.545 |
0.003 |
0.038 |
0.024 |
5.334 |
-0.368 |
0.527 |
0.720 |
2.525 |
0.003 |
0.055 |
0.031 |
LDL-c |
-1.309 |
-0.040 |
-0.002 |
0.031 |
-4.598 |
-0.528 |
0.370 |
0.721 |
-2.151 |
-0.060 |
-0.002 |
0.037 |
HDL-c |
-0.518 |
-0.037 |
0.003 |
0.103 |
-2.597 |
-0.528 |
0.373 |
0.729 |
-0.763 |
-0.058 |
0.006 |
0.110 |
Triglycerides |
-0.393 |
-0.010 |
0.001 |
0.079 |
-1.393 |
-0.105 |
0.075 |
0.731 |
-0.591 |
-0.017 |
0.002 |
0.131 |
Diabetes Duration |
0.074 |
-0.012 |
0.022 |
0.555 |
0.151 |
-0.031 |
0.063 |
0.487 |
0.233 |
-0.016 |
0.043 |
0.353 |
HbA1c |
0.263 |
0.008 |
0.128 |
0.028 |
0.090 |
-0.315 |
0.527 |
0.611 |
0.273 |
-0.033 |
0.177 |
0.168 |
Total NO |
-0.319 |
-0.007 |
-0.001 |
0.007 |
-0.075 |
-0.027 |
0.018 |
0.703 |
-0.458 |
-0.008 |
0.000 |
0.039 |
|
|
|
|
|
|
|
|
|
|
|
|
|
Dependent variable: VRI; R Square: proportion of variance between variables in linear regression model. Linear regression was performed using 3 separates models (I, II, III) using various variables as discussed in Results section. Data are expressed as regression coefficient beta and 95% CI (confidence intervals) with Min-Max range (minimal and maximal values). P values < 0.05 were considered statistically significant.
Effects of medication use on the association between plasma PCSK9 levels and vascular outcome
Regression analysis revealed that none of the drugs used by the patients affected the association between PCSK9 levels and VRI in patients with HbA1c≤7.5% (Table 6). In contrast, potential confounding factors such as calcium channel blockers and antiplatelet medication were found to be associated with outcome analysis in the total population and patients with HbA1c≤7.5% which may explain the lack of association of PCSK9 with VRI in poorly controlled patients (Table 6).
Table 6. Medication influence of association between plasma PCSK9 levels and VRI outcome in African Americans diabetic patients
Variables |
Total Population (N=146) |
HbA1c ≤ 7.5% (N=79) |
HbA1c > 7.5% (N=68) |
Model (R Square=0.149)
β 95% CI Min Max P |
Model (R Square=0.177)
β 95% CI Min Max P |
Model (R Square=0.426)
β 95% CI Min Max P |
PCSK9 |
-0.201 |
-0.719 |
-0.036 |
0.030 |
-0.309 |
-0.994 |
-0.078 |
0.023 |
0.016 |
-0.528 |
0.595 |
0.905 |
Insulin |
-0.042 |
-0.247 |
0.155 |
0.652 |
-0.140 |
-0.484 |
0.158 |
0.314 |
0.060 |
-0.193 |
0.313 |
0.634 |
Metformin |
-0.048 |
-0.348 |
0.218 |
0.650 |
0.049 |
-0.410 |
0.559 |
0.759 |
-0.063 |
-0.424 |
0.276 |
0.673 |
DDP4 inhibitors |
-0.011 |
-0.203 |
0.180 |
0.906 |
0.051 |
-0.231 |
0.344 |
0.697 |
-0.274 |
-0.550 |
0.008 |
0.057 |
GLP-1 agonists |
-0.058 |
-1.350 |
0.684 |
0.518 |
-0.053 |
-1.317 |
0.858 |
0.674 |
N.D |
N.D |
N.D |
N.D |
Meglitinide |
0.086 |
-0.296 |
0.801 |
0.364 |
0.135 |
-0.415 |
1.103 |
0.368 |
0.132 |
-0.555 |
1.540 |
0.348 |
Calcium Channel Blockers |
0.207 |
0.018 |
0.428 |
0.034 |
0.096 |
-0.197 |
0.399 |
0.499 |
0.388 |
0.115 |
0.733 |
0.008 |
ACE inhibitors |
-0.031 |
-0.227 |
0.161 |
0.737 |
-0.072 |
-0.371 |
0.217 |
0.601 |
0.049 |
-0.198 |
0.298 |
0.689 |
Beta blockers |
-0.015 |
-0.276 |
0.240 |
0.890 |
0.079 |
-0.288 |
0.499 |
0.594 |
-0.190 |
-0.563 |
0.172 |
0.289 |
Diuretics |
-0.151 |
-.0394 |
0.053 |
0.134 |
-0.168 |
-0.534 |
0.151 |
0.267 |
-0.031 |
-0.374 |
0.307 |
0.844 |
Nitrates |
0.164 |
-0.043 |
0.734 |
0.081 |
0.106 |
-0.493 |
1.149 |
0.427 |
0.189 |
-0.140 |
0.743 |
0.176 |
Anti-platelets |
-0.118 |
-0.338 |
0.078 |
0.219 |
-0.003 |
-0.302 |
0.295 |
0.981 |
-0.281 |
-0.592 |
-0.002 |
0.048 |
Statins |
0.035 |
-0.171 |
0.245 |
0.724 |
0.117 |
-0.164 |
0.409 |
0.394 |
-0.044 |
-0.378 |
0.282 |
0.771 |
VRI was used as dependent variable; R Square: proportion of variance between variables in linear regression model. Data are expressed as regression coefficient beta and 95% CI (confidence intervals) with Min-Max range (minimal & maximal values). N.D: not determined. P values < 0.05 were considered statistically significant
The present study aimed to test the hypothesis that circulating PCSK9 levels may be related to vascular dysfunction in patients with T2DM. It is well established that PCSK9 levels correlate with cardiovascular risks [24]. The associations of PCSK9 with indices of vascular function have been investigated in different populations [9,25]. However, little is known about relationship between PCSK9 changes and markers of vascular function such as PWV, c-IMT and VRI in diabetic population. Furthermore, association between PCSK9 and diabetes can be influenced by racial background [26]. To the best of our knowledge, this is the first investigation addressing the relationship between circulating PCSK9 and vascular dysfunction in African-American patients with T2DM. In this study, plasma concentrations of PCSK9 were widely variable among patient’s population (range of ∼100-fold). Some patients had barely detectable concentrations (≤10 ng/ml), whereas others had greater values about 5-fold the median value in total population. This variation could be due to genetic background and disparities in this community-based cohort of African Americans. Significant variations in plasma PCSK9 concentrations have been previously observed in many other studies including healthy populations [26]. Studies suggested that differences in the removal efficiency of various lipoproteins could also contribute to the variability in plasma levels of PCSK9 among individuals [26]. Unexpectedly, in this study we found that plasma PCSK9 levels were reduced in poorly controlled patients as compared to well controlled patients. This finding could be partially explained by number of medications that could influence levels of plasma PCSK9 [27-29]. Several studies reported elevation of PCSK9 levels in diabetic patients [17,30]. However, a recent study showed a significant relationship of low plasma PCSK9 levels with insulin resistance, diabetes, metabolic syndrome, and obesity [31]. Among all demographic and metabolic variables in this cohort, factors such as sex, total NO, dyslipidemia and HDLc were found to be modestly correlated with plasma PCSK9 levels, but not LDLc. The lack of correlation between plasma PCSK9 and LDLc levels in our study is consistent with previous studies reporting no or modest correlations between circulating levels of PCSK9 and LDLc in diabetic patients [32,33]. On the other hand, the positive correlation between plasma PCSK9 and HDLc in total population and poorly controlled-patients is somewhat intriguing. Available literature data showed that PCSK9 levels were correlated with small dense HDL particles in poor suboptimally-controlled T1DM, but not in patients with good glycemic control [34]. A Similar positive relationship between PCSK9 and intermediate and small HDLc subfractions was observed in CVD patients [35]. Furthermore, our study revealed that the observed modest correlation between plasma PCSK9 and HDLc was mainly attributable to sex difference. PCSK9 levels positively correlated with HDLc in women but not in men. The explanation for this sex difference is unknown. However, many studies suggested hormonal differences since estrogen modulates HDL synthesis and LDL production via distinct mechanisms [36]. The strength of the observed correlations in this study appears to be weak/relatively modest from statistical point of view. However, several other studies demonstrated similar magnitude of associations [37].
Diabetic micro- and macro vascular complications seem to be strongly interconnected. However, it is not clear yet whether both microvascular and macrovascular complications do progress simultaneously, or if one could develop before the other during early stages of disease progression. PWV correlated negatively with VRI in total population and in the poorly controlled patients with HbA1c>7.5% (r=-0.192, p=0.022 and r=-0.293, p=0.018; respectively, data not shown). Remarkably, we found that plasma PCSK9 levels correlated with VRI (microvascular function) but not PWV (arterial stiffness). This was unexpected finding, and to our knowledge has not been shown previously. We hypothesize that remodeling of arterial components wall in small and large arteries that occurs during T2DM may pathophysiologically differ, and changes in circulating PCSK9 may not necessarily translate into dysfunctional accelerated arterial stiffness in T2DM. This finding may indicate that early signs of diabetic vascular dysfunction are more likely to occur in the microvasculature rather than in large arteries. Our results are in good agreement with recent study reporting lack of correlation between plasma levels of PCSK9 and arterial stiffness [38]. In contrast, previous studies have indicated that PCSK9 levels were positively associated with predictors of cardiovascular risk, such as central hemodynamics and c-IMT [9,25]. However, these studies included either healthy population, nondiabetics subjects or newly diagnosed T2DM, familial combined hyperlipidemia, heterozygous familial hypercholesterolemia or low-risk obese and non-obese patients, which could explain to some extend the discrepancy with our current study [9,25,39]. Another major finding in our study is that plasma PCSK9 levels independently predicted VRI in well controlled patients but not in poorly controlled patients even after adjusting for potential confounding variables. This finding is in good agreement with other studies reporting high prevalence of early microvascular dysfunction in T2DM patients free for any known cardiovascular diseases [40,41].
It is generally well accepted that hyperglycemia contribute to early vascular dysfunction in the progression of T2DM and even before the diagnosis of diabetes [42]. Although, the median of diabetes duration in our patients’ sample is about 10 years, the chronology of occurrence of vascular complications could not be determined in this study, and hence the underlying mechanism (s) by which changes of circulating plasma PCSK9 could impact VRI, but not PWV, cannot be established.
NO levels can be beneficial or harmful depending on its concentration. Altered NO levels in diabetes has been reported by several studies; however, results were conflicting [43]. Some studies reported increased NO levels in diabetes patients [15,44], whereas others reported the opposite [45-47]. Furthermore, studies have demonstrated significant racial differences in NO-mediated vascular dysfunction among various ethnicities [43,48]. These changes were mainly attributed to impairment of NOS activity due to chronic glycemia, and consequently leading to accelerated diabetic complications and comorbidities. NO bioavailability can decrease due to decline in NO production which could be associated to reduced e-NOS expression or its activity. In this study, we found a significant correlation between NO levels and PCSK9 levels particularly in women but not in men. This could be partially explained by differences in whole body NO production that could contribute to sex differences in vascular function and predisposition to arterial disease [49]. Additional studies focusing on sex‐specific PCSK9 therapies are needed to better understand possible implication of sexual dimorphisms in the mechanisms of diabetic microvascular dysfunction. To better clarify the PASK9-VRI association, we attempted to assess the influence of NO levels. Although, NO levels were negatively correlated with PCSK9 levels in well controlled patients, multiregression analysis revealed that physiological change in NO bioavailability in well controlled patients had no effect on the association between PCSK9 levels and microvascular function. These results suggest that other possible NO-independent mechanisms might play important role in this association through other possible mediators including reactive oxygen species and free radicals.
Statins were shown to be very effective in reducing LDLc and CVD. However, statins also raise levels of PCSK9, which in turn reduces the LDLc response to statin therapy [50]. In this study, we did not detect any significant differences in PCSK9 levels and vascular outcome in statin-treated patients as compared to non-statin group. Interestingly, the results of this current study revealed that none of the drugs taken by patients influenced the association between plasma PCSK9 levels and VRI, particularly in well controlled patients (HbA1c≤7.5%). In contrast, in total population and in poorly controlled patients (HbA1c>7.5%), calcium channel blockers and antiplatelets drugs were identified as potential confounders accounting for ~15% and ~43% variance in the base models, respectively.
Although we believe that these findings shed light on the PCSK9 association with indices of vascular function in T2DM without drawing any conclusion regarding causality, important limitations of this study should be acknowledged. First, it is a cross-sectional study of diverse T2DM population of African Americans which do not include a matching healthy control group. The stratification of cohort in two comparative groups based on HbA1c levels (well controlled patients versus poorly controlled patients) offered a better comparative study and valid analysis outcome. Second this cross-sectional study of a relatively small sample size cohort from a single center which may have limited the power to detect correlations between variables; however, the sample size was sufficient to detect significant association between plasma PCSK9 and VRI. Third, we did not exclude patients under lipid lowering medication which may have biased the prognostic values of PCSK9 levels. Our study showed no effect of statin use in this cohort. Lastly, subjects were recruited from multi-ethnic community-based African-Americans population which may have influenced data outcome. It is not clear whether these results could be generalizable in other ethnic cohorts. We are aware that differences in race and genetic background could account for discrepancies among studies, and therefore this may limit clarification of causality between circulating plasma PCSK9 and VRI.
In conclusion, our study revealed that PCSK9 independently predicted VRI, but not PWV, particularly in diabetic patients with good glycemic control (HbA1c≤7.5%). This finding suggests that optimal achieved glycemic control and reduced levels of circulating PCSK9 may reduce the burden of diabetes and mitigate its deleterious impact on the vasculature function. Additionally, total NO availability in well controlled diabetic patients appears to not significantly influence the association between PCSK9 levels and VRI, suggesting that other possible NO-independent mechanisms might play a role in the impairment of microvascular function, particularly in well controlled diabetic patients. These results are worthy of further investigations and must be confirmed in larger sample size to explore possible pathophysiological mechanisms and prognostic implications.
We thank Mrs. Lorraine Thomas for her excellent technical assistance and all study participants from SUNY Downstate and Kings County Clinics. Part of this work has been presented at the American Diabetes Association 78th Scientific Sessions (ADA18). Drs. Ayobami Eluwole, Ajibola Adedayo, Fasika Tedla and Arye Kremer were clinical research fellows under the ECRIP program.
Author contributions
All authors have read and agree to the published version of the manuscript. Conceptualization, PD and MS; Data curation, AB; Formal analysis, CR and AB; Funding acquisition, MS; Investigation, AE, AA, FT, AK, MK, LS, JL and AB; Methodology, AE, AA, PD, MS, JL and AB; Project administration, NM; Resources, MS; Software, MS, LS and JL; Supervision, CB, JL and AB; Validation, AB; Visualization, AB; Writing – original draft, AB; Writing – review & editing, AA, FT, JL, MB, MAB, CB, MS, JL and AB.
The authors declared no conflict of interests with respect to the research, authorship, and/or publication of this article.
This research was funded by The New York State Department of Health Empire Clinical Research Investigator Program award (ECRIP, 2015-2016; PI: Dr. Moro Salifu) to the State University of New York Downstate Medical Center, University Hospital of Brooklyn.
- Shepherd J, Barter P, Carmena R (2006) Effect of lowering LDL cholesterol substantially below currently recommended levels in patients with coronary heart disease and diabetes: The Treating to New Targets (TNT) study. Diabetes Care 29: 1220-1226. [Crossref]
- Spears EC, Foster MJ, Bonner TJ (2018) Diabetes prevention for African-Americans: a scoping review. J Racial Ethn Health Disparities 5: 947-965. [Crossref]
- Grant PJ (2017) PCSK9 inhibitors- A new age in lipid management? Diab Vasc Dis Res 14: 171.
- Cariou B, Le May C, Costet P (2011) Clinical aspects of PCSK9. Atherosclerosis 216: 258-265. [Crossref]
- Da Dalt L, Ruscica M, Bonacina F (2019) PCSK9 deficiency reduces insulin secretion and promotes glucose intolerance: the role of the low-density lipoprotein receptor. Eur Heart J 40: 357-368. [Crossref]
- Schmidt AF, Swerdlow DI, Holmes MV (2017) PCSK9 genetic variants and risk of type 2 diabetes: a mendelian randomisation study. Lancet Diabetes Endocrinol 5: 97-105
- Hamamdzic D, Wilensky RL (2013) Porcine models of accelerated coronary atherosclerosis: role of diabetes mellitus and hypercholesterolemia. J Diabetes Res 2013: 761415.
- Bonnefond A, Yengo L, Le May C (2015) The loss-of-function PCSK9 p.R46L genetic variant does not alter glucose homeostasis. Diabetologia 58: 2051-2055. [Crossref]
- Vlachopoulos C, Koutagiar I, Terentes-Printzios D (2018) Relationship of PCSK9 levels with indices of vascular function and subclinical atherosclerosis in patients with familial dyslipidemias. Hellenic J Cardiol.
- Kataoka Y, Harada-Shiba M, Nakao K (2017) Mature proprotein convertase subtilisin/kexin type 9, coronary atheroma burden, and vessel remodeling in heterozygous familial hypercholesterolemia. J Clin Lipidol 11: 413-421 e413. [Crossref]
- Wong ND, Shapiro MD (2019) Interpreting the findings from the recent PCSK9 monoclonal antibody cardiovascular outcomes trials. Front Cardiovasc Med 6: 14.
- Scicali R, Di Pino A, Ferrara V (2018) New treatment options for lipid-lowering therapy in subjects with type 2 diabetes. Acta Diabetol 55: 209-218.
- Cohen JC, Boerwinkle E, Mosley TH Jr., Hobbs HH (2006) Sequence variations in PCSK9, low LDL, and protection against coronary heart disease. N Engl J Med 354: 1264-1272. [Crossref]
- Avogaro A, Albiero M, Menegazzo L, de Kreutzenberg S, Fadini GP, et al. (2011) Endothelial dysfunction in diabetes: the role of reparatory mechanisms. Diabetes Care 34: S285-S290.
- Ozcelik O, Algul S (2017) Nitric oxide levels in response to the patients with different stage of diabetes. Cell Mol Biol (Noisy-le-grand) 63: 49-52.
- Maejima K, Nakano S, Himeno M (2001) Increased basal levels of plasma nitric oxide in Type 2 diabetic subjects. Relationship to microvascular complications. J Diabetes Complications 15: 135-143. [Crossref]
- Levenson AE, Shah AS, Khoury PR (2017) Obesity and type 2 diabetes are associated with elevated PCSK9 levels in young women. Pediatr Diabetes 18: 755-760.
- Maulucci G, Cipriani F, Russo D (2018) Improved endothelial function after short-term therapy with evolocumab. J Clin Lipidol 12: 669-673.
- Tang Y, Li SL, Hu JH, Sun KJ, Liu LL, et al. (2020) Research progress on alternative non-classical mechanisms of PCSK9 in atherosclerosis in patients with and without diabetes. Cardiovasc Diabetol 19: 33.
- Guo Y, Yan B, Gui Y (2020) Physiology and role of PCSK9 in vascular disease: Potential impact of localized PCSK9 in vascular wall. J Cell Physiol.
- Leucker TM, Gerstenblith G, Schar M (2020) Evolocumab, a PCSK9-monoclonal antibody, rapidly reverses coronary artery endothelial dysfunction in people living with HIV and people with dyslipidemia. J Am Heart Assoc 9: e016263. [Crossref]
- Torrado J, Bia D, Zocalo Y, Farro I, Farro F, et al. (2012) Hyperemia-related changes in arterial stiffness: comparison between pulse wave velocity and stiffness index in the vascular reactivity assessment. Int J Vasc Med: 490742. [Crossref]
- Weber T, Ammer M, Rammer M (2009) Noninvasive determination of carotid-femoral pulse wave velocity depends critically on assessment of travel distance: a comparison with invasive measurement. J Hypertens 27: 1624-1630.
- Cao YX, Jin JL, Sun D (2019) Circulating PCSK9 and cardiovascular events in FH patients with standard lipid-lowering therapy. J Transl Med 17: 367. [Crossref]
- Toth S, Fedacko J, Pekarova T (2017) Elevated circulating PCSK9 concentrations predict subclinical atherosclerotic changes in low risk obese and non-obese patients. Cardiol Ther 6: 281-289.
- Lakoski SG, Lagace TA, Cohen JC, Horton JD, Hobbs HH, et al. (2009) Genetic and metabolic determinants of plasma PCSK9 levels. J Clin Endocrinol Metab 94: 2537-2543. [Crossref]
- Chao TH, Chen IC, Li YH, Lee PT, Tseng SY, et al. (2016) Plasma levels of proprotein convertase subtilisin/kexin type 9 are elevated in patients with peripheral artery disease and associated with metabolic disorders and dysfunction in circulating progenitor cells. J Am Heart Assoc 5(5).
- Chen IC, Tseng WK, Li YH, Tseng SY, Liu PY, et al. (2017) Effect of cilostazol on plasma levels of proprotein convertase subtilisin/kexin type 9. Oncotarget 8: 108042-108053. [Crossref]
- Khera AV, Qamar A, Reilly MP, Dunbar RL, Rader DJ, et al. (2015) Effects of niacin, statin, and fenofibrate on circulating proprotein convertase subtilisin/kexin type 9 levels in patients with dyslipidemia. Am J Cardiol 115: 178-182.
- Levenson AE, Wadwa RP, Shah AS (2017) PCSK9 is increased in youth with type 1 diabetes. Diabetes Care 40: e85-e87. [Crossref]
- Caselli C, Del Turco S, Ragusa R (2019) Association of PCSK9 plasma levels with metabolic patterns and coronary atherosclerosis in patients with stable angina. Cardiovasc Diabetol 18: 144.
- Zhang Z, Wei TF, Zhao B, et al. (2019) Sex differences associated with circulating PCSK9 in patients presenting with acute myocardial infarction. Sci Rep 9: 3113. [Crossref]
- Desai NR, Giugliano RP, Wasserman SM (2017) Association between circulating baseline proprotein convertase subtilisin kexin type 9 levels and efficacy of evolocumab. JAMA Cardiol 2: 556-560.
- Bojanin D, Vekic J, Milenkovic T (2019) Association between proprotein convertase subtilisin/kexin 9 (PCSK9) and lipoprotein subclasses in children with type 1 diabetes mellitus: Effects of glycemic control. Atherosclerosis 280: 14-20. [Crossref]
- Xu RX, Li S, Zhang Y (2014) Relation of plasma PCSK9 levels to lipoprotein subfractions in patients with stable coronary artery disease. Lipids Health Dis 13: 188.
- Ghosh M, Galman C, Rudling M, Angelin B (2015) Influence of physiological changes in endogenous estrogen on circulating PCSK9 and LDL cholesterol. J Lipid Res 56: 463-469. [Crossref]
- Nozue T, Hattori H, Ogawa K (2016) Correlation between serum levels of proprotein convertase subtilisin/kexin type 9 (PCSK9) and atherogenic lipoproteins in patients with coronary artery disease. Lipids Health Dis 15: 165.
- Han J, Wang X, Ye P (2017) Plasma PCSK9 levels are unrelated to arterial stiffness in a community-based, 4.8-year prospective study. J Hum Hypertens 31: 720-724.
- Ruscica M, Ferri N, Fogacci F (2017) Circulating levels of proprotein convertase subtilisin/kexin type 9 and arterial stiffness in a large population sample: Data from the Brisighella heart study. J Am Heart Assoc 6. [Crossref]
- von Scholten BJ, Hasbak P, Christensen TE (2016) Cardiac (82) Rb PET/CT for fast and non-invasive assessment of microvascular function and structure in asymptomatic patients with type 2 diabetes. Diabetologia 59: 371-378. [Crossref]
- Mohammedi K, Woodward M, Marre M (2017) Comparative effects of microvascular and macrovascular disease on the risk of major outcomes in patients with type 2 diabetes. Cardiovasc Diabetol 16: 95.
- Climie RE, van Sloten TT, Bruno RM (2019) Macrovasculature and microvasculature at the crossroads between type 2 diabetes mellitus and hypertension. Hypertension 73: 1138-1149. [Crossref]
- Assmann TS, Brondani LA, Boucas AP (2016) Nitric oxide levels in patients with diabetes mellitus: A systematic review and meta-analysis. Nitric Oxide 61: 1-9.
- Schneider MP, Ott C, Schmidt S, Kistner I, Friedrich S, et al. (2013) Poor glycemic control is related to increased nitric oxide activity within the renal circulation of patients with type 2 diabetes. Diabetes Care 36: 4071-4075. [Crossref]
- Tessari P, Cecchet D, Cosma A (2010) Nitric oxide synthesis is reduced in subjects with type 2 diabetes and nephropathy. Diabetes 59: 2152-2159. [Crossref]
- Krause M, Rodrigues-Krause J, O'Hagan C (2012) Differential nitric oxide levels in the blood and skeletal muscle of type 2 diabetic subjects may be consequence of adiposity: a preliminary study. Metabolism 61: 1528-1537. [Crossref]
- Shiekh GA, Ayub T, Khan SN, Dar R, Andrabi KI, et al. (2011) Reduced nitrate level in individuals with hypertension and diabetes. J Cardiovasc Dis Res 2: 172-176.
- Mata-Greenwood E, Chen DB (2008) Racial differences in nitric oxide-dependent vasorelaxation. Reprod Sci 15: 9-25. [Crossref]
- Sader MA, Celermajer DS (2002) Endothelial function, vascular reactivity and gender differences in the cardiovascular system. Cardiovasc Res 53: 597-604.
- Taylor BA, Thompson PD (2016) Statins and their effect on PCSK9-impact and clinical relevance. Curr Atheroscler Rep 18: 46. [Crossref]
Editorial Information
Editor-in-Chief
Terry Lichtor
Tsuyoshi Hirata
Shinya Mizuno
Giacomo Corrado
Article Type
Research Article
Publication history
Received: November 04, 2020
Accepted: November 24, 2020
Published: November 27, 2020
Copyright
©2020 Eluwole A. This is an open-access article distributed under the terms of the Creative Commons Attribution License, which permits unrestricted use, distribution, and reproduction in any medium, provided the original author and source are credited.
Citation
Ayobami Eluwole, Ajibola Adedayo, Fasika Tedla, Arye Kremer, Nicole Mastrogiovanni, Muhammad Khan, et al. (2020) Plasma PCSK9 predicts microvascular function but not arterial stiffness in African-Americans with well controlled type 2 diabetes 7: DOI: 10.15761/JTS.1000433.
Figure 1. Distribution of plasma PCSK9 levels in the total population and stratified groups based on HbA1c median value
Table 1. Baseline characteristics of the total population and stratified groups based on HbA1c median value
Baseline Characteristics |
Total Population
(N=146) |
Patients with HbA1c ≤ 7.5 %
(N=79) |
Patients with HbA1c > 7.5 %
(N=67) |
p-Value |
Age (years)
Mean (SD) |
60.1 ± 7.9 |
60.5 ± 8.0 |
59.5 ± 7.7 |
0.822 |
Weight (kg)
Mean (SD) |
85.1 ± 20.7 |
85.4 ± 17.2 |
84.8 ± 24.3 |
0.554 |
Height (cm)
Mean (SD) |
164.3 ± 21.4 |
165.8 ± 9.9 |
162.6 ± 29.8 |
0.366 |
Waist Circumference (cm)
Mean (SD) |
96.0 ± 23.1 |
94.8 ± 26.2 |
97.5 ± 18.8 |
0.240 |
Systolic BP (mmHg)
Mean (SD) |
134.1 ± 18.7 |
130.5 ± 18.3 |
138.4 ± 18.5 |
0.0001 |
Diastolic BP (mmHg)
Mean (SD) |
75.9 ± 10.9 |
75.8 ± 10.1 |
76.2 ± 11.9 |
0.652 |
HbA1c (%)
Mean (SD) |
8.1 ± 2.1 |
6.7 ± 0.5 |
9.8 ± 1.9 |
0.0001 |
Diabetes duration (year)
Mean (SD) |
10.3 ± 7.6 |
7.7 ± 5.5 |
13.6 ± 8.5 |
0.0001 |
Total Cholesterol (mg/dL)
Mean (SD) |
173.9 ± 42.0 |
171.8 ± 36.8 |
176.6 ± 47.7 |
0.868 |
LDL-c (mg/dL)
Mean (SD) |
96.6 ± 36.4 |
98.8 ± 36.8 |
96.5 ± 36.1 |
0.757 |
HDL-c (mg/dL)
Mean (SD) |
54.9 ± 17.7 |
56.0 ± 18.3 |
53.5 ± 16.9 |
0.309 |
Triglycerides (mg/dL)
Mean (SD) |
112.7 ± 55.4 |
109.5 ± 57.9 |
116.6 ± 52.3 |
0.214 |
ASCVD
Median (IQR) |
19.5 (12.5, 28.9) |
18.7 (10.3, 28.6) |
20.1 (14.1, 29.7) |
0.094 |
Pulse Waive Velocity (m/s)
Median (IQR) |
8.2 (6.7, 10.3) |
8.0 (6.3, 9.5) |
8.7 (7.0, 10.8) |
0.022 |
Vascular Reactivity Index
Median (IQR) |
1.1 (0.9, 1.5) |
1.0 (0.8, 1.3) |
1.2 (1.0, 1.6) |
0.011 |
PCSK9 (ng/mL)
Median (IQR) |
233.2 (162.5, 318.2) |
264.0 (186.5, 376.0) |
213.9 (151.9, 285.5) |
0.012 |
Nitric Oxide (µmol/L)
Median (IQR) |
20.1 (16.3, 30.9) |
18.8 (16.2, 25.3) |
24.8 (17.9, 35.4) |
0.005 |
Insulin, n (%)
Sulfonylurea, n (%)
Metformin, n(%)
DPP-4 inhibitors, n (%)
GLP-1 agonists, n (%)
SGLT2 inhibitors, n (%)
Thiazolidinediones, n (%)
Meglitinide, n (%)
Calcium channel blockers, n (%)
ACE inhibitors, n (%)
Beta blockers, n (%)
Diuretics, n (%)
Nitrates, n (%)
Anti-platelets, n (%)
Statins, n (%) |
35 (27.7)
26 (20.6)
87 (68.4)
42 (32.9)
1 (0.6)
1 (0.6)
22 (17.4)
3 (2.6)
37 (29.0)
41 (32.3)
27 (21.3)
31 (24.5)
7 (5.2)
35 (27.1)
68 (53.5) |
17 (24.1)
11 (16.5)
54 (77.2)
19 (27.8)
1 (1.3)
8 (11.4)
8 (11.4)
3 (3.8)
26 (36.7)
23 (32.9)
11 (16.5)
18 (25.3)
2 (2.5)
20 (29.1)
36 (51.9) |
19 (34.3)
16 (28.4)
37 (65.7)
1 (1.8)
8 (14.9)
1 (1.5)
8 (14.9)
1 (1.5)
14 (23.9)
19 (34.3)
17 (29.9)
15 (26.9)
5 (9.0)
15 (26.9)
35 (61.2) |
0.452
0.470
0.605
0.239
0.980
0.850
0.999
0.777
0.883
0.925
0.436
0.579
0.773
0.343
0.176 |
For continuous variables data are presented as mean ± SD or median (25%-75% IQR), and as frequencies (percentages) for categorical variables.
Due to missing data, analysis of medication was performed on 128 patients (total population), 70 patients (HbA1c≤7.5%) and 57 patients (HbA1c>7.5%). Abbreviations: ASCVD: Pooled cohort score; BP: Blood pressure; LDL: Low-density lipoprotein; HDL: High-density lipoprotein; PCSK9: Proprotein convertase subtilisin/kexin type 9; SD; Standard deviation; IQR: Interquartile ranges. P values < 0.05 were considered statistically significant.
Table 2. Correlations between plasma PCSK9 levels and clinical variables in total population and categorized groups based on HbA1c levels
Variables |
Total Population |
Patients with HbA1c ≤ 7.5% |
Patients with HbA1c > 7.5% |
R |
p-Value |
R |
p-Value |
R |
p-Value |
Age |
0.041 |
0.624 |
0.073 |
0.523 |
-0.032 |
0.799 |
Sex |
-0.175 |
0.034a |
-0.138 |
0.227 |
-0.226 |
0.066 |
BMI |
0.005 |
0.952 |
0.110 |
0.332 |
-0.130 |
0.294 |
PWV |
0.021 |
0.807 |
0.146 |
0.207 |
-0.070 |
0.578 |
VRI |
-0.175 |
0.036a |
-0.293 |
0.010b |
0.047 |
0.707 |
Creatinine |
-0.007 |
0.939 |
0.050 |
0.688 |
-0.031 |
0.812 |
Total Cholesterol |
0.091 |
0.282 |
0.191 |
0.096 |
0.003 |
0.981 |
LDL-c |
0.052 |
0.535 |
0.154 |
0.182 |
-0.100 |
0.428 |
HDL-c |
0.198 |
0.018a |
0.136 |
0.239 |
0.279 |
0.025a |
Triglycerides |
0.028 |
0.737 |
0.153 |
0.182 |
-0.152 |
0.230 |
Ascvdscore |
-0.047 |
0.575 |
0.042 |
0.715 |
-0.162 |
0.196 |
Diabetes duration |
-0.027 |
0.771 |
0.061 |
0.623 |
0.054 |
0.701 |
Total NO |
-0.186 |
0.024a |
-0.256 |
0.023a |
-0.216 |
0.079 |
Hypertension |
0.088 |
0.319 |
0.149 |
0.220 |
0.049 |
0.705 |
Stroke |
0.077 |
0.413 |
0.087 |
0.502 |
0.073 |
0.602 |
Dyslipidemia |
0.200 |
0.022a |
0.331 |
0.005b |
0.034 |
0.792 |
Smoking |
0.057 |
0.496 |
0.127 |
0.271 |
-0.058 |
0.643 |
Results are expressed as R, Pearson correlation coefficient and (p-Value) for 2-tailed significance: a: p < 0.05; and b: p < 0.001. Abbreviations: BMI: Body mass index; Cre: creatinine; PWV: Pulse wave velocity; VRI: Vascular reactivity index; LDL-c: Low-Density lipoprotein cholesterol; HDL-c: High-density lipoprotein cholesterol; Ascvd score: Atherosclerotic cardiovascular disease score: NO: Nitric oxide. P values < 0.05 were considered statistically significant.
Table 3. Sex influence on correlation of plasma PCSK9 levels with metabolic and anthropometric variables and vascular outcome in African Americans diabetic patients
Variables |
Diabetic Women (N=94) |
Diabetic Men (N=52) |
R |
p-Value |
R |
p-Value |
Age |
0.141 |
0.176 |
-0.137 |
0.334 |
BMI |
0.064 |
0.538 |
0.077 |
0.588 |
PWV |
0.069 |
0.518 |
-0.169 |
0.235 |
VRI |
-0.174 |
0.098 |
-0.255 |
0.071 |
Cre |
0.078 |
0.493 |
0.012 |
0.937 |
Total Cholesterol |
0.119 |
0.261 |
-0.043 |
0.765 |
LDL-c |
0.100 |
0.344 |
-0.052 |
0.719 |
HDL-c |
0.222 |
0.034a |
-0.063 |
0.662 |
Triglycerides |
0.114 |
0.283 |
-0.107 |
0.455 |
Ascvdscore |
0.062 |
0.560 |
0.012 |
0.934 |
Diabetes duration |
-0.074 |
0.519 |
0.150 |
0.344 |
Total NO |
-0.235 |
0.022a |
-0.100 |
0.479 |
Hypertension |
0.126 |
0.259 |
0.079 |
0.590 |
Stroke |
0.098 |
0.419 |
0.182 |
0.227 |
Dyslipidemia |
0.214 |
0.053 |
0.275 |
0.056 |
Smoking |
0.093 |
0.377 |
0.254 |
0.069 |
Results are expressed as R, Pearson correlation coefficient and (p-Value) for 2-tailed significance: a, p < 0.05.
Table 4. Univariate analysis of association between plasma PCSK9 levels and VRI in African Americans diabetic patients
Variable |
Total Population |
HbA1c ≤ 7.5 % |
HbA1c > 7.5 % |
Standardized
β coefficient |
95% CI |
p-Value |
Standardized
β coefficient |
95% CI |
p-Value |
Standardized
β coefficient |
95% CI |
p-Value |
PCSK9 |
-0.175 |
-0.331 0.157 |
0.036 |
-0.293 |
-0.923 -0.131 |
0.010 |
0.047 |
-0.410 0.601 |
0.707 |
VRI dependent variable. Data are expressed as regression coefficient beta and 95% confidence intervals (CI) with minimal and maximal range. P values < 0.05 were considered statistically significant.
Table 5. Multiregression analysis of the association between plasma PCSK9 levels and VRI outcome in african americans diabetic patients
Variables |
Total Population (N=146) |
HbA1c ≤ 7.5% (N=79) |
HbA1c > 7.5% (N=68) |
Model I (R Square=0.045) |
Model I (R Square =0.126) |
Model I (R Square =0.002) |
β 95% CI P
Min Max |
β 95% CI P
Min Max |
β 95% CI P |
PCSK9 |
-0.195 |
-0.686 |
-0.051 |
0.023 |
-0.324 |
-0.984 |
-0.183 |
0.005 |
0.049 |
-0.429 |
0.629 |
0.707 |
Sex |
-0.105 |
-0.288 |
0.068 |
0.223 |
-0.193 |
-0.456 |
0.032 |
0.087 |
0.011 |
-0.251 |
0.272 |
0.934 |
Age |
-0.049 |
-0.014 |
0.008 |
0.562 |
-0.057 |
-0.018 |
0.011 |
0.605 |
-0.012 |
-0.017 |
0.015 |
0.926 |
|
Model II (R Square =0.095) |
Model II (R Square =0.214) |
Model II (R Square =0.101) |
β 95% CI P
Min Max |
β 95% CI P
Min Max |
β 95% CI P
Min Max |
PCSK9 |
-0.212 |
-0.775 |
-0.006 |
0.047 |
-0.353 |
-1.097 |
-0.066 |
0.028 |
-0.024 |
-0.687 |
0.595 |
0.885 |
Sex |
-0.045 |
-0.352 |
0.260 |
0.766 |
-0.337 |
-0.869 |
0.204 |
0.218 |
0.005 |
-0.425 |
0.434 |
0.982 |
Age |
-0.126 |
-0.023 |
0.006 |
0.247 |
-0.155 |
-0.029 |
0.009 |
0.291 |
-0.035 |
-0.028 |
0.023 |
0.852 |
Weight |
-0.240 |
-0.012 |
-0.001 |
0.033 |
-0.180 |
-0.013 |
0.004 |
0.253 |
-0.310 |
-0.016 |
0.001 |
0.095 |
Hypertension |
0.068 |
-0.010 |
0.017 |
0.602 |
-0.055 |
-0.015 |
0.020 |
0.772 |
0.238 |
-0.010 |
0.036 |
0.267 |
Stroke |
-0.039 |
-0.097 |
0.065 |
0.697 |
-0.126 |
-0.159 |
0.059 |
0.357 |
0.014 |
-0.116 |
0.127 |
0.930 |
Dyslipidemia |
-0.018 |
-0.298 |
0.251 |
0.866 |
-0.050 |
-0.403 |
0.294 |
0.755 |
-0.035 |
-0.622 |
0.496 |
0.820 |
Smoking |
0.010 |
-0.238 |
0.259 |
0.933 |
0.167 |
-0.207 |
0.554 |
0.363 |
-0.037 |
-0.407 |
0.325 |
0.821 |
Creatinine |
0.057 |
-0.180 |
0.303 |
0.616 |
0.193 |
-0.248 |
0.749 |
0.318 |
-0.009 |
-0.288 |
0.304 |
0.956 |
|
Model III (R Square =0.274) |
Model III (R Square =0.225) |
Model III (R Square =0.416) |
β 95% CI Min Max P |
β 95% CI Min Max P |
β 95% CI Min Max P |
PCSK9 |
-0.236 |
-0.870 |
-0.028 |
0.037 |
-0.384 |
-1.210 |
-0.055 |
0.033 |
-0.039 |
-1.064 |
0.887 |
0.852 |
Sex |
0.003 |
-0.363 |
0.369 |
0.988 |
-0.425 |
-1.217 |
0.318 |
0.242 |
0.196 |
-0.411 |
0.829 |
0.492 |
Age |
-0.118 |
-0.026 |
0.009 |
0.337 |
-0.146 |
-0.037 |
0.016 |
0.423 |
-0.271 |
-0.055 |
0.017 |
0.290 |
Weight |
-0.053 |
-0.009 |
0.006 |
0.672 |
-0.218 |
-0.020 |
0.007 |
0.339 |
-0.036 |
-0.015 |
0.013 |
0.885 |
Hypertension |
0.022 |
-0.013 |
0.016 |
0.870 |
-0.100 |
-0.018 |
0.028 |
0.667 |
-0.101 |
-0.026 |
0.038 |
0.689 |
Stroke |
-0.096 |
-0.122 |
0.048 |
0.392 |
-0.178 |
-0.209 |
0.071 |
0.322 |
-0.043 |
-0.150 |
0.120 |
0.816 |
Smoking |
0.036 |
-0.267 |
0.351 |
0.786 |
0.246 |
-0.324 |
0.883 |
0.353 |
-0.057 |
-0.577 |
0.441 |
0.784 |
Creatinine |
-0.064 |
-0.384 |
0.234 |
0.631 |
0.110 |
-0.560 |
0.883 |
0.652 |
-0.191 |
-0.593 |
0.228 |
0.365 |
Total Cholesterol |
1.545 |
0.003 |
0.038 |
0.024 |
5.334 |
-0.368 |
0.527 |
0.720 |
2.525 |
0.003 |
0.055 |
0.031 |
LDL-c |
-1.309 |
-0.040 |
-0.002 |
0.031 |
-4.598 |
-0.528 |
0.370 |
0.721 |
-2.151 |
-0.060 |
-0.002 |
0.037 |
HDL-c |
-0.518 |
-0.037 |
0.003 |
0.103 |
-2.597 |
-0.528 |
0.373 |
0.729 |
-0.763 |
-0.058 |
0.006 |
0.110 |
Triglycerides |
-0.393 |
-0.010 |
0.001 |
0.079 |
-1.393 |
-0.105 |
0.075 |
0.731 |
-0.591 |
-0.017 |
0.002 |
0.131 |
Diabetes Duration |
0.074 |
-0.012 |
0.022 |
0.555 |
0.151 |
-0.031 |
0.063 |
0.487 |
0.233 |
-0.016 |
0.043 |
0.353 |
HbA1c |
0.263 |
0.008 |
0.128 |
0.028 |
0.090 |
-0.315 |
0.527 |
0.611 |
0.273 |
-0.033 |
0.177 |
0.168 |
Total NO |
-0.319 |
-0.007 |
-0.001 |
0.007 |
-0.075 |
-0.027 |
0.018 |
0.703 |
-0.458 |
-0.008 |
0.000 |
0.039 |
|
|
|
|
|
|
|
|
|
|
|
|
|
Dependent variable: VRI; R Square: proportion of variance between variables in linear regression model. Linear regression was performed using 3 separates models (I, II, III) using various variables as discussed in Results section. Data are expressed as regression coefficient beta and 95% CI (confidence intervals) with Min-Max range (minimal and maximal values). P values < 0.05 were considered statistically significant.
Table 6. Medication influence of association between plasma PCSK9 levels and VRI outcome in African Americans diabetic patients
Variables |
Total Population (N=146) |
HbA1c ≤ 7.5% (N=79) |
HbA1c > 7.5% (N=68) |
Model (R Square=0.149)
β 95% CI Min Max P |
Model (R Square=0.177)
β 95% CI Min Max P |
Model (R Square=0.426)
β 95% CI Min Max P |
PCSK9 |
-0.201 |
-0.719 |
-0.036 |
0.030 |
-0.309 |
-0.994 |
-0.078 |
0.023 |
0.016 |
-0.528 |
0.595 |
0.905 |
Insulin |
-0.042 |
-0.247 |
0.155 |
0.652 |
-0.140 |
-0.484 |
0.158 |
0.314 |
0.060 |
-0.193 |
0.313 |
0.634 |
Metformin |
-0.048 |
-0.348 |
0.218 |
0.650 |
0.049 |
-0.410 |
0.559 |
0.759 |
-0.063 |
-0.424 |
0.276 |
0.673 |
DDP4 inhibitors |
-0.011 |
-0.203 |
0.180 |
0.906 |
0.051 |
-0.231 |
0.344 |
0.697 |
-0.274 |
-0.550 |
0.008 |
0.057 |
GLP-1 agonists |
-0.058 |
-1.350 |
0.684 |
0.518 |
-0.053 |
-1.317 |
0.858 |
0.674 |
N.D |
N.D |
N.D |
N.D |
Meglitinide |
0.086 |
-0.296 |
0.801 |
0.364 |
0.135 |
-0.415 |
1.103 |
0.368 |
0.132 |
-0.555 |
1.540 |
0.348 |
Calcium Channel Blockers |
0.207 |
0.018 |
0.428 |
0.034 |
0.096 |
-0.197 |
0.399 |
0.499 |
0.388 |
0.115 |
0.733 |
0.008 |
ACE inhibitors |
-0.031 |
-0.227 |
0.161 |
0.737 |
-0.072 |
-0.371 |
0.217 |
0.601 |
0.049 |
-0.198 |
0.298 |
0.689 |
Beta blockers |
-0.015 |
-0.276 |
0.240 |
0.890 |
0.079 |
-0.288 |
0.499 |
0.594 |
-0.190 |
-0.563 |
0.172 |
0.289 |
Diuretics |
-0.151 |
-.0394 |
0.053 |
0.134 |
-0.168 |
-0.534 |
0.151 |
0.267 |
-0.031 |
-0.374 |
0.307 |
0.844 |
Nitrates |
0.164 |
-0.043 |
0.734 |
0.081 |
0.106 |
-0.493 |
1.149 |
0.427 |
0.189 |
-0.140 |
0.743 |
0.176 |
Anti-platelets |
-0.118 |
-0.338 |
0.078 |
0.219 |
-0.003 |
-0.302 |
0.295 |
0.981 |
-0.281 |
-0.592 |
-0.002 |
0.048 |
Statins |
0.035 |
-0.171 |
0.245 |
0.724 |
0.117 |
-0.164 |
0.409 |
0.394 |
-0.044 |
-0.378 |
0.282 |
0.771 |
VRI was used as dependent variable; R Square: proportion of variance between variables in linear regression model. Data are expressed as regression coefficient beta and 95% CI (confidence intervals) with Min-Max range (minimal & maximal values). N.D: not determined. P values < 0.05 were considered statistically significant