Microbubbles (MBs) with size below 10 µm are commonly used as an ultrasound contrast agent (UCA). The aim of the novel UCA developed in our lab is to support imaging modalities other than ultrasound to form hybrid contrast agents. The hybrid contrast agents through the synergistic effect can potentially improve the diagnostic outcome of the combined multimodal imaging technique. In this study, we modified the polyvinyl alcohol (PVA) MB fabrication protocol to encapsulate the gold nanoparticles into the shell and also in the core of the MBs. Furthermore, we evaluated the morphology, nonlinear ultrasound response, and X-ray property of dual modal contrast agents. The results revealed that the loading of the gold nanoparticles into the PVA MB core is a promising step towards the development of the dual modal contrast agent.
microbubbles, contrast agent, polyvinyl alcohol, gold nanoparticle, ultrasound
In the past century, the technologies in the field of medical imaging have progressed explosively. Many imaging modalities were introduced to and routinely used in everyday clinical practice. In order to further improve the diagnostic outcome or therapy planning, information from various imaging modalities is needed. Therefore, the hybrid-imaging concept emerged. Hybrid imaging combines information from different imaging modalities with as close as possible time and space interval. The evolution of the imaging co-registration can be chronologically divided into 3 phases. In the first phase, physicians started by manually superposing images from various modalities. Wagner [1] reported that radiographs were used as backgrounds for rectilinear scanning to provide geographical information at John Hopkins Hospital as early as in the 1960s. Later, the software was introduced to fuse the medical images. The greatest challenge with software fusion was to achieve accurate alignment of non-rigid organs, which have a high degree of freedom [2,3]. The concept of hardware fusion was proposed to simplify the non-rigid registration [3]. The main idea of the hardware fusion was to acquire images from different modalities as close as possible spatially and temporally. As a consequence, the hardware fusion provides more accurate alignment than the pure software fusion of images taken from separate modalities [2].
The paramount of hybrid imaging is in its ability to mark the metabolism and/or functional information with accurate spatial location [4]. Usually, the functional information is obtained from nuclear imaging modalities, e.g., positron emission tomography (PET) or single photon emission computed tomography (SPECT). However, the functional information is not only limited to the assessment of the distribution of certain molecules, i.e. metabolism. For instance, the increasing stiffness of tissues is recently proposed to be the indicator of pathological changes in tissues [5-9]. This introduces a new class of biomarkers not related to the absorption of radiopharmaceuticals. Moreover, target to specific regions ultrasound contrast agents (UCA) allows the ultrasound imaging to reveal the pathological processes on molecular level [10]. On the other hand, due to the fact that ultrasound imaging is operator dependent, extended efforts need to be made to fuse ultrasound images with other modalities. Nevertheless, some attempts have already been made and reported in the literature. For instance, Lange et al. [11] developed an algorithm to register preoperative computer tomography (CT) with intraoperative 3D ultrasound images of the liver.
The raising interests in the hybrid images lead to the unmeet need in the development of hybrid contrast agents. Recently, most of the hybrid contrast agents were developed based on traditional contrast agents for single modality techniques. Studies have been done to combine clinically approved or research graded UCA, with contrast agents from other modalities to fabricate hybrid contrast agents. For instance, Teraphongphom et al. [12] entrapped gold nanoparticle in the shell of poly(lactic acid) (PLA) MB. Brismar et al. [13] combined the superparamagnetic iron oxide nanoparticles with polyvinyl alcohol (PVA) MB.
Previously, we reported the acoustic characteristics of plain PVA MB and MB coupled with iron oxide nanoparticles [12-14] for hybrid imaging, i.e. ultrasound and MRI. In this study, the nonlinear behavior of the PVA MB was investigated over a peak negative pressure (PNP) range from 50 kPa to 300 kPa. Moreover, attempts were made to combine gold nanoparticles, typically used as a contrast agent in preclinical computed tomography (CT), and PVA MBs to fabricate contrast agent for computed tomography and ultrasound (CACTUS).Gold nanoparticles were added during the formation of the shell of PVA MB and were expected to be trapped in the PVA shell. In addition, by increasing the permeability of the PVA shell a large amount of gold nanoparticles can be loaded into the core. Two potential candidates AuNP-S-MB and AuNP-Capsule were fabricated, accordingly. The candidates were observed by an optical microscope. The pressure dependent acoustic attenuation coefficients of the MBs suspension at the fundamental frequency, 2nd and 3rd harmonic were determined. The X-ray property of the CACTUS candidates was studied using a preclinical micro-CT. The visibility was evaluated using the Rose model.
Materials
Sodium metaperiodate (NaIO4, purity>99.0%) and Polyvinyl alcohol (PVA) are products of Sigma Aldrich, MO USA. AuroVistTM gold nanoparticle X-ray contrast agent is the product of Nanoprobes, NY USA. Solveco A (ethanol purity>99.5%) is the product of Solveco chemicals AB, Rosersberg Sweden.
Fabrication of microbubble
The MB fabrication followed the protocol optimized by Zheng et al. [15] originally from Cavalieri et al. [16]. In brief, 380 mg NaIO4 was added into preheated to 80 °C PVA aqueous solution to cleave the long PVA chains forming the telechelic PVA. Then, at the air-liquid interface, the PVA shell was formed by cross-linking of telechelic PVA under a vigorous sharing force of 8000 rpm applied by homogenizer (UltraTurrax, IKA, Königswinter Germany) equipped with a stainless steel tip S 25 N - 25 G (UltraTurrax, IKA, Königswinter Germany). The white foam representing the MB suspension was formed after 2 hours. As the last step, the solution was washed 10 times with 24 hours interval in a separation funnel to remove PVA debris, fragments, or solid particles. The resulting plain MBs have an air core surrounded by polymer shell making them effective and stable contrast agents for ultrasound imaging [13-14,17].
Fabrication of AuNP-S-MB
The fabrication of AuNP-S-MB followed the same procedure as plain MB, but 10 ml gold nanoparticles solution with a concentration of 4 mg/ml was added to the PVA solution during the formation of the PVA shell by a syringe pump at a speed of 5 ml/h.
Increasing the permeability of the MB shell
To increase the permeability of MB shell, 1 ml ethanol solution (Solveco A) was added to 0.5 ml MB suspension. The suspension was mixed by shaker (MS 3 basic, IKA, Königswinter Germany) at 500 rpm for 1 hour. It is expected that the permeability of PVA shell increases due to reduced surface tension of the surrounding liquid [16]. As a consequence, the air in the core was evacuated and the liquid occupies the MB core. Then the ethanol solution surrounding capsules was substituted with the water. Liquid-filled capsules precipitated under mild centrifugation using a centrifuge (Galaxy 5D digital microcentrifuge, VWR, USA) at a speed of 900 g for 10 min. A supernatant solution containing mostly ethanol or non-converted gas-filled MB was substituted with water and procedure repeated 5 times.
Fabrication of AuNP-Capsule
To load the capsule with gold, the gold nanoparticle solution with a concentration of 40mg/ml was added to the concentrated capsule suspension. The mixture was placed on a 500-rpm shaker (MS 3 basic, IKA, Königswinter Germany) for 1 hour and left overnight for passive loading. As the last step, the surrounding gold-loaded capsules solution was substituted with the water. AuNP-Capsule precipitated under mild centrifugation at a speed of 900 g for 5 min. A supernatant water solution containing gold nanoparticles was substituted with water and procedure repeated five times.
A summary of the names and fabrication methods of CACTUS candidates are listed in table 1.
Table1. Summary of CACTUS candidates fabricated in the study
|
Candidates
|
Gold nanoparticle loading methods
|
|
MB
|
Control
|
|
AuNP-S-MB
|
Gold nanoparticles introduced during the formation of the MB shell
|
|
AuNP-Capsule
|
Gold nanoparticles substituted the air-core of MB
|
Microscopy study
The candidates were observed using an upright transmitted light microscope (ECLIPSE Ci-S, Nikon, Tokyo, Japan). In order to determine the size distribution and concentration, the MB, AuNP-S-MB and AuNP-Capsule suspensions were diluted 20 times, loaded in both sides of a Neubauer counting chamber (Brand GmbH, Wertheim, Germany), and placed on the microscope stage for 10 mins before image acquisition. 4 images with size 4076 × 3166 pixels on each chamber side at different locations around the centre were acquired for each sample using camera DS-Ri1 (Nikon, Tokyo, Japan) combined with camera controller Digital sight DS-U3 (Nikon, Tokyo, Japan). An additional image with a focus on the bottom of the chamber, where the grids can be observed, was acquired to verify the measuring scale. The acquired images were processed by ImageJ (version 1.50b, National institutes of health, USA) to determine the concentration and size distribution. The Gaussian fit of the histogram is generated using a fit function in MATLAB (version R2016a, Massachusetts, USA).
Acoustic characterization
The pressure dependence of the acoustic attenuation coefficient of the MB suspension was determined by the computer-controlled measurement system model SNAP-Mark4 (RITEC Inc, Warwick, USA). The flat single element transducer (V382, Olympus NDT, Waltham, USA) with the central frequency of 3.5 MHz, diameter of 13 mm and -6dB bandwidth of 65% was used as an emitter and receiver. The acoustic output of the system was calibrated in a separate experiment using the membrane hydrophone set-up (Onda Corporation, Sunnyvale, USA). The PNP, mechanical index, pulse average intensity, and temporal average intensity were recorded.
An aluminum block working as a reflector was positioned beneath the transducer within the nearfield length and at a distance of approximately 7 cm. A 1.4 cm thick two-cavity chamber was positioned on the top of the metal block and between the transducer and the aluminum block to be used as the sample container. The transducer, container, and reflector were immersed in a tank filled with degassed water and kept at room temperature.
To prepare the sample, MB suspension was diluted to the concertation of 107 ml-1. The diluted MB suspension and water, as a reference, were injected into the two corresponding cavities of the chamber.
The power spectra of two ultrasound beams propagating through the MBs suspension and water, respectively, were recorded at a frequency range from 0 to 12 MHz.
Figure 1 illustrates an example of the power spectra of the received ultrasound signal. The attenuation introduced by MB at the fundamental frequency, 2nd, and 3rd harmonic was assessed by calculating the difference between the corresponding peaks in the power spectra.

Figure 1. The power spectra of the received ultrasound signal propagating through MBs suspension (blue) and water (red)
X-ray characterization
The CT images of the samples were obtained using the quantum FX-CT micro-CT (PerkinElmer Inc, MA, USA). To prepare test samples, MB, AuNP-S-MB and AuNP-Capsule suspension, as well as water, gold nanoparticles solution, and supernatant of AuNP-Capsule with a volume of 1.5 mL were loaded into Eppendorf tubes. Three sets of experiments were performed: 1. Water, MB suspension, and gold nanoparticle; 2. Water, AuNP-S-MB and gold nanoparticle; 3. Water, AuNP-Capsule suspension, and supernatant of AuNP-Capsule. The samples and references were fixed on a plastic holder and placed on the stage of the micro-CT in the center of the scanning area. The measurements were performed at room temperature. The micro-CT was operated at varied voltages of 50kV, 70kV and 90kV with the current of 200 mA, and exposure time of 120s. The data of the measurement was processed by MiaLab (Mia-Solution AB, Stockholm, Sweden) [18]. The threshold-based segmentation was applied to segment volume of interest for each sample.
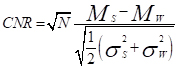
The contrast to noise ratio (CNR) between the following pairs: 1. water and MB; 2. water and AuNP-S-MB; 3. water and gold nanoparticle solution; 4. water and AuNP-Capsule were calculated following Equation 1
(1)
where Ms and Mw are the mean CT-number acquired for the sample and water in the volume of interest. The σs and σw are the standard deviations of CT-number of sample and water in the volume of interest, respectively. N corresponds to the number of voxels inside the volume of interest.
The minimum detectable size was estimated following a sample detectability criterion proposed by Rose [19] with the threshold set to 5. The Rose criterion was used as follows:
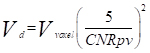
(2)
where Vd is the minimum detectable volume, Vvoxel is the volume of each voxel of the images and CNRpv is the contrast to noise ratio per voxel, equals to  according to Equation 1.
Microscopy study
Representative images, as well as measurements of the number and volume distribution of plain PVA MB, AuNP-S-MB, and AuNP-Capsule, are presented in figures 2-4. The number and volume distribution are obtained from the measurements on approximately 2000 to 4500 microbubbles of each type. Number distribution is an important parameter in the evaluation of the overall bubble population including small particles as the CT attenuation depends on the total amount of contrast agent presented. However, from the acoustic viewpoint, the volume distribution is a more appealing characteristic parameter as the acoustic scattering efficiency is proportional to the 6th power of the external diameter. Nevertheless, in the current study, we have decided to report both distributions due to the multimodality nature of the study. The background color changes of the microscope images were caused by illumination and auto-white function. However, those changes do not affect the results.
Figure 2. A representative microscopy image of plain MB on the left. The frequency distribution normalized by the number and volume of plain MB accompanied by the corresponding Gaussian fit on the right
Figure 3. A representative microscopy image of AuNP-S-MB on the left. The frequency distribution normalized by the number and volume of AuNP-S-MB accompanied by the corresponding Gaussian fit on the right
Figure 4. A representative microscopy image of AuNP-Capsule on the left. The frequency distribution normalized by the number and volume of AuNP-Capsule accompanied by the corresponding Gaussian fit on the right
The mean diameter of MB, AuNP-S-MB, and AuNP-Capsule assessed from the number distribution were equal to 3.4 ± 0.8, 3.2 ± 0.7 and 3.5 ± 0.8 µm, respectively.
The mean diameter of MB, AuNP-S-MB, and AuNP-Capsule assessed from the volume distribution were equal to 3.9 ± 0.9, 3.6 ± 0.7 and 4.1 ± 1.0 µm, respectively.
In the same plots, the lines demonstrate the Gaussian fit of the diameter distribution obtained using the values of the mean and standard deviation equal to those determined experimentally.
The initial concentration of MB, AuNP-S-MB, and AuNP-Capsule were 1.87·108, 1.28 ·108 and 2.84·108 ml-1 respectively.
The size distributions normalized by the number reported for plain PVA MB, AuNP-S-MB, and AuNP-Capsule are in the same range as other commercially available or research-graded microbubbles. The mean diameters of plain PVA MB, AuNP-S-MB, and AuNP-Capsule are reported in table 2. The values appear to be slightly higher than other commercially available microbubbles indicating potential swallowing effect for the case of liquid-filled capsules. However, it is worth reporting that the majority of the plain PVA MB, AuNP-S-MB, and AuNP-Capsule have a narrow size distribution and the outer diameter smaller than 8µm, making them truly intravascular contrast agents that are not obstructing the flow within pulmonary microcapillary circulation [20]. Moreover, it is also expected that microbubbles of such size will resonate within the clinical diagnostic ultrasound frequency ranges between 1 and 15 MHz [21].
Table 2. Mean diameter of some ultrasound contrast agents
|
Ultrasound contrast agent
|
Mean diameter (µm)
|
|
PVA MB
|
3.4
|
|
AuNP-S-MB
|
3.2
|
|
AuNP-Capsule
|
3.5
|
|
SonoVue™
|
2.522
|
|
Poly (lactic acid) microbubbles
|
2.223
|
|
Gold nanoparticles loaded poly (lactic acid) (PLA) microbubbles
|
1.723
|
|
Echovist™
|
2.024
|
|
SIGHT microbubble
|
3.025
|
Worth mentioning is the minor decrease in mean diameter after the introduction of the gold nanoparticles into the shell of MBs during the fabrication (AuNP-S-MB). Nanoparticles might have worked as additional crosslinking centers for the telechelic PVA chains making the shell more compact, thus reducing the diameter.
On the other hand, the mean diameter of liquid-filled AuNP-Capsules was increased, probably due to changes of the shell permeability after being exposed to the ethanol solution. Shell might swallow and become more like a hydrogel saturated with the surrounding liquid.
It is found that the mean diameter assessed from number distribution was not affected by the fabrication procedure and remain within 3 µm for all particles considered in this study. However, a larger amount of particles bigger than 5 µm were observed for liquid-filled AuNP-Capsules. Gas-filled plain MBs and AuNP-S-MB reveal almost identical number distribution profiles with a slight shift toward small particles in AuNP-S-MB case.
In other studies [16,22,23], dynamic light scattering (DSL) was used to analyze the size distribution of MB and the cytometer was used to determine the concentration of MB. Compare to those methods, assessment using the microscope that is utilized in the current study provides more information on the particle gathering and particle interaction. On the other hand, a microscopy study only observes a single plane of the sample, which might introduce observation bias. For example, the diameters of the plain PVA MB, AuNP-S-MB and AuNP-Capsule were systematically underestimated because the equatorial plane of the MBs was not always on the focused plane of the microscope.
Acoustic attenuation
The pressure dependence of the acoustic attenuation coefficient between water and plain MB suspension is shown in Figure 5. The acoustic attenuation coefficient of MB suspension was obtained at the fundamental frequency, second and third harmonics. The concentration of MB suspension was 107 ml-1.
Figure 5. Attenuation coefficients of the MB suspension in fundamental frequency, 2nd, and 3rd harmonics
Three characteristic regions of the MBs behavior can be identified:
In the first region, i.e. at the pressure below 100 kPa, the attenuation coefficient remains constant around 4.2 dB/(cm·MHz) at the fundamental frequency of 3.5 MHz, while it monotonically increases with respect to increased pressure at second and third harmonics, 7 and 10.5 MHz, respectively.
In the second region, i.e. at the pressure between 100kPa and 230kPa, the attenuation coefficient acquired at fundamental frequency dropped to the plateau at around 3 dB/(cm·MHz). For the second harmonics, the attenuation coefficient first reached a peak of around 3.3 dB/(cm·MHz) at 160 kPa and then started to decrease. On the other hand, the attenuation coefficient acquired at the third harmonics continued to increase from about 1.5 to 1.9 dB/(cm·MHz).
In the third region, i.e. at the pressure above 230kPa, the attenuation coefficient at a fundamental frequency and second harmonics monotonically descended from approximately 2.1 to 1.65 dB/(cm·MHz). The attenuation coefficient in the third harmonics also decreased from around 1.75 to 1.55 dB/(cm·MHz).
Extensive characterization of the acoustic properties of plain PVA MB, such as backscattered power, acoustic attenuation coefficient, phase velocity, and fracture pressure threshold, were reported previously by Grishenkov et al. [13,24]. In this study, we investigated the transformation from the linear to nonlinear behavior of MB. The results of the ultrasound tests revealed the MB oscillation in the linear regime at the peak negative pressure, PNP, lower than 100 kPa. The MB attenuation coefficients were constant at the fundamental frequency, while the attenuation coefficients at second and third harmonic slightly increase. Thus, the energy absorbed and scattered by MB can be considered as independent from the input energy manifesting the MB oscillation in a linear fashion at PNP lower than 100 kPa. On the other hand, at the PNP range from 100 to 230 kPa, the attenuation coefficient at fundamental frequency drops to a lower plateau value. The attenuation coefficient first increases reach a peak at the PNP about 160 kPa, then drops in second harmonic and monotonically increases in third harmonic. Those indicate that less energy was absorbed or scattered by PVA MB at the fundamental frequency, and more energy was absorbed or scattered at higher frequencies. When the PNP is above 230 kPa, the attenuation coefficient drops at all frequencies considered in this study. This suggests that the energy is transfer to even higher frequencies. Alternatively, inertial cavitation and fracturing of the MBs might take place, leading to the transient in the time domain and broadband in frequency domain signal to be recorded [25].
The nonlinear behavior of PVA MB could potentially be used to develop a harmonic contrast pulse sequence to further enhance the contrast in ultrasound imaging technique. If the second and third harmonics are of specific interest, the PNP should be controlled at a certain range between 100 and 230 kPa to prevent energy transfer to higher harmonics or destruction of the MBs.
A similar study was carried out by Shi et al. [26]. A sharply increasing sub-harmonic component of scattered signals of LevovistTM MB was observed after the acoustic pressure went up to 300 kPa, indicating the more pronounced of the nonlinear behavior of LevovistTM MB.
The ultrasound test was not performed on AuNP-Capsule, because the gas core of AuNP-Capsule was not restored. In another similar study, Ke et al. [27] fabricated gold-nanoshelled microcapsules (GNS-MCs). Lyophilization was applied to sublimate the encapsulated water and creat gas core inside of microcapsules. In a pilot study, the authors applied lyophilization to plain MB and restore the MB afterwords. Those suggested that lyophilization might be a promising method to restore the gas core of AuNP-Capsule.
X-ray characterization
The CT-number of MB, AuNP-S-MB, AuNP-Capsule supernatant and AuNP-Capsule were investigated with a preclinical micro-CT scanner. The results are shown in figure 6.
Figure 6. A representative CT image on the left. The CT-number of CACTUS candidates and AuNP-Capsule supernatant on the right
At the operation voltage of 50 kV, the suspension of the gold nanoparticles demonstrated the highest CT-number of about 75 HU, followed by AuNP-Capsule with 25 HU and supernatant solution with HU around 8. Worth reporting is that the same trend can be observed for other operational voltage 70 and 90 kV. However, CT-number monotonically decreased when the operation voltage increased from 50 to 90 kV.
The sample of AuNP-Capsule supernatant was used as a reference to demonstrate the efficiency of washing steps after loading of MBs with gold nanoparticles to the core. It was expected that the lowest value of CT-number would be observed for water like supernatant media. Experiments revealed that some fraction of gold nanoparticles might still be present in the media, i.e. CT-number of about 8 HU at 50 kV. This fact was further confirmed by the experiments at higher operating voltages, i.e. 70 and 90 kV, with the levels of CT-number decreasing to about 4 HU.
On the contrary to the liquid-filled sample, the gas-filled MB and dual modal contrast agent AuNP-S-MB did not reveal strong dependence on the operation voltage applied. Very similar and the lowest among all samples CT-number of about 4 HU were reported for both gas-filled samples for all operational voltages considered in this study.
The CNR per voxel of each sample are shown in figure.7.
Figure 7. CNR per voxel of samples and AuNP-Capsule supernatant
At the operation voltage of 90 kV, the gold nanoparticle demonstrated the highest CNR per voxel equal to 1.45, followed by AuNP-Capsule and AuNP-Capsule supernatant solution, with the value of CNR around 0.65 and 0.2. As before, gas-filled MBs with or without goal nanoparticles reveal the lowest CNR per voxel equal to about 0.1. As the operating voltage decreased from 90 to 50 kV, CNR for all samples decreases slightly.
The minimal detectable volume Vd was estimated for the promising dual modal agent candidate, i.e., AuNP-Capsule, and presented in figure 8. The results acquired for the solution of the gold nanoparticles of the same concentration are brought for comparison and also displayed in figure.8
Figure 8. The minimal detectable volume of AuNP-Capsule suspension and gold nanoparticle solution
The smallest Vd of about 0.17 µL was estimated for the suspension of AuNP-capsules at operation voltage 90 kV. As the voltage decreases, the minimal detectable volume increases to the level of 0.22 µL at 50 kV. The same trend of the monotonically increasing volume was observed for the suspension of gold nanoparticles, where the Vd increased from approximately 0.03 to 0.06 µL.
The CT results demonstrated that both plain MB suspension and AuNP-S-MB suspension have a low CNR per voxel, which indicates that adding gold nanoparticle solution at the concentration of 4 mg/ml to a PVA solution of 200 ml during forming of the MB shell does not introduce a notable change in the CT-number of the MB. Thus, the amount of embedded gold nanoparticles was not sufficient to be detected using commercial micro-CT available for this study.
The supernatant from the last wash of AuNP-Capsule has a CT-number almost as water, which suggests that most of the substances with a higher CT-number than water are inside of capsules.
The AuNP-Capsule has a higher CT-number than water, supernatant, and two types of gas-filled MBs. Thus, the gold nanoparticle is incorporated into the core of the capsules.
The CNR of the gold nanoparticle or AuNP-Capsule was expected to have a sharp increase when the operation voltage changed from 70 kV to 90 kV as gold has a K-edge at 80.7 kV, where the CT-number of gold increases dramatically. However, the sharp increase of CNR was not observed. The authors believe that it is due to the limited amount of photons with energy higher than 80.7 keV at the operation voltage of 90 kV. It is possible to increase the percentage of photons with energy higher than 80.7 keV by adding a filter. However, the total amount of photons will also be reduced, increasing the noise in the resulting image. As a consequence, the improvement of the CNR after the application of the filter is questionable.
In a reference study of gold nanoparticles as X-ray contrast agent Wang et al. reported that intravenous and intraperitoneal injection of specific targeting gold nanoparticles increase the CT-number of targeted tissue by about 25 HU, while intratumoral injection increases the CT-number by 150 HU. Eck et al. reported the injection of non-specific targeting gold nanoparticles increases the CT-number of inguinal lymph nodes less than 50 HU. In our study, the AuNP-Capsule increases the CT-number of water by about 22 HU, which is a comparable value to Wang’s and Eck’s results.
An interesting study by Ke et al. [27] evaluated the application of the surface-seeding method to form gold nano-shells around the GNS-MCs. The energy dispersive X-ray spectroscopy test revealed that the gold shell was formed around the UCA. Unfortunately, the aim of the study was only limited to enhance ultrasound imaging, by introducing greater acoustic impedance mismatch for UCA, and photothermal therapy, through the use of gold nanoparticles. Dual modal imaging potential of fabricated microdevice was not recognized and thus CT-number was not reported.
On the contrary In Teraphongphom’s study [23] the CT-number of gold nanoparticles entrapped MB with a concentration range from approximately 1.6·108 to 3.2·109 ml-1 were also evaluated by CT. The MBs can be clearly visualized after the concentration reaching approximately 1.2·109 ml-1. In this study, the sample concentration was kept at the level of 108 ml-1. Thus, our results were comparable to the reference study only at the two lowest concentration scenarios. For those concentrations, Teraphongphom et al. reported that the gold nanoparticles entrapped MBs cannot be clearly visualized.
In the current paper, CT-number of the dual modal contrast agent with a concentration higher than 109 ml-1 were not assessed due to two reasons. First, to achieve local concentration higher than 109 ml-1 in a clinical scenario requires specific targeting [28] or external accumulation forces [12]. Second, the high local concentration of UCA will create a ‘shadowing’ artifact in ultrasound images [29].
However, it is worth noting the merit of Teraphongphom’s study [23] in an extended range of the operational voltage for the CT images up to 100 kV. Therefore, it is reasonable to believe that the K-edge effect of gold was fully exploited and more pronounced in their CT images.
Teraphongphom’s study [23] evaluated gold nanoparticles entrapped MB with a qualitative method, while a quantitative analysis was carried out in our study to evaluate the performance of potential CACTUS candidates. The quantitative analysis allows the results to be more objective. However, the quantitative method used in this study has limitations and was based on assumptions.
The smallest detectable volume Vd was calculated based on the best possible detection performance according to the reference study by Rose [19]. There is a hidden assumption that prior information such as possible signal sizes, shapes, and the location was available. In the preclinical set-up and even further in clinical practice, the prior information is unknown, making Vd much larger. Moreover, it is assumed that noise caused by random errors is dominating and therefore used as an approximation of the noise.
The noise in the CT images comes from systematic and random errors. Attempts were made to minimize systematic errors by:
- Request calibration serves from the micro-CT manufacturer.
- Locate the samples at the center of the scanner volume, where the CT-number is constant for the same sample.
- Include water in all tests to reduce the potential influence and bias.
The random errors might come from the fluctuation of photons counting and electronic elements in the micro-CT. Noise caused by random errors were estimated as the quadratic mean of the standard deviation of CT-number of sample and water. The probability of observing photons follows the Poisson distribution. Therefore, the effect of photons counting fluctuation of a sample with low CT-number (more photons transmitted) is lower than one with high CT-number. This phenomenon was observed in this study. Water, PVA MB, and AuNP-S-MB suspension have similar noise and are lower than AuNP-Capsule suspension and gold nanoparticle solution.
In this study, the acoustic properties of PVA MB were investigated over the pressure range between 50 to 300 kPa. The results demonstrated the nonlinear behavior of the MB starts building up at the pressure higher than 100 kPa. The energy absorbed or scattered by the MB was transferred from fundamental frequency to 2nd and 3rd harmonic. This effect became more pronounced as the pressure was further increased to 300 kPa.
The optical microscopy tests performed on the suspension of plain PVA MB, dual modal contrast agents (AuNP-S-MB and AuNP-Capsule) reveal revealed narrow size distributions between 2.5 to 4.5 µm, which allow them to travel through capillaries.
The micro-CT tests revealed that AuNP-Capsule suspension could be detected at all operation voltages (70, 80, and 90 kV) considered in this study with the concentration similar to the level of which UCA is routinely used in the clinical practice. The smallest possible detectable volume of the AuNP-Capsule sample is estimated to be about 0.17µL at 90 kV. The results suggest that loading gold nanoparticles into the core of MBs by increasing the permeability of the PVA shell is a promising step towards the development of dual modal contrast agent for CT and ultrasound. Future work will focus on the development of the strategy to restore the gas core of the AuNP-Capsule either via freeze-drying or further chemical treatment of the MBs suspension.
Ph.D. student H. Chen is found by China Scholarship Council
H. Chen deeply acknowledges the scholarship financial support provided by the China Scholarship Council and the helpful discussion with D. Marlevi and M. Colarieti-Tosti. This study was performed at the Preclinical Imaging Facility, Preclinical Laboratory, Karolinska University Hospital, Sweden, supported by grants from research and education fund Karolinska University Hospital, the Centre for Innovative Medicine, and KTH Jonnasson Imaging center.
This paper is developed from the conference abstract “Polymer Microbubbles as Dual Modal Contrast Agent for Ultrasound and Computed Tomography” presented on the 23rd European Symposium on Ultrasound Contrast Imaging. The authors acknowledge all the valuable feedback received at the conference.
- Wagner HN (2007) A personal history of nuclear medicine. Springer Science & Business Media. pp: 61-63.
- Beyer T, Freudenberg LS, Townsend DW, Czernin J (2011) The future of hybrid imaging—part 1: hybrid imaging technologies and SPECT/CT. Insights Imaging 2: 161-169. [Crossref]
- Hutton BF, Braun M (2003) In Software for image registration: algorithms, accuracy, efficacy, Semin. Nucl Med Elsevier. pp: 180-192. [Crossref]
- Gaemperli O, Kaufmann PA, Alkadhi H (2011) Cardiac hybrid imaging. Eur Heart J 32: 2100-2108. [Crossref]
- Bamber J, Cosgrove D, Dietrich CF, Fromageau J, Bojunga J, et al. (2013) EFSUMB guidelines and recommendations on the clinical use of ultrasound elastography. Part 1: Basic principles and technology. Ultraschall Med 34: 169-184. [Crossref]
- Zaleska-Dorobisz U, Kaczorowski K, Pawluś A, Puchalska A, Inglot M (2014) Ultrasound elastography—review of techniques and its clinical applications. Brain 6: 10-14. [Crossref]
- Mariappan YK, Glaser KJ, Ehman RL (2010) Magnetic resonance elastography: a review. Clin Anat 23: 497-511. [Crossref]
- Yin M, Talwalkar JA, Glaser KJ, Manduca A, Grimm RC, et al. (2007) Assessment of Hepatic Fibrosis With Magnetic Resonance Elastography. Clin Gastroenterol Hepatol 5: 1207-1213.e2. [Crossref]
- Garra BS, Cespedes EI, Ophir J, Spratt SR, Zuurbier RA, et al. (1997) Elastography of breast lesions: initial clinical results. Radiology 202: 79-86. [Crossref]
- Lindner JR (2004) Molecular imaging with contrast ultrasound and targeted microbubbles. J Nucl Cardiol 11: 215-221. [Crossref]
- Lange T, Papenberg N, Heldmann S, Modersitzki J, Fischer B, et al. (2009) 3D ultrasound-CT registration of the liver using combined landmark-intensity information. Int J Comput Assist Radiol Surg 4: 79-88. [Crossref]
- Grishenkov D, Pecorari C, Brismar TB, Paradossi G (2009) Characterization of acoustic properties of PVA-shelled ultrasound contrast agents: linear properties (part I). Ultrasound Med Biol 35: 1127-1138. [Crossref]
- Brismar TB, Grishenkov D, Gustafsson B, Härmark J, Barrefelt A, et al. (2012) Magnetite nanoparticles can be coupled to microbubbles to support multimodal imaging. Biomacromolecules 13: 1390-1399. [Crossref]
- Grishenkov D, Pecorari C, Brismar TB, Paradossi G (2009) Characterization of acoustic properties of PVA-shelled ultrasound contrast agents: ultrasound-induced fracture (part II). Ultrasound Med Biol 35: 1139-1147. [Crossref]
- Zheng M (2011) Ultrasound contrast agents: fabrication, size distribution and visualization. Royal Institute of Technology KTH ST HSE-141 86 Flemingsberg, Sweden.
- Cavalieri F, El Hamassi A, Chiessi E, Paradossi G, Villa R, et al. (2006) Tethering functional ligands onto shell of ultrasound active polymeric microbubbles. Biomacromolecules 7: 604-611. [Crossref]
- Sciallero C, Grishenkov D, Kothapalli SV, Oddo L, Trucco A (2013) Acoustic characterization and contrast imaging of microbubbles encapsulated by polymeric shells coated or filled with magnetic nanoparticles. J Acoust Soc Am 134: 3918-3930. [Crossref]
- Cavalieri F1, El Hamassi A, Chiessi E, Paradossi G (2005) Stable polymeric microballoons as multifunctional device for biomedical uses: synthesis and characterization. Langmuir 21: 8758-8764. [Crossref]
- Wang C, Frimmel H, Smedby Ö (2014) Fast level‐set based image segmentation using coherent propagation. Med Phys 41: 073501. [Crossref]
- Rose A (1948) The sensitivity performance of the human eye on an absolute scale. J Opt Soc Am 38: 196-208. [Crossref]
- Hogg JC (1987) Neutrophil kinetics and lung injury. Physiol Rev 67: 1249-1295. [Crossref]
- Anderson AL, Hampton, LD (1980) Acoustics of gas‐bearing sediments I. Background. J Acoust Soc Am 67: 1865-1889.
- Schneider M (1999) Characteristics of SonoVue™. Echocardiography 16: 743-746.
- Teraphongphom N, Chhour P, Eisenbrey JR, Naha PC, Witschey WR, et al. (2015) Nanoparticle loaded polymeric microbubbles as contrast agents for multimodal imaging. Langmuir 31: 11858-11867. [Crossref]
- Grishenkov D (2010) Polymer-shelled Ultrasound Contrast Agents: Characterization and Application. KTH, Sweden.
- Shi WT, Forsberg F, Raichlen JS, Needleman L, Goldberg BB (1999) Pressure dependence of subharmonic signals from contrast microbubbles. Ultrasound Med Biol 25: 275-283. [Crossref]
- Ke H, Wang J, Dai Z, Jin Y, Qu E, et al. (2011) Gold‐nanoshelled microcapsules: a theranostic agent for ultrasound contrast imaging and photothermal therapy. Angew Chem Int Ed 50: 3017-3021. [Crossref]
- Klibanov AL (2005) Ligand-carrying gas-filled microbubbles: ultrasound contrast agents for targeted molecular imaging. Bioconjugate Chem 16: 9-17. [Crossref]
- Uhlendorf V (1994) Physics of ultrasound contrast imaging: scattering in the linear range. IEEE Trans Ultrason Eng 41: 70-79. [Crossref]