Objectives: Psychosocial risk factors play an important role in recovery following upper extremity injuries. The primary purpose of this cross-sectional study was to examine the prevalence of psychosocial flag signs (yellow, blue and black) in workers who suffered a compensable work-related shoulder or elbow injury. The secondary aim was to explore the relationship between presence and number of the flag signs and patient demographics and pain, disability, anxiety, depression and ability to work.
Methods: This study involved review of the electronic files of injured workers with an active Worker’s Safety and Insurance Board claim who were seen in a specialty clinic. Presence of psychosocial risk factors had been documented in a standardized assessment form. All patients had completed a Numeric Pain Rating Scale (NPRS), the Quick Disabilities of the Arm, Shoulder and Hand (QuickDASH), and the Hospital Anxiety and Depression Scale (HADS).
Main outcomes and results: Data of 300 consecutive patients, 111(37%) females, 189 (63%) males, mean age=49 (10) were reviewed. The prevalence of yellow, blue and black flag signs was 120 (40%), 43(14%), and 126 (42%) respectively. One hundred and eleven (37%) patients had no flag signs (Group1). Of the remaining 189 patients, 143(48%) had one or two flag signs (Group2) and 46(15%) had 3 or more flag signs (Group3). There was a statistically significant relationship between NPRS, QuickDASH and HADS and group allocation.
Conclusions: Workers with compensable shoulder or elbow injuries have a significant prevalence of psychosocial risk factors. Increased number of flag signs irrespective of the category was associated with increased report of pain, disability, anxiety, depression and a more undesirable work status.
Abbreviations:
FTRCT: Full-thickness rotator cuff tear; HADS: Hospital Anxiety and Depression Scale; NPRS: Numeric pain rating score; NSAID: Non-steroidal anti-inflammatory drugs; OR: Odds ratios; PTRCT: Partial-thickness rotator cuff tear; Quick DASH: Quick Disabilities of the Arm, Shoulder and Hand; RTW: Return to Work; SD: Standard Deviation; WSIB: Workplace Safety and Insurance Board
psychosocial, flag signs, risk factors, workers compensation, shoulder, elbow
Shoulder and elbow work-related injuries can be caused by lifting, overhead repetitive activities, forceful exertion or prolonged awkward postures [1-3]. However, psychosocial characteristics of work environment such as stress, high job demands, low job control, lack of social support and insufficient coping abilities are also reported to play an important independent role in the development or persistence of disability following an injury [4-9].
The concept of psychosocial flags as risk factors for prolonged disability was first introduced by Kendall, et al. [10] and has been a subject of interest in occupational literature since its conception in late 1990s [11,12]. These authors coined the term “yellow psychosocial flags” to the features that affect how one manages his/her situation, including fears about pain or injury, expectation of passive treatment, negative pain beliefs and distressed affect. A few years later, Main and Burton [13] suggested two other flags to more specifically represent the workplace social/environmental risk factors; “blue psychosocial flags” refer to workplace and the worker’s perceptions of the relationship between health and work, such as stressful, unsupportive, and excessively demanding and “black psychosocial flags” refer to the context and environment in which the worker functions, including people, system and policies, such as the insurance and compensation system under which workplace injuries are managed.
The substantial economic costs associated with reduced work performance and productivity, increased sick leave and demands on the health care system make the upper extremity and particularly the shoulder an important area of interest in occupational injuries [14-16]. Considering the importance of psychological factors on recovery and return to work, further examination of these factors is warranted. The primary purpose of this study was to examine the prevalence of yellow, blue and black psychological flags in a sample of injured workers who suffered a compensable work-related shoulder and/or elbow injury. The secondary aim was to explore the relationship between presence and number of these signs with patient demographics and the self-reported levels of pain, disability, anxiety, and depression.
This study involved review of the electronic files of the injured workers with an active claim referred to a Shoulder and Elbow Surgical Specialty clinic. These Specialty clinics have been supported by the Ontario Workplace Safety and Insurance Board (WSIB) to facilitate the management of injured workers who might be a candidate for surgical interventions. The case managers initiate the referral to the clinic that is run by an orthopedic surgeon consultant with fellowship training in shoulder or elbow surgery and a specialized physical therapist. The details on demographics (age, sex, medical health, medication use, employment and symptom duration, mechanism of injury, job demands and work status), clinical diagnosis, presence and number of flag signs, and recommendations for management are documented in a standardized PDF form.
Participant consent was not necessary as this study involved the review of clinical reports. Approval for using the existing data was obtained from the Research Ethics Board of the Sunnybrook Health Sciences Centre (project# 205-2015).
Psychosocial flag signs
The questions relevant to flag signs were clearly defined and documented in the assessment form (Appendix A). The questions covered a variety of areas to assist with identifying psychosocial barriers to recovery or return to work, including topics such as expectations for recovery, coping strategies, lifestyle, preference for specific treatment (passive vs. active), and family or workplace issues. The category of “other” was chosen by the physical therapist if patient expressed concerns about an issue that was not in the form (Appendix A). Flag signs were considered positive if the patient verbally responded positively or confirmed presence of a certain trait or condition. Waddell, et al. [17] has suggested a cut-off score of 3 signs for improving the diagnostic efficiency of behavioral signs in low back pain. Therefore, to examine the accumulative impact of flag signs, we categorized the patients into three groups representing patients with no flag signs (Group1), <3 flag signs (Group2), and ≥3 flag signs (Group3).
Self-report outcome measures
All patients completed an upper extremity outcome measure, the Quick Disabilities of the Arm, Shoulder and Hand (QuickDASH) [18], a Numeric Pain Rating Scale (NPRS) and the Hospital Anxiety and Depression Scale (HADS) [19] while waiting to be seen by the clinicians.
The disability/symptom component of the QuickDASH has 11 questions on a Likert scale [18] ranging from 0 to 100 with higher scores indicating higher disability. QuickDASH has been reported to be valid and reliable in patients with upper extremity conditions [18,20,21]. The NPRS uses a 0 to 10 scale with 0 being no pain and 10 being the worst imaginable pain and is valid for clinical use [22,23]. The HADS is a 14 item scale [19]. Seven of the items relate to anxiety and seven relate to depression with the possible scores ranging from 0 to 21 for anxiety and 0 to 21 for depression. A score of 0 to 7 for either subscale is regarded as being in the normal range, a score of 8 to 10 is suggestive of the presence of the respective state and a score of 11 or higher indicates probable presence of the mood disorder [19]. Therefore, to provide a better distinction in HADS anxiety and depression scores, we subcategorized the HADS scores to three categories of normal (≤7), borderline affect disorder (8-10) and abnormal affect/mood (≥11). The HADS has acceptable measurement properties in patients with musculoskeletal conditions [24].
Statistical analysis
The sample size calculation was based on the expected prevalence of flag signs, using the formula: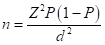 , where Z for a level of confidence of 95% CI is 1.96, P is the expected prevalence, and d is precision [25]. On considering lack of information on prevalence of specific flag signs in patients with shoulder or elbow conditions, we assumed the same prevalence of 13% reported by Grimmer-Somers for patients with low back pain who had a positive yellow flags [26]. With the Z statistic of 1.96, P of 0.13, and d of 5% (width of CI = 2d), a minimum of 174 cases were deemed necessary.
Descriptive statistics were performed for variables of interest (group, sex, age, work status). The estimate of prevalence of each flag category was calculated as the number of patients with at least one positive flag sign/total number of subjects. The relationships between number of flags (group variable) and patient characteristics were examined via ordinal logistic regressions with the group (three levels) as the dependent variable. Odds ratios were reported for categorical data and effect sizes were provided for continuous data (QuickDASH, NPRS and HADS scores). Considering the clinical interpretation of ordinal logistic regression of multiple groups is difficult, Group2 and 3 were compared with one another separately as well. Statistical analysis was performed using SAS® version 9.1.3 (SAS® Institute, Cary, NC). Statistical results are reported using 2-tailed p values with significance set at p < 0.05.
Data of 300 consecutive patients, 111(37%) females, 189 (63%) males, (mean age=49, SD=10, range 22 -78 years) were reviewed. Two hundred and thirty-one (77%) patients had a shoulder injury, forty-six (15%) patients had an elbow injury, and 23(8%) patients had both shoulder and elbow involvement. One hundred and eighty-eight (63%) of patients were working full time with 34 (11%) working part time and 78(26%) were not working.
In the present study, 111 (37%) patients had no flag signs (Group 1). Out of remaining patients 143(48%) had one or two flag signs (Group 2) and 46 (15%) had 3 or more flag signs (Group 3). The prevalence of having at least one positive response was 120 (40%), 43(14%), and 126 (42%) in the yellow, blue and black flag categories respectively. The details and relative frequency of specific positive responses to each question representing yellow, blue and black flag signs are provided in Figures 1-3 respectively.
Figure 1. Frequency of Yellow Psychosocial Flag question responses (N= 120). Some question responses overlapped
Figure 2. Frequency of blue Psychological flag question responses (N=43). Some question responses overlapped
Figure 3. Frequency of blue Psychological flag question responses (N=126). Some question responses overlapped
Table 1 shows group differences in demographics and subjective outcome measures. Age or sex of the patient was not correlated with the number of signs. Neither job demands, nor prevalent diagnostic categories showed any statistically significant group differences. Symptom duration was slightly longer in Groups 2 and 3 but this difference was not statistically different. Employment duration was shorter in groups with a positive sign (Groups 2 and 3) as compared with Group 1 (p<0.0001) (Table 1). Duration of employment however was not different between Group 2 and Group3 (p=.80). Consumption of analgesics was slightly higher in patients with at least one positive flag sign than patients with no flag signs (p=0.05). However, although Group 3 (67%) took more analgesic medication than Group 2 (52%), this was not statistically significant (p=0.90).
Table 1. Characteristics of patients with and without Flag signs (N=300)
Variables Mean (SD) Number (%) |
Group1 (N=111) |
Group2 (N=143) |
Group3 (N=46) |
Wald Chi square P values |
Odds Ratios Effect size * |
Age |
51 (10) |
48 (10) |
49 (10) |
X2=4.07, p=0.05 |
d=0.22 (0.13-0.56) |
Sex |
37 (33%) |
56 (39%) |
18 (39%) |
X2=0.83, p=0.35 |
___________ |
Female |
Male |
74(67%) |
87(61%) |
28 (61%) |
|
Symptom duration (months) |
7(7) |
9(21) |
11(19) |
X2=1.95, p=0.16 |
_________ |
Employment duration (Years) |
14(10) |
10(9) |
9(8) |
X2=17.57, p<0.0001 |
D=0.59 (0.24-0.94) |
Job Demands |
|
|
|
|
__________ |
Light |
21 (19%) |
24(17%) |
7(15%) |
X2=0.64, p=0.73 |
Moderate |
74(67%) |
89(62%) |
32(70%) |
Heavy |
16(14%) |
30(21%) |
7(15%) |
Mechanism of injury |
20(18%) |
35(24%) |
12(26%) |
X2=1.78, p=0.18 |
___________ ___________ |
Insidious |
Traumatic |
91(82%) |
108(76%) |
34(74%) |
Medical history |
11(10%) |
11(8%) |
6(13%) |
X2=0.04, p=0.83 |
___________ ___________ |
Diabetes |
Hypertension |
23(21%) |
25(17%) |
13(28%) |
X2=0.30, p=0.59 |
Medication use |
53(48%) 57(51%) |
75(52%) 69(48%) |
31(67%) 29(63%) |
3.94, p=0.05 0.61, p=0.43 |
0.645(0.41-0.99) ____________ |
Analgesics Anti-inflammatory |
|
|
|
|
|
Diagnosis
FTRCT PTRCT Impingement syndrome Adhesive capsulitis
Strains/tendonitis |
28(25%) 14(13%) 28(25%) 3(3%) 14(13%) |
29(20%) 15(10%) 38(27) 12(8%) 17(12%) |
7(15%) 5(11%) 17(37%) 2(4%) 7(15%) |
X2=2.06, p=0.15 X2=22, p=0.64 X2=1.53, p=0.22 X2=1.02, p=0.31 X2=0.07, p=0.79 |
____________ |
Subjective outcomes NPRS (0-10) QuickDASH (0-100) HADS Anxiety (0-21) HADS Depression (0-21) |
5.8(2) 43(22) 5.4(4) 4.6(4) |
5.9(3) 55(22) 8.3(5) 7.3(5) |
6.9(2) 66(18) 11.9(5) 9.9(5) |
X2=3.8, p=0.05 X2=35.73, p<0.0001 X2=52.44, p<0.0001 X2=44.45, P<0.0001 |
d=0.47 (0.13-0.82) d=1.19(0.82-1.79) d=1.41(0.82-1.56) d=1.25(0.88-1.62) |
Anxiety Normal (≤7). Borderline abnormal (7-10) Abnormal (>11) Depression Normal (≤7). Borderline abnormal (7-10) Abnormal (>11) |
82(74%) 16(14%) 13(12%) 86(77%) 17(15%) 8(7%) |
69(48%) 30(21%) 44(31%) 75(52%) 32(22%) 36(25%) |
7(15%) 8(17%) 31(67%) 15(33%) 8(17%) 23(50%) |
X2=38.59,p<0.0001 X2=0.02, p=0.86 ______ X2=29.62, p<0.0001 X2= 0.36, p=0.54 _______ |
OR=7.89(4.47-13.90) OR=2.94(1.49-5.8) ______ OR=6.38(3.54-11.49) OR=3.01(1.50-6.05) _______ |
Work status Not-working Working part time Working full time |
12(11%) 11(10%) 88(79%) |
46(32%) 14(10%) 83 (58%) |
20(43%) 9(20%) 17(37%) |
________ X2=0.39, p=0.53 X2=20.65, p<0.0001 |
___________ OR=1.60 (0.73-3.45) OR=3.94 (2.30-6.69) |
* ORs and Effect sizes are presented for statistically significant group differences. Odd ratios were calculated for categorical data and Cohen’s d were calculated for continuous data [small (0.20-0.49), moderate: (0.50-0.79), large: (>0.80)] between Group1 and Group3.
ORs for work status are provided for full time vs. not working, and part time vs. not working. For patients who were working full time, the odds of having no flag signs versus the combined <3 and ≥3 signs is 3.94 times higher than for patients who were unable to work.
ORs for anxiety and depression are provided for normal vs. abnormal and borderline abnormal vs. abnormal. For example, for patients who fell in the abnormal category for anxiety, the odds of having no signs versus the combined <3 and ≥3 signs is 7.89 times lower than for patients with normal scores.
Group 1: No flag signs
Group 2: Less than three flag signs
Group 3: Three or more flag signs
FTRCT: Full-thickness rotator cuff tear
HADS: Hospital Anxiety and Depression Scale
NPRS: Numeric pain rating score
OR: Odds ratios
PTRCT: Partial-thickness rotator cuff tear
Quick DASH: Quick Disabilities of the Arm, Shoulder and Hand
SD: Standard deviation
Patients in Group 1 were more likely to be working full time (79% in Group 1vs. 37% in Group3). Patients with ≥3 flag signs were more likely to be not working (43% of Group 3 vs. 11% of Group 1) (Figure 4). The odds of having no flag signs was 3.94 times higher for patients who were working full time. There was a statistically significant difference in work status between Group 2 and 3 as well (p=0.02).
Figure 4. Distribution of Groups by work status.
Group 1: No flag signs (N=11, 37%)
Group 2: Less than three flag sign (N=143, 47%)
Group 3: Three or more flag signs (N=46, 15%)
There was a statistically significant relationship among groups in relation to NPRS, QuickDASH and HADS components with higher levels of disability, anxiety and depression being reported in Group2 and 3 (Table 1). Group 1 included majority of workers with normal HADS scores (≤7). The reverse was observed in Group 3 with a moderate (50%) to high (67%) prevalence of abnormal affect/mood in depression and anxiety respectively (Table1, Figure 5). There was also a statistically significant difference in NPRS (p=0.02), QuickDASH (p=0.004), anxiety (p<0.0001), and depression (0.002) scores between Group 2 and Group3 with Group 3 reporting higher scores.
Figure 5. Scores of the self-report outcomes by Group
Group 1: No Flag signs (N=111)
Group 2: Less than three Flag sign (N=143)
Group 3: Three or more Flag signs (N=460029
There is a wealth of knowledge about the relationship between the presence of psychosocial factors and upper extremity disability [4-9]. However, we are not aware of the prevalence or significance of specific flag signs in injured workers with shoulder and/or elbow injuries and the present study adds to the body of knowledge in this area. In the present study, prevalence of the black flag signs was the highest (42%), followed by yellow flags (40%) with the blue signs being the least prevalent at 14%. Our study demonstrated a linear relationship between cumulative impact of number of flag signs and higher report of pain, disability, psychological well-being and poorer success at work. Presence of statistically significant group differences in pain, disability, depression, anxiety and work status occurred despite lack of group differences in job demands or diagnostic categories. This further highlight the importance of flag signs as an independent indicator of perceived physical and psychological well-being.
Upper extremity disorders are common musculoskeletal injuries with an increase in the number of cases being observed over the past two decades [6,27,28]. With an increase in the number of overall injuries and reported work-related compensable cases [29-36], the management of these injuries has become more costly and challenging over the years.
The results of our study emphasize the importance of inclusion of a psychosocial risk factor assessment tool in specialty clinics that are designed to facilitate injured workers management. In the present study, we identified the risk factors with a thorough review of potential factors with the patients. Early identification of high risk injured workers will assist with providing more effective or conjunctive interventions to reduce disability and associated healthcare costs [37]. Low or negative mood, unhealthy beliefs or perceptions are amenable to change by trained health care providers who are involved in the care of injured workers [11]. Physical and occupational therapists have the ability to provide feedback about hurt versus harm by explaining the nature of pathology and improve unhealthy perceptions about pain and discomfort by encouraging the benefits of active treatment. Education to family members in case of overprotective behaviour or lack of sufficient support may be necessary. The value of maintaining mutual communication between the health care providers and case managers and employers should not be underestimated [11,38,39]. In summary, early identification of psychosocial flag signs in injured workers can facilitate modification of unhealthy behaviour and incorporating workplace interventions in a timely fashion which may reduce the chance of chronic or permanent disability.
Studies that examine pain experience have an inherent limitation due to subjective nature of pain. In addition, the complex influence of cultural, ethnical, past experiences, beliefs and attitudes on how the pain is translated into pain behaviour should be acknowledged. These factors should be considered when assessing the conclusion of studies that examine the behavioral flag signs. Our study was limited to the available variables (disability, anxiety and depression) and did not include the in-depth patient attributes.
Workers with compensable shoulder and or elbow injuries have a significant prevalence of psychosocial risk factors. Increased number of flag signs irrespective of the category was associated with increased report of pain, disability, anxiety, depression and a more undesirable work status.
FTRCT: Full-thickness rotator cuff tear; HADS: Hospital Anxiety and Depression Scale; NPRS: Numeric pain rating score; NSAID: Non-steroidal anti-inflammatory drugs; OR: Odds ratios; PTRCT: Partial-thickness rotator cuff tear; Quick DASH: Quick Disabilities of the Arm, Shoulder and Hand; RTW: Return to Work; SD: Standard Deviation; WSIB: Workplace Safety and Insurance Board
The authors declare that they have no competing interests.
No external funding was received for this study.
View supplementary data
- Miranda H, Punnett L, Viikari-Juntura E, Heliovaara M, Knekt P (2008) Physical work and chronic shoulder disorder. Results of a prospective population-based study. Ann Rheum Dis 67: 218-223. [Crossref]
- Silverstein BA, Bao SS, Fan ZJ, Howard N, Sm2021 Copyright OAT. All rights reserv cuff syndrome: personal, work-related psychosocial and physical load factors. J Occup Environ Med 50: 1062-1076. [Crossref]
- Harkness EF, Macfarlane GJ, Nahit E, Silman AJ, McBeth J (2004) Mechanical injury and psychosocial factors in the work place predict the onset of widespread body pain: a two-year prospective study among cohorts of newly employed workers. Arthritis Rheum 50: 1655-1664. [Crossref]
- Nahit ES, Hunt IM, Lunt M, Dunn G, Silman AJ, et al. (2003) Effects of psychosocial and individual psychological factors on the onset of musculoskeletal pain: common and site-specific effects. Ann Rheum Dis 62: 755-760. [Crossref]
- Kraatz S, Lang J, Kraus T, Munster E, Ochsmann E (2013) The incremental effect of psychosocial workplace factors on the development of neck and shoulder disorders: a systematic review of longitudinal studies. Int Arch Occup Environ Health 86: 375-395. [Crossref]
- Bongers PM, Kremer AM, ter Laak J (2002) Are psychosocial factors, risk factors for symptoms and signs of the shoulder, elbow, or hand/wrist?: A review of the epidemiological literature. Am J Ind Med 41: 315-342. [Crossref]
- Keijsers E, Feleus A, Miedema HS, Koes BW, Bierma-Zeinstra SM (2010) Psychosocial factors predicted nonrecovery in both specific and nonspecific diagnoses at arm, neck, and shoulder. J Clin Epidemiol 63: 1370-1379. [Crossref]
- Mainenti MR, Felicio LR, Rodrigues Ede C, Ribeiro da Silva DT, Vigario Dos Santos P (2014) Pain, Work-related Characteristics, and Psychosocial Factors among Computer Workers at a University Center. J Phys Ther Sci 26: 567-573. [Crossref]
- Yue P, Xu G, Li L, Wang S (2014) Prevalence of musculoskeletal symptoms in relation to psychosocial factors. Occup Med (Lond) 64: 211-216. [Crossref]
- Kendall N, Linton S, Main C (1997) Guide to Assessing Psychosocial Yellow Flags in Acute Low Back Pain: Risk Factors for Long-Term Disability and Work Loss. Wellington, New Zealand: Accident Rehabilitation and Compensation Insurance Corporation of New Zealand and the National Health Committee.
- Nicholas MK, Linton SJ, Watson PJ, Main CJ, Decade of the Flags" Working Group (2011) Early identification and management of psychological risk factors ("yellow flags") in patients with low back pain: a reappraisal. Phys Ther 91: 737-753. [Crossref]
- Shaw WS, van der Windt DA, Main CJ, Loisel P, Linton SJ, et al. (2009) Early patient screening and intervention to address individual-level occupational factors ("blue flags") in back disability. J Occup Rehabil 19: 64-80. [Crossref]
- Main C, Burton A (2000) Economic and occupational influences on pain and disability. In: Main CJ, Spanswick CC, eds. Pain Management: An Interdisciplinary Approach. In Edited by Anonymous Churchill Livingstone: Churchill Livingstone, UK, 2000: 63-87.
- Kuijpers T, Vergouwe Y, van der Heijden GJ, Bot SD, Twisk JW, et al. (2007) Generalizability of a prediction rule for sick leave due to shoulder pain. Scand J Work Environ Health 33: 440-446. [Crossref]
- Nyman T, Grooten WJ, Wiktorin C, Liwing J, Norrman L (2007) Sickness absence and concurrent low back and neck-shoulder pain: results from the MUSIC-Norrtalje study. Eur Spine J 16: 631-638. [Crossref]
- Holtermann A, Hansen JV, Burr H, Sogaard K (2010) Prognostic factors for long-term sickness absence among employees with neck-shoulder and low-back pain. Scand J Work Environ Health 36: 34-41. [Crossref]
- Waddell G, Pilowsky I, Bond MR (1989) Clinical assessment and interpretation of abnormal illness behaviour in low back pain. Pain 39: 41-53. [Crossref]
- Beaton DE, Wright JG, Katz JN (2005) Upper Extremity Collaborative Group: Development of the QuickDASH: comparison of three item-reduction approaches. J Bone Joint Surg Am 87: 1038-1046.
- Zigmond AS, Snaith RP (1983) The hospital anxiety and depression scale. Acta Psychiatr Scand 67: 361-370. [Crossref]
- Macdermid JC, Khadilkar L, Birmingham TB, Athwal GS (2015) Validity of the QuickDASH in patients with shoulder-related disorders undergoing surgery. J Orthop Sports Phys Ther 45: 25-36. [Crossref]
- Mintken PE, Glynn P, Cleland JA (2009) Psychometric properties of the shortened disabilities of the Arm, Shoulder, and Hand Questionnaire (QuickDASH) and Numeric Pain Rating Scale in patients with shoulder pain. J Shoulder Elbow Surg 18: 920-926. [Crossref]
- Ferreira-Valente MA, Pais-Ribeiro JL, Jensen MP (2011) Validity of four pain intensity rating scales. Pain 152: 2399-2404. [Crossref]
- Williamson A, Hoggart B (2005) Pain: a review of three commonly used pain rating scales. J Clin Nurs 14: 798-804. [Crossref]
- Pallant JF, Tennant A (2007) An introduction to the Rasch measurement model: an example using the Hospital Anxiety and Depression Scale (HADS). Br J Clin Psychol 46: 1-18.
- Daniel W (1999) Biostatistics: A foundation for analysis in the health Sciences: 7th edition ed. New York: John Wiley and Sons, USA.
- Grimmer-Somers K, Prior M, Robertson J (2008) Yellow flag scores in a compensable New Zealand cohort suffering acute low back pain. J Pain Res 1: 15-25. [Crossref]
- Ashbury FD (1995) Occupational repetitive strain injuries and gender in Ontario, 1986 to 1991. J Occup Environ Med 37: 479-485. [Crossref]
- Davis K, Dunning K, Jewell G, Lockey J (2014) Cost and disability trends of work-related musculoskeletal disorders in Ohio. Occup Med (Lond) 64: 608-615. [Crossref]
- Silverstein BA, Stetson DS, Keyserling WM, Fine LJ (1997) Work-related musculoskeletal disorders: comparison of data sources for surveillance. Am J Ind Med 31: 600-608. [Crossref]
- Polanyi MF, Cole DC, Beaton DE, Chung J, Wells R, et al. (1997) Upper limb work-related musculoskeletal disorders among newspaper employees: cross-sectional survey results. Am J Ind Med 32: 620-628. [Crossref]
- Dainty RS, Alcorn E, Ferguson CA, Gregory DE (2014) Prevalence of occupation-related pain among baristas and an examination of low back and shoulder demand during the preparation of espresso-based beverages. Ergonomics 57: 1192-1200. [Crossref]
- Dunning KK, Davis KG, Cook C, Kotowski SE, Hamrick C, et al. (2010) Costs by industry and diagnosis among musculoskeletal claims in a state workers compensation system: 1999-2004. Am J Ind Med 53: 276-284. [Crossref]
- Huisstede BM, Bierma-Zeinstra SM, Koes BW, Verhaar JA (2006) Incidence and prevalence of upper-extremity musculoskeletal disorders. A systematic appraisal of the literature. BMC Musculoskelet Disord 7: 7. [Crossref]
- Huisstede BM, Wijnhoven HA, Bierma-Zeinstra SM, Koes BW, Verhaar JA, Picavet S (2008) Prevalence and characteristics of complaints of the arm, neck, and/or shoulder (CANS) in the open population. Clin J Pain 24: 253-259. [Crossref]
- Lipscomb HJ, Schoenfisch AL, Cameron W, Kucera KL, Adams D, et al. (2015) Workers' compensation claims for musculoskeletal disorders and injuries of the upper extremity and knee among union carpenters in Washington State, 1989-2008. Am J Ind Med 58: 428-436. [Crossref]
- Silverstein B, Welp E, Nelson N, Kalat J (1998) Claims incidence of work-related disorders of the upper extremities: Washington state, 1987 through 1995. Am J Public Health 88: 1827-1833. [Crossref]
- Vlaeyen JW, Linton SJ (2000) Fear-avoidance and its consequences in chronic musculoskeletal pain: a state of the art. Pain 85: 317-332. [Crossref]
- Blyth FM, Macfarlane GJ, Nicholas MK (2007) The contribution of psychosocial factors to the development of chronic pain: the key to better outcomes for patients? Pain 129: 8-11. [Crossref]
- Franche RL, Cullen K, Clarke J, Irvin E, Sinclair S, et al. (2005) Workplace-based return-to-work interventions: a systematic review of the quantitative literature. J Occup Rehabil 15: 607-631. [Crossref]