Abstract
Breast cancer is an emerging disease in Sudan. The exact extent is unclear due to several factors including the lack of a population-based registry. There is, however, a need to conduct basic descriptive studies of cancer. The study aimed to assess the importance of known risk factors for female breast cancer in Sudan using logistic regression models. 100 patient cases for different stages of breast cancer were used to study case management, and 100 healthy women from the National Cancer Institute (NCI), Gezira University, Sudan, were taken to predict the probability of women developing breast cancer, A standardized questionnaire was administered to all participants and consisted of socio-demographic factors, obstetric and gynecologic histories, anthropometric measurements, and other variables identified as risk factors from the literature. logistic regression was analyzed by taking factors such as age, marital status, family history, parity, age at first full-term pregnancy, menopausal status, Body Mass Index (BMI), and breastfeeding. The logistic regression model showed that there are important risk factors (age, marital status, family history, parity, age at first full-term pregnancy, menopausal status, body mass index, and breastfeeding) in the development of breast cancer. Findings suggest that the risk factors operative in the development of breast cancer in Sudan are not the same as those identified in more developed nations. Women of lower educational level and early age at menarche with higher body mass index were found to be at significantly increased risk of breast cancer.
Keywords
breast cancer, risk factors, logistic regression, sudanese women
Introduction
Cancer in Africa is under-recognized. Public and professional attention has been drawn more to news reports of death due to HIV, infectious diseases, and periodic famines. This is exacerbated by a lack of epidemiologic research and population-based registry data to accurately quantify the problem. Approximately (4%) of all deaths in Africa are attributable to cancer compared to (13%) worldwide1. However; the cancer toll across the continent is expected to climb as the population ages and adopts more Westernized behaviors. Breast cancer is the second most common cancer in African females accounting for (19%) of malignancies [1]. Similar proportions (12.9%) have been recorded for the Sudan [2]. In Africa as a whole, breast cancer is less common than cervical cancer; however, it is the most common malignancy in North Africa and certain subpopulations of Sub-Saharan, Africa. For example, in Nigeria, the Ibadan Cancer Registry has now documented that breast cancer is the most common female cancer and the most common cancer among both sexes [3]. Despite increased awareness campaigns about breast cancer, the majority of cancers (80-85%) are still present in advanced stages. Growing awareness of the prevalence of breast cancer in developing countries, as well as the advanced stage of the disease at presentation, has increased the importance of descriptive studies of this disease in the African continent. This manuscript aims to present results from a case-control study conducted at the NCI in Sudan. The importance of this research lies in its ability to investigate whether risk factors known to increase breast cancer in developed countries play a similar role in Sudan. These data may also aid policymakers in the design and implementation of health services to improve the health of women in Sudan.
Materials and Methods
Study design
From January 2017 to December 2017, the case management study was conducted at The National Cancer Institute (NCI). The incident case of a patient admitted to the NCI due to a diagnosis of breast cancer was chosen for the study, all women confirmed diagnosis with breast cancer were interviewed by one investigator. For access to the corresponding NCI information, written consent was obtained from the Supervisor of the NCI Review Board for all cases and control samples included in the analysis and no direct contact was established.
In addition to specialist and pathology records from which risk factors can be identified, the data collection of cases with breast cancer is accomplished by analyzing patient information through a direct interview between the patient and the related clinician.
Case Sample
Cases selected for inclusion in this study were randomly selected from those presenting at NCI with a diagnosis of breast cancer, were aged 25-80 years, had no prior history of breast cancer, and resided in Sudan. All cases were histologically confirmed. Data was collected through a questionnaire including socio-demographic factors (age, and marital status), reproductive factors (parity, age at first pregnancy, menopausal status, and breast- feeding), and Body Mass Index (BMI). The diagnosis of cases with breast cancer was the response factor for the study and from the patient's direct interview, the missing information was completed.
In addition to specialist and pathology records from which risk factors can be identified, the data collection of cases of breast cancer is accomplished by analyzing patient information through a direct interview between the patient and the related clinician.
Control Sample
The control women were recruited randomly, residing in the same geographical region, and admitted to the NCI without a history of breast problems or neoplastic diseases and who resided in the same geographical region as the case. Control cases were matched for gender and age; women confirmed diagnosis with breast cancer were interviewed by one investigator.
Data Set
Following approval from the reviewing committee, the data for this analysis were obtained from NCI. The National Institutes of Health accredited all researchers to protect participants in human research.
This study was conducted based on a sample of 200 people, including 100 cases (cases with breast cancer) and 100 control cases (not cases with breast cancer). Among women with breast cancer, 92 (92.0%) and 81 (81.0%) control are married. There were socio-demographic (age, and marital) factors, reproductive (parity, first pregnancy age, menopausal status, breast-feeding), and BMI as the risk factors assessed for the model's adaptation.
Methods
We have followed Salah, et al. methods. The relationship between a binary variable and one or more explanatory values is defined by the logistic regression method (Appendix -1) according to [1,4-8].
Statistical analysis
Logistic regression helps to model the probability of women developing BC based on social-demographic (age and marital status), reproductive (parity, age at first birth, menopausal status, and breast-feeding), and BMI variables. These variables are calculated according to Table 1. The research was conducted on the predictive effect of each variable about breast cancer risk to calculate odds ratio (OR) and 95% Confidence Intervals (CI), as illustrated by Tables of the (Appendix-1), equations 1 to 4 of (Appendix-2) [9,10] and Equation 5 of (Appendix-3), [9-15]. Risk factors associated with breast cancer have been entered into a multivariate logistic regression analysis of the forward-looking range (Appendix-4).
Results
Socio-demographic factors
Age
Breast cancer cases and controls were detected in cases as young as 23 years and as old as 81 years with a mean ± S.E. 46.5 ± 1.2 and 46.4 ± 1.8 years for cases and controls, respectively as shown in (Table 1).
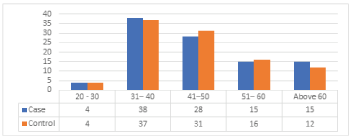
Results from (Table 2), (Figure 1) show that the maximum risk factors are in the age group of 31 - 40 with the cases of 37 out of 38 control samples, followed by 31 cases of breast cancer from the age group of 41 - 50 out of 28 controls and less case of 4 out of 4 was observed in the age group with less than 20 - 30.
Marital status
However, results from (Table 3), (Figure 2) observed in married cases were high with 81 cases out of 80, compared to 4 cases with divorced out of 3, and 7 cases and 5 of control are widowed and 4 cases and 3 of control are divorced, and 8 of cases and 12 of control are singles.
Body Mass Index (BMI)
As shown in (Table 4), (Figure 3), BMI had a significance p-value (of 0.000) in which (49) Of the cases were obese, whereas 54% of control subjects were obese (Figure 3). More cases were observed with a BMI of 20 - 24 with cases of 30 out of 27, 26 cases out of 23 controls were observed with a BMI of 25-29, followed by the cases with 21 out of 19 with a BMI less than 20, and 16 out of 15 with BMI 30 –34, and at BMI more than 35 there are 7 0ut of 16.
Education Level
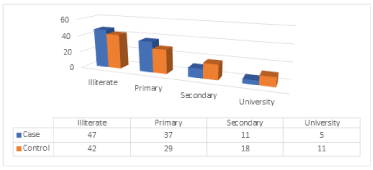
Education is known to have important effects on all aspects of human life. (Table 5), (Figure 4) gives the distribution of the cases and control according to education level. Most of the cases are illiterate (47%, 42%) for cases and controls respectively, whereas (37%, 29%) for cases and control respectively are primary, (11%,18%) of cases and control are secondary and (5%,11%) are university. The difference between the distributions of cases and control concerning educational level is statistically significant at the 5% level, with p- value = 0.000.
Age at Menarche
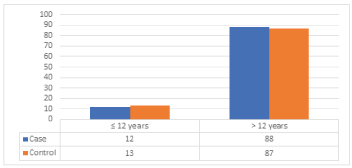
Information regarding age at menarche was available, mean age at menarche was found to be 13.2 ± 0.68 years for cases and 13.3 ± 0.72 years for control. This difference between the mean ages at menarche was statistically not significant (p-value = 0.647). (Table 6), (Figure 5) illustrates that most of the cases had menarche >12 years (88). The conclusion drawn from these results is that most of the Sudanese female, have their menarche between ages 10 and 14 with a mean of age 13. Menarche at advanced age is very rare even between both study groups.
Parity
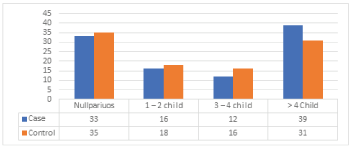
Results from (Table 7), (Figure 6), show that the maximum risk factors are in the parity of more than 4 children with cases of 39 out of 31 in controls, followed by 33 cases from never conceived (nulliparous) out of 35 controls and less case of 12 out of 16 was observed in the parity of 1 – 2 children. The difference between the distributions of cases and control about parity is statistically insignificant, with p-value = 0.645
Age at Birth of first child
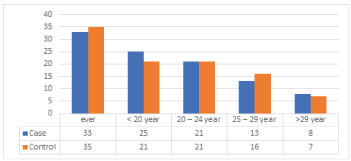
Age at first full-term pregnancy as shown in (Table 8), (Figure 7) ranged from 15 – 41 years among control. The mean age at first full-term pregnancy was 22.3 ± - 4.6 years among cases and 22.1 ± 3.4 years among control. Age at 1st full term pregnancy about (33%) of cases and (35%) of control are at the range of ever have child, (25%) of cases and (21%) of control their age at first full-term pregnancy between the age groups less than 20 years, (21%) of cases and (21%) of control their age 20 – 24 years, 13% of cases and 16% of control are 25 – 29 years and 8% of cases and 7% of control at the age ≥ 30.
Menopausal Status
The mean age at menopause was 44.9 ± 0.76 years for cases and 45.1 ± 0.69 years for control. The difference between the two means was statistically significant at a 5% level (p-value < 0.01). (Table 9), (Figure 8) illustrates that, at presentation 53%and, 64% of cases and control respectively, were premenopausal, and 47% and, 36% of cases and controls respectively were postmenopausal. This indicates that premenopausal women are at higher risk for developing breast cancer. The data from developing countries shows a high incidence of breast cancer among postmenopausal women rather than in premenopausal women. This difference between these two data may reflect the different natural history of the disease in developing countries, short life expectancy, or maybe it is a result of many other factors that are starting to be explained. The difference between the distributions of cases and control about menopausal status is statistically significant, with p-value = 0.054.
Contraceptive Use
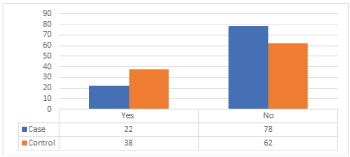
Distribution of cases and controls according to contraceptive use as shown in (Table 10), (Figure 9), illustrates that most cases have never used contraception in their life (78%). Only (22%) had used it, (62%) of control never used it and (38%) used it. The difference between the distributions of cases and control about contraceptive use is statistically significant, with p-value = 0.01.
Residence
The distribution of cases and controls according to residence is shown in (Table 11), and (Figure 10). Illustrate that most of the cases and control came from rural areas (69%, and 68%) respectively, whereas (31%, and 32%) respectively came from urban areas. The Census of 1993 showed that most of the population lived in rural areas and 29% of Sudan’s population lived in urban areas, whereas, less than 3% of the populations were nomads [16]. The chi-square test suggests that the difference in the distributions of rural and urban breast cancer is statistically insignificant, with a p-value = 0.50.
Breast Feeding
The distribution of cases and controls according to breastfeeding as shown in (Table 12) and (Figure 11) illustrates that most cases and controls had breastfeeding (66%, 62%) respectively, compared with women who hadn't (34%, 38%). The difference between the distributions of cases and control about breastfeeding is statistically insignificant, with p-value = 0.329.
Hormonal Replacement Therapy (HRT)
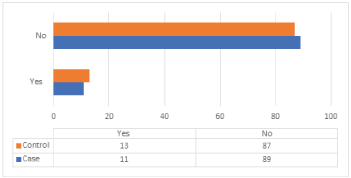
The distribution of cases and controls according to HRT is shown in (Table 13) and (Figure 12). The case study shows that 89% of cases were not treated by HRT, 11% did that, 87% of the control group weren’t treated with HRT, and 13% did it. The difference between the distributions of cases and control about HRT is statistically insignificant, with p-value = 0414
Previous Benign Biopsy (PBB)
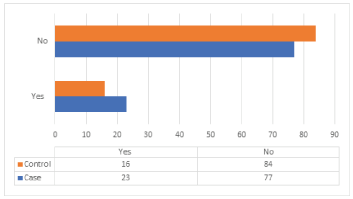
The distribution of cases and controls according to PBB is shown in (Table 14) and (Figure 13). According to the case study shows that 77% of cases didn’t have PBB, 23% had that, 84% of control didn’t have a previous benign biopsy, and 16% had it. The difference between the distributions of cases and control about PBB is statistically insignificant, with p-value = 0.142.
Occupation
The distribution of cases and controls according to occupation is shown in (Table 15) and (Figure 14). According to the case study were observed with cases 86% are housewives, 14% are employees, 67% of control is housewives, and 33% are employees. The difference between the distributions of cases and control about occupation is statistically significant, with p-value = 0.003.
Family history of breast cancer
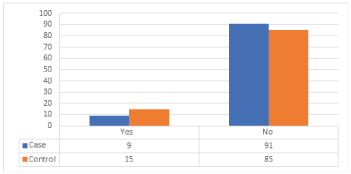
Distribution of cases and controls according to family history of breast cancer is shown in (Table 16) and (Figure 15) in the case study the women with a history of breast cancer were observed with cases 9 %, and 91% haven’t a family history of breast cancer, 15% of control is from a family with history of breast cancer while 85 % observed that they have not family history of breast cancer. The difference between the distributions of cases and control about family history of breast cancer is statistically insignificant, with p-value = 0.138
Tumor Stage
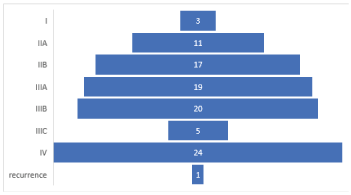
Breast cancer is a malignant tumor of breast tissue suspected in individuals with clinical findings such as a breast lump, breast thickening skin change, or changes on a mammogram. Breast cancer is staged from 0 to IV, with survival dependent upon the stage at diagnosis as we see in (Table 17) and (Figure 16) 24% of cases in stage IV, 20% at stage IIIB, and 1% recurrence, so we need to promote breast cancer education and awareness among the public policymakers, health professional and the media and population.
All variables show significant variation, (Table 18.a), by using Model -1 as follows:
𝑙𝑜𝑔𝑖𝑡 𝑝̂ = 3.678 + (0.546) 𝑎𝑔𝑒 − (0.776) 𝑓𝑎𝑚𝑖𝑙𝑦 ℎ𝑖𝑠𝑡𝑜𝑟𝑦 + (0.616) 𝑐𝑜𝑛𝑡𝑟𝑎𝑐𝑒𝑝𝑡𝑖𝑣𝑒 𝑢𝑠𝑒 +
(0.892) 𝑜𝑐𝑐𝑢𝑝𝑎𝑡𝑖𝑜𝑛 + (1.246) 𝑒𝑑𝑢𝑐𝑎𝑡𝑖𝑜𝑛 𝑙𝑒𝑣𝑒𝑙 − (1.182) 𝑎𝑔𝑒 𝑎𝑡 𝑚𝑒𝑛𝑎𝑟𝑎𝑐ℎ𝑒 − (0.495) 𝑟𝑒𝑠𝑖𝑑𝑒𝑛𝑐𝑒 + (1.5) 𝐵𝑀𝐼 (1)
So, we see in tables (18.b.1, 18.b.2), the model with significant covariate, that the chi-square statistic for the likelihood ratio tests, where pr (c2 ≥ 73.73) = 0.00 with 8 d. f. is highly significant, from table (18.b.3) the p-value of Pearson goodness of fit test equals 0.285 and the p-value of Deviance goodness of fit test is 0.277, this means that the mode is l well fitting. Therefore, the risk factors of breast cancer among the study group are due to these variables: age, family history of breast cancer, contraceptive use, occupation, education level, age at menarche, residence, and BMI. All variables show significant variation, (Table 19.a), by model -2 as follows:
𝐿𝑜𝑔𝑖𝑡 (𝑝̂) = 2.249 + 0.498 age group − 0.903 family history ++ 1.203 education level − 1.1079 age at menarche + 0.234BMI (2)
Finally, we see in tables (19.b.1, 19.b.2), the final model with significant covariate, that the chi-square statistic for the likelihood ratio tests, where pr (c2 ≥ 64.517) = 0.00 with 4 d. f. is highly significant, from table (19.b.3) the p-value of Pearson goodness of fit test equals 0.813 and the p-value of Deviance goodness of fit test is 0.703, this means that the model well fitting. Therefore, the risk factor of breast cancer among the study group due to these variables: age, family history of breast cancer, education level, and age at menarche.
The evaluation of the Model in (Table 19.b.4), showed that R2 = 0.77825 and the adjusted R2 is 0.73390, in addition, the R2 value was good and showed statistically significant forecasts (P-value < 0.05). Important assumptions were made about the relationship between changes in predictor values and changes in response values. Regardless of the R2, the mean change in the answer for a unit of predictor change always reflects the relevant coefficients while other predictors are constant in the model. This type of information will certainly be of enormous value.
Discussion
 Backward elimination was conducted using SPSS version 22 software (SPSS, Inc., Chicago, IL, USA), and logistic regression was analyzed to the factors such as socio- demographic (age and marital status), reproductive (parity, age at first pregnancy, menopausal status and breast-feeding), and BMI. By using logistic regression models, we have found that there is a significant correlation between BMI and an increase in the number of cases of breast cancer (Hopper, 2018), which means that obese women can be at high risk for breast cancer and the results are an alignment with what has been stated by [17]. In addition, mothers with more children played a protective role in our data on breast cancer. Family history, on the other hand, plays a significant role, as in most other reports [4,17]. Family history is a risk factor in previous studies [18], the logistic regression model is one of the best models used to determine risk factors [19].
In the current study, breastfeeding did not play a protective role in breast cancer, since a smaller number of breastfeeding cases were observed. Some studies suggest it is possible to prevent breast cancer by breastfeeding and some studies have shown that breast cancer risk does not affect lactation [20]. Nevertheless, epidemiological studies have indicated that populations with normal long lactation periods pose low breast cancer risks [20]. These conflicting results suggest that the effects of breast cancer risk factors are likely to be small. It is definitely of interest to consider how lactation could help to prevent breast cancer, as it is a modifiable risk factor. Understanding the role of lactation may help us to understand the etiology of a disease of immense importance for public health. The women bearing a greater number of children earlier reported lowering breast cancer [21], menopausal stages affect the risk of breast cancer [22-24].
Conclusion
Based on our data and tables suggested that the risk factor for developing breast cancer was in the age group of 30 – 30, those who are married have a BMI ≥ 30, bear fewer children, not breastfeeding, though showing family history and menopausal status at the age of 46–50 had more number of breast cancer cases, whereas women who are single age less than 30, BMI < 20 has fewer cases of breast cancer, data also suggest us that the women bearing children >10 and also breastfeeding plays as a protective role in developing breast cancer, and also less number of cases were observed with menopausal status at the age > 45 (Table 20).
Acknowledgments
This study was supported by Professor Arthur M. Michalek, Professor of Oncology and Epidemiology, Senior Vice President, and Dean of Educational Affairs, at Roswell Park Cancer Institute, USA. Professor Bassam Ibrahim, Head of Applied Statistics Dept., College of Science, Sudan University of Science & Technology, Sudan.
Declaration of Competing Interest
Author(s) declare that all works are original and this manuscript has not been published in any other journals.
Limitations
We don't interview the subjects face to face, all the information retrieved from the patient’s hospital records, their validity, and standards are open to bias. Recall bias was also expected as regards their date e.g. age, age of 1st pregnancy, number of children, breastfeeding.
Author Contributions Conceptualization
Sawsan Babiker
Data curation
Sawsan Babiker
Formal analysis
Sawsan Babiker
Methodology
Sawsan Babiker
Resources
National Cancer Institute, Gezira University, Medani, Sudan.
Writing – original draft
Sawsan Babiker and Yousif Eltayeb
Writing – review & editing
Sawsan Babiker and Yousif Eltayeb
Appendices
Appendix -1
Methods
We followed the methods of [8]. The relation between the binary variable with one or more explicatory variables is defined by the logistic regression model. The purpose of research with logistic regression is the same as that with a linear regression model in which it is believed that the dependent variable is continuous or distinct. The response variable is usually dichotomous in logistic regression, where the response variable may take value 1 with success probability p or value 0. With probability of failure 1-p. This type of variable is known as a binary. The relationship between predictor and response variables in logistic regression is not a linear function; instead, a logistic regression function is used, given as [9,10,17].
 (1)
(1)
The logit transformation is a transformation of P(x) which is central to our study of logistic regression. This transformation is defined, in terms of P(x), as follows:
 (2)
(2)
Where boand bi are are the logistic intercept and coefficients, respectively.
The parameters in this model can no longer be estimated by least squares, but are found using the maximum likelihood method. The probability of success vs. failure is determined by logistic regression; therefore, the results of the analysis are in the form of an odds ratio. Logistic regression also shows connections between variables and strengths. The Wald statistics are typically used to determine the value for each independent variable of the single logistic regression coefficients. The Wald statistic for the βi coefficient is:
 (3)
(3)
This value is distributed as a chi-square with 1 degree of freedom. The Wald statistic is the square of the (asymptotic) t-statistic. The Wald statistic can be used to calculate a confidence interval for βi. We can assert with 100 (1− α) % confidence that the true parameter lies in the interval with boundaries 
 , where ASE is the asymptotic standard error of logistic
  .
.
Estimates of parameters are derived using the maximum likelihood principle; Hypothesis tests are therefore based on comparisons between probabilities or deviances of nested models. The probability ratio check uses the ratio of the maximized probability value for the complete model (L1) to the maximized probability function value for the simplified model (L0). The likelihood- ratio test statistic equals:
 (4)
(4)
This log transformation of the likelihood functions yields a chi-squared statistic. These are the recommended test statistics for a model with a rear removal process. The reverse removal process seems to be the preferred method of exploratory tests where the study starts with an entire or saturated model and variables in an iterative process are removed from the model. After removing each variable, the model fit is tested to ensure it fits the data properly. If the model cannot remove any more variables, the analysis is complete [15].
Appendix-2
Validation
The validation test was carried out to determine if the study of logistic regression was satisfactory. The estimated accurate case percentage from major samples must be equal to or greater than the actual sample percentage. For calculating the percentage of correct instances, validation uses the other sample data with the same coefficient values as the main data. First, the data were divided into two groups. To determine coefficient values, 80 percent of the first data group was used as the key data. For validating the main results, the second group comprised 20 percent of the samples. The probability of each example from the validated data was determined after the coefficient values were obtained from the main data. Probability was defined as:
 (5)
(5)
The reference probability was defined as:
 , with
 is the intercept coefficient value, whereas
  is the coefficient value of each factor contributing to occurrence with the observed probability, the probability of each test has been cross-validated. The percentage of correct classification cases has been obtained for cross-validation. Next, the correct classification case percentages of validated data are equivalent to the correct classification case percentage of principal data. There were two groups of results. In deciding the logistic regression model, the first 110 samples were taken. To validate the pattern, the remaining samples were used. To assess the percentage of correct classification events, the verified findings were used [5].
Appendix-3
Variable selection
It is critical that the model contains all relevant variables and does not start with more than the number of observations justified [9,10,13]. Additional variables typically produce a better model that fits the data for a dataset. Excessive variables, however, influence the model coefficient and help over fit the model. A complex model with many small variables will lead to less predictive power and make interpreting the results difficult. The statistical variable selection process is based on two procedures. Next, interactions are shown as product terms in the interaction study, which is a concept of the regression model and not a single predictor variable, but rather the product of two predictors [12,14]. Interaction experiments were carried out to determine each variable's important values. Co- linearity analysis is the second method. With the consequent lack of statistical significance, the disparity associated with these coefficients increases [4]. The study of co-linearity was based on essential interaction test values. Each variable must have significant values less than 0.20 [12], used in the study of the logistic regression model [5].
Appendix 4
Distribution of Age groups (cases and control) according to risk factors. Table 21.a,21.b,21.c,21.d,21.e,21.f,21.g
References
- Al DA, Qureshi S, Al Saleh KA, Al Qahtani FH, Aleem A, et al. (2013) Review on breast cancer in Kingdom of Saudi Arabia. Middle-East Journal of Scientific Research 14: 532-543.
- Al-Qahtani MS (2007) Gut metastasis from breast carcinoma. Saudia Medical Journal 28: 1590-1592. [Crossref]
- American Cancer Society (2012) Cancer Facts & Figures. American Cancer Society (ACS), Atlanta.
- Collaborative Group on hormonal factors in breast cancer (2001) Familial breast cancer: collaborative reanalysis of individual data from 52 epidemiological studies including 58, 209 women with breast cancer and 101,986 women without the disease. Lancet 358: 1389-1399. [Crossref]
- Concato J, Feinstein AR, Holford TR (1993) The risk of determining risk with multivariable models. Ann Intern Med 118: 201-210. [Crossref]
- Cox DR, Snell EJ (1989) Analysis of Binary Data. 2nd Edition, Chapman and Hall/CRC, London.
- Ravichandran K, Al Hamdan Nasser, Al Dyab Abdul Rahman (2005) Population-based survival of female breast cancer cases in Riyadh Region, Saudia Arabia. Asian Pac J Cancer Prev 6: 72-76. [Crossref]
- Salah U, Arif U, Najma, Muhammad I (2010) Statistical modeling of the incidence of breast cancer in NWFP, Pakistan. Journal of applied quantitative methods 5: 159-165.
- Austin PC, Tu JV (2004) Automated variable selection methods for logistic regression produced unstable models for predicting acute myocardial infarction mortality. J Clin Epidemiol 57: 1138-1146. [Crossref]
- Hadjisavvas A, Loizidou MA, Middleton N, Michael T, Papachristoforou R, et al. (2010) An investigation of breast cancer risk factors in Cyprus: a case-control study. BMC Cancer 10: 447. [Crossref]
- Collett D (1991) Modeling Binary Data, Chapman & Hall/CRC Texts in Statistical Science, 2nd Edition, London.
- Hosmer DW, Lemeshow S (2000) Applied Logistic Regression. Wiley-Series in Probability and Statistics, A Wiley Inter Science Publication, New York.
- Bagley SC, White H, Golomb BA (2001) Logistic regression in the medical literature: Standards for use and reporting, with particular attention to one medical domain. J Clin Epidemiol 54: 979-985. [Crossref]
- Genuer R, Poggi, Jean-Michel, Tuleau-Malot C (2009) Variable selection using random forests. Pattern Recognit Lett 31: 14.
- Yusuff H, Mohamad N, Ngah UK, Yahaya AS (2012) Breast cancer analysis using logistic regression. IJRRAS 10: 14-22.
- Sudan Household Health Survey (SHHS) 2nd Round 2010 Summary Report July: Federal Ministry of Health, Ministry of Health, Government of South Sudan, Central Bureau of Statistics Southern Sudan Commission of Census, Statistics & Evaluation.
- Elkum N, Al-Tweigeri T, Ajarim D, Al-Zahrani A, Amer SMB, et al. (2014) Obesity is a significant risk factor for breast cancer in Arab women. BMC Cancer 14: 788. [Crossref]
- Braithwaite D, Miglioretti DL, Zhu W, Demb J, Trentham-Dietz A, et al. (2018) Family history and breast cancer risk among older women in the breast cancer surveillance consortium cohort. JAMA Intern Med 178: 494-501. [Crossref]
- Dawood SS, Lei X, Dent R, Mainwaring PN, Gupta S, et al. (2014) Impact of marital status on prognostic outcome of women with breast cancer. Journal of Clinical Oncology Breast Cancer-HER2/ER.
- Lipworth L, Bailey R, Trichopoulos D (2000) History of breast- feeding about breast cancer risk: a review of the epidemiologic literature. J Natl Cancer Inst 92: 302-312. [Crossref]
- Dall GV, Britt KL (2017) Estrogen effects on the mammary gland in early and late life and breast cancer risk. Front Oncol 7: 110. [Crossref]
d
- Chang-Claude J, Andrieu N, Rookus M, Brohet R, Antoniou AC, et al. (2007) Epidemiological Study of Familial Breast Cancer (EMBRACE). International BRCA1/2 Carrier Cohort Study (IBCCS) collaborators group 16: 740-746.
- Hopper JL, Dite GS, MacInnis RJ, Liao Y, Zeinomar N, et al. (2018) Age- specific breast cancer risk by body mass index and familial risk: prospective family study cohort (ProF-SC). Breast Cancer Res 20: 132. [Crossref]
- Ravichandran K, Al-Zahrani AS (2009) Association of reproductive factors with the incidence of breast cancer in Gulf Cooperation Council countries. East Mediterr Health J 15: 612-621. [Crossref]

