The hallucinogenic drug LSD (Lysergic acid diethylamide) is present in global scale among the seized drugs. It is commonly found in blotters, and its detection in the extraction solution by a simple and fast methodology turns into a point of interest, once quickness, specificity and reliability must be associated. In the present work, from a single injection in a High Performance Liquid Chromatograph it is possible to quantify LSD by Diode Array Detection (DAD, λ = 310 nm) and Electrochemical Detection (ECD, 1250 mV) in seized samples in less than 10 minutes, with the same mobile phase composed by ammonium perchlorate. The limits of detection were calculated as 2.14 10-6 mol L-1 and 6.18 10-7 mol L-1, respectively: these results values are equivalent to 4 µg of LSD in a blotter. The methodology was validated and applied in three real samples. Then, it is possible to gather more information from one injection based on distinct detection principles; this advantage is valuable in confirmatory analysis for illicit substances in the routine of a forensic laboratory.
forensic science, lysergic acid diethylamide, forensic chemistry, high performance liquid chromatography, electrochemical detection
LSD is one of the main hallucinogen, and it had been popularized in decade of 1960 due to its recreational use. It is a semi synthetic drug, with an increase of its commercialization by internet market [1-3].
LSD is commonly found in blotter, whose concentration varies from 20 µg to 150 µg [4]. As well as other drugs, once its seizure occurs, a protocol should be followed for confirmatory results about the presence and the quantity of a forbidden substance. This routine analysis usually follows the recommendations from Scientific Working Group for the Analysis of Seized Drugs (SWGDRUG), that presents 3 categories for chemical analysis (Table 1) [5].
Table 1. Some analytical techniques for drug determination used by SWGDRUG (5).
Category A |
Category B |
Category C |
Infrared Spectroscopy |
Capillary electrophoresis |
Colorimetric tests |
Mass Spectrometry |
Gas Chromatography |
Fluorescence Spectroscopy |
Nuclear Magnetic Resonance Spectroscopy |
Thin layer Chromatography |
UV VIS Spectrophotometry |
Raman Spectroscopy |
Liquid Chromatography |
Melt point |
Category A involves the most specific techniques, and category C contains the less ones. For a confirmatory result, laboratories must analyze seized samples by two chemical analyses (one by class A test and other by A, B, or C test) or three exams (two by class B tests and the third by B or C test).
In cases where hyphenated techniques are used (like liquid chromatography-diode array ultraviolet spectroscopy), they will be considered as separate techniques and the results from each are used.
Liquid Chromatography is cited in Category B, and once two different chemical principles for detection are performed, there are two different results provided. Unfortunately, it is not a reality finding in all Brazilian laboratories equipment’s for analysis in category A. Liquid Chromatography is commonly used in laboratories, and new or optimized methodologies for this kind of analysis are helpful [6].
The literature about LSD analysis in seized samples describes methodologies using High Performance Liquid Chromatography (HPLC), with the fluorescence detection as the most suitable, because of its sensitivity. Diode Array Detection (DAD) is presented as an alternative option [7]. Electrochemical detection (ECD) has not been widely explored for quantification of LSD in seized samples: Jane, I. et al [8] describes a methodology for alkaloids drugs – including LSD - in urine samples.
ECD is seen as an alternative for detection based on optical principle: indeed, electro analysis applied to forensic purposes has been showing its potential due to the highly sensitivity on analytical techniques involved in electrochemistry [9].
The use of HPLC in forensic researches, specifically for drug analysis involves various validated methodologies when there is a quantification purpose [10,11]. HPLC - ECD has been explored for detection of drugs and explosives substances [12], but there is a lack of works focused on the analysis of illicit drugs in seized samples.
In this article, the possibility of gathering more information from one injection based on two detections (UV VIS and electrochemical) was explored in a sequential mode. Firstly, it is proposed various adaptations (mobile phase, stationary phase, preparation of solutions for analytical curve and others parameters) for optimization in DAD methodology already reported in literature and then, with the same condition, a quantification of LSD by ECD is developed for its determination in seized samples. The results for this last detector, is new information about the electrochemical response of LSD.
All research developed was performed using commercial standard solution of LSD (1000 ppm) in acetonitrile (Cerilliant, Round Rock, EUA). All diluted solutions were prepared in the same day of the analyses, using non fluorescent lamps in the laboratory, due to photosensitivity of this substance. Two different solvents were tested as diluents: acetonitrile (Sigma Aldrich, St. Louis, EUA) and hydroalcoholic solution containing methanol:water 1:1 v/v.
Seized blotters were obtained from a partnership between this research group and the criminal experts of laboratory of toxicological analysis – Institute of Criminalistics – in Ribeirão Preto city – São Paulo, Brazil. These seized samples were colorful squares of about 0.5 cm x 0.5 cm.
The extraction procedure followed the methodology proposed by literature, with a methanol (HPLC grade, Merck, Darmstadt, Deutschland) and water (MilliQ) solution (1:1 v/v) in an ultrasonic bath for about 18 minutes [13]. This procedure was performed in an incandescent light room and the temperature was set in 24ºC, to avoid degrading LSD.
These solutions were also analyzed in a MS system, composed by the quadrupole Mass Spectrometry Xevo TQ-S (Waters Corporation, Milford, EUA) in full scan mode (from 100 to 1000 mass unity), with the blank extraction solution and standard solution for comparison. Inside electronspray source, 2 mL of water/methanol + 0.1% formic acid (Merck) mixture was directly injected. The instrument operated in positive scan, with Z spray ionization source (150ºC; capillary voltage 3.20 kV, source offset 60V), in 0.1 mL min-1 flow rate. Nitrogen gas for desolvatation gas flowed in 700 L h-1 at 250ºC.
The use of mass spectrometry technique allowed the detection of the presence of LSD in seized samples, once a scan analysis was performed. Then, HPLC measurements were employed in LSD for its quantification. For these purposes, a HPLC (Ultimate3000, Thermo Scientific, Waltham, EUA) coupled to DAD (λ 310 nm) and ECD (Coulochem III) was employed in these measurements, with a Gold Amino column (5 µm, 250 x 4.6 mm Thermo Scientific) as stationary phase at 30ºC. The sampler was conditioned at 10ºC.
The ECD configuration contains graphite as working and auxiliary electrodes and palladium as reference electrode. The electrical potential was set in 1250 mV vs. Pd.
The mobile phase for both methodologies was composed by a mixture in 81:4:15 v/v/v proportion of 0.01 mol L-1 ammonium perchlorate (JT Baker) in methanol:acetonitrile:water. An isocratic procedure of 10 minutes run with a 0.55 mL min-1 flow rate was used in all measurements with the volume injection of 20 µL. The ammonium perchlorate was employed as supporting electrolyte, and its pH was measured as a value that varied between 5.7 and 6.1.
The choice of the potential set in ECD is a consequence of the result observed in Cyclic Voltammetry for a system composed by ammonium perchlorate 0.01 mol L-1 in methanol as supporting electrolyte, a disk of graphite (4 mm) as the working electrode, Ag/AgCl as the reference electrode and a Platinum wire as the counter electrode. All measurements were performed in a potentiostat Autolab PGSTAT128N (Metrohm, Herisau, Switzerland) in a range from 0 to 1.8 V in a scan rate of 10 mV s-1 .
Setting potential in ECD in 1250 mV is due to its voltammetric behavior observed in Figure 1. The anodic peak observed in 1630 mV indicates the potential where there is an oxidative process in the molecule. Then, it was applied the correction value (the potential observed in voltammogram subtracted by 400 mV) for the difference between the material of the reference electrode (Ag/AgCl in voltammetric system for the Pd in HPLC system).
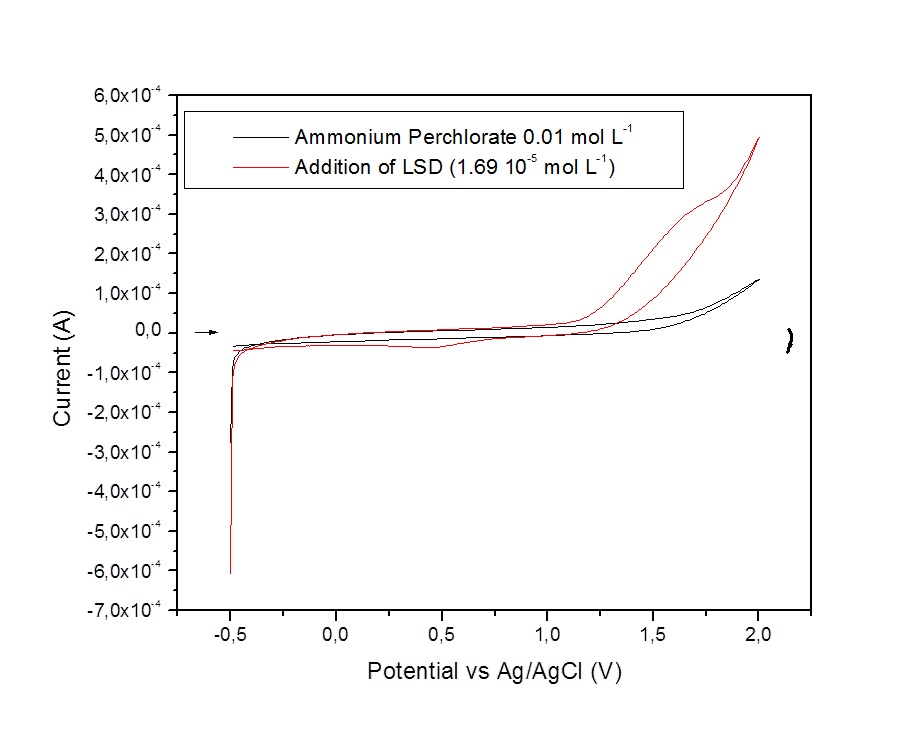
Figure 1. Voltammogram for the presence of LSD in ammonium perchlorate 0.01 mol L-1 for graphite as working electrode; scan rate 10 mv s-1.
This value stablished in 400 mV as the conversion is justified by the values for redox reactions in Ag and in Pd, the elements in reference electrode for voltammetric system and electrochemical detection in HPLC, respectively. Once it is known the potential whereas the oxidation in molecule may occur, the electrochemical cell might supply the energy need to its reaction.
Firstly, it was possible to observe the difference between the solvent in standard solution and the one used for extraction in seized samples. Then, it is important to verify if any difference is observed in chromatographic profile during the development of methodologies, as part of specificity study. Both of detections methods presented different chromatographic profiles between LSD diluted in acetonitrile and LSD diluted in extraction solution. In the second option, a higher and better defined signal is observed, according to Figure 2.
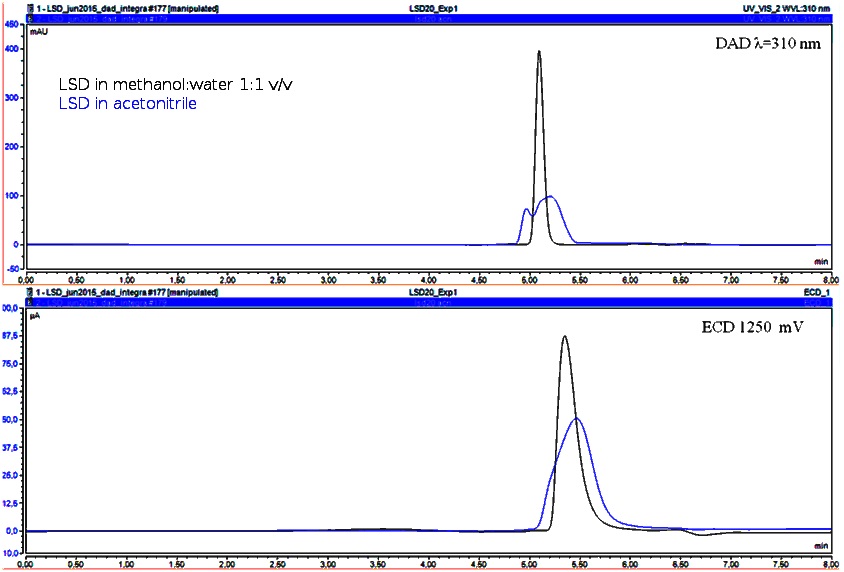
Figure 2. Chromatograms comparing LSD (20 µg g-1) in different solvents: acetonitrile (a) and blank solution for extraction (b).
Through an analysis by Mass Spectrometry, it is possible to verify if there was any structural change, such as an epimerization, due to influence of solvent [14,15]. In the same concentration of LSD established in 10 µg g-1, two solutions were prepared using the standard solution diluted in acetonitrile and in mixture of methanol and water. The same solutions were analyzed in two different moments: as soon as the solution were prepared and after 10 days, stored, in amber flasks in refrigerator. The results obtained for this test are presented in Figure 3.
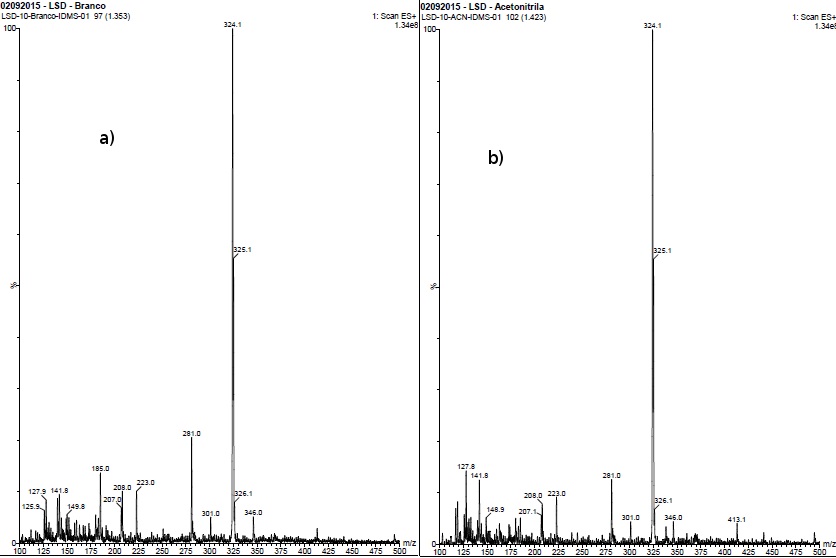
Figure 3. Mass spectrums corresponding for standard solution prepared 10 days before, diluted in acetonitrile (a) and blank solution for extraction (b).
No difference were verified between mass spectra, as the signal mass/charge 324.3 keeps in each spectrum profile even after 10 days, without the presence of any other signal. The molecular weight of LSD molecule is equal to 323.4 g mol-1, and from these results, it is possible to conclude no other derivative was formed, nor instantly neither during 10 days later. If any derivative, such as lumi–LSD, could be produced, a signal corresponding to a greater mass/charge value would be observed.
Then, this change in solvent for analytical curve and sample analysis was the first experimental aspect to the adaption to DAD methodology, and this fact has not been explored before in literature. The presence of water in the mobile phase and the use of a Gold Amino chromatographic column are responsible for the new results obtained in this study. Moreover, once the extraction procedure described in literature shows the presence of water as a factor for better efficiency, it might be present in mobile phase.
Considering DAD, this change in solvent for preparing standard solution had more impact in comparison to ECD. The absorption in UV VIS range observed in molecule by LSD molecules is due to unsaturated bonds, so the aromatic structure is considered as the responsible for the signal in DAD [16].
The literature describes a procedure with a mobile phase containing 100% of ammonium perchlorate in methanol, in the same concentration used in this article, and a C8 stationary phase without any chemical modification [7]. This methodology was pointed as an alternative for fluorescence detection in the same experimental condition, but with worse selectivity and specificity, when compared with this detector.
The equation that describes the linear relation between chromatographic signal (mAU*min) and levels of LSD (mol L-1) is: Area signal = 452281.42 [LSD] + 0.219. Figure 4 shows the response and analytical curve for DAD, which linearity was 0.9957.
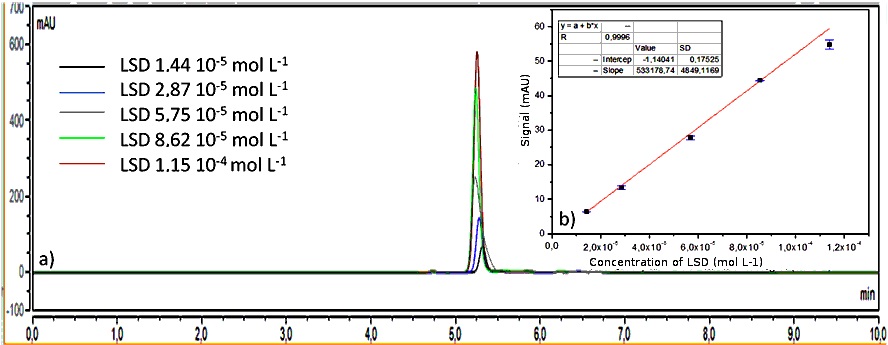
Figure 4. Successive chromatograms obtained by HPLC DAD for different concentrations of standard solutions of LSD in methanol:water 1:1 v/v. The analytical curve is also presented with respectively standard deviations for each level.
One advantage in using DAD is the possibility to get a broad UV VIS spectrum of the analyte, and this tool provides qualitative information about the presence of LSD in seized samples.
From the same procedure, it was possible to analyze LSD by ECD in the sequence. It is known indolic structure in LSD molecule (and its derivatives) is the core of an electrochemical reaction, responsible for an oxidative signal. As it has been observed in literatures that have explored the electrochemical behavior of lysergic acid and LSD, perchlorate salts have been showing the best performance as supporting electrolyte [17,18].
These electrochemical studies were performed using glassy carbon as working electrode, whilst the present work has graphite as working electrode. The difference of the composition in reference electrode implies in different potential to be applied in the electrochemical system, due to the redox reaction that occurs in each element.
As it was mentioned, methodologies reported in literature for electrochemical detection had not provided satisfactory results because of high noise in chromatogram and poor selectivity (07). However, the changes proposed in the present article have resulted an analytical curve with satisfactory linearity (R2 equal to 0.9979), with the following equation describing the relation between current signal (µA*min) and concentration of LSD (mol L-1) Areasignal = 260311.91 [LSD] – 0.112, according to Figure 5.
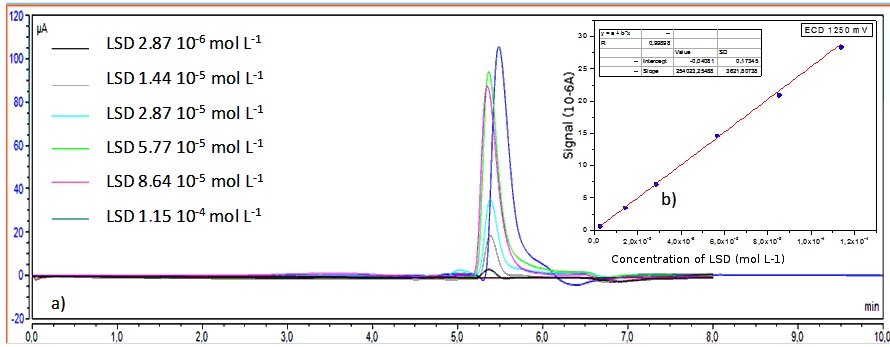
Figure 5. Successive chromatograms obtained by HPLC ECD for different concentrations of standard solutions of LSD in methanol:water 1:1. The analytical curve is also presented with respectively standard deviations for each level.
Finally, differently to what the literature presents, this electrochemical detection is referred to a working electrode made of graphite, and not glassy carbon, using a chromatographic column with more polar interaction as the predominant characteristic. Other aspects such as adaptations in mobile phase are factors that influenced for a satisfactory performance of this electrochemical detection, with chromatographic resolution better than these registered in literature.
The importance of the present methodology is the possibility of getting two reliable results from the same injection in HPLC equipment with two different detectors in sequence. Both of the detection (DAD and ECD) have satisfactory results in their analytical parameters. Moreover, the problems reported for ECD detection are resolved.
Table 2 compares the present methodology to others found in literature for analysis of LSD in blotter samples. Not all the methodologies present all analytical parameters, as some of them had a more qualitative purpose in the determination of LSD.
Table 2. Comparison between liquid chromatographic methodologies to detect LSD in seized samples, for DAD and ECD.
Reference |
Detection |
Condition |
Mobile phase |
Stationary phase |
Flow (mL min-1) |
[7] |
DAD |
280 nm |
Methanol and Na2HPO4 (pH 8.0) |
Reverse Phase -C18 |
1.0 |
[7] |
DAD |
313 nm |
NH4ClO4 in methanol and NaOH (pH 6.7) |
Normal phase – Spheriborb S5W |
2.0 |
[8]* |
ECD |
800 mV |
NH4ClO4 in methanol and NaOH (pH 6.7) |
Spheriborb S5W |
2.0 |
[6] |
DAD |
220 nm |
Methanol: acetonitrile and ammonium carbonate (pH 8) |
C8 |
0.8 |
[19] |
DAD |
220 nm |
Phosphate buffer in water: methanol (pH 8) |
C18 |
2.0 |
[20] |
DAD |
220 nm |
methyl-tertbutyl
ether/isopropanol |
APS hypersil |
1.5 |
Present methodology |
ECD |
1250 mV |
NH4ClO4 in methanol: acetonitile: water pH 5.7-6.1 |
Gold Amino |
0.55 |
Present methodology |
DAD |
310 nm |
*Analysis of LSD extracted from urine sample
Validation is an important requirement when some changes are included to a methodology and a new one is proposed. In this case, both of these situations are present.
Inside validation study, it was considered the limit of detection (LD) and limit of quantification (LQ) as 3*σ/m and 10*σ/m, respectively, being σ the standard deviation obtained after linear fitness in the analytical curve for the linear coefficient, using software such as OriginProLab 8.0, and m the sensitivity, which is verified by angular coefficient obtained in analytical curve. Then, sensitivity is explored as being the value in signal (in mAU or ampere, according to the detector) gained per unit of concentration of the LSD added to the system, in mol L-1 [18].
The concentration of LSD can vary from 20 µg to 150 µg, and when the methodology for blotter extraction used in this work, there are a variation from 1.03 10-5 to 7.73 10-5 mol L-1, considering the density of the mixture methanol:water 1:1 v/v equal to 0.92 g mL-1. This value was obtained due to an experiment with the picnometer in triplicate.
According to literature about validation procedures (EURACHEM, AOAC, INMETRO) [21-23], selectivity is verified by studying its ability to measure the analyte of interest in samples with interferences, those are thought likely to be present in samples. For this study, a seized sample without the presence of LSD (verified previously by its mass spectrum) is fortified with the addition of the standard solution. Then the final solution contains many substances from the extraction process – such as ink used to stamp blotters and components from paper - and the main analyte.
Besides, a standard solution with the same concentration of LSD in methanol:water is also analyzed and quantified. The aim of this experiment is verifying if the interference of other components in sample matrix could affect the chromatographic signal.
As Figure 6 illustrates, there is no interference of other compounds present in blotter in the signal corresponded to LSD nor in its intensity, nor in the retention time.
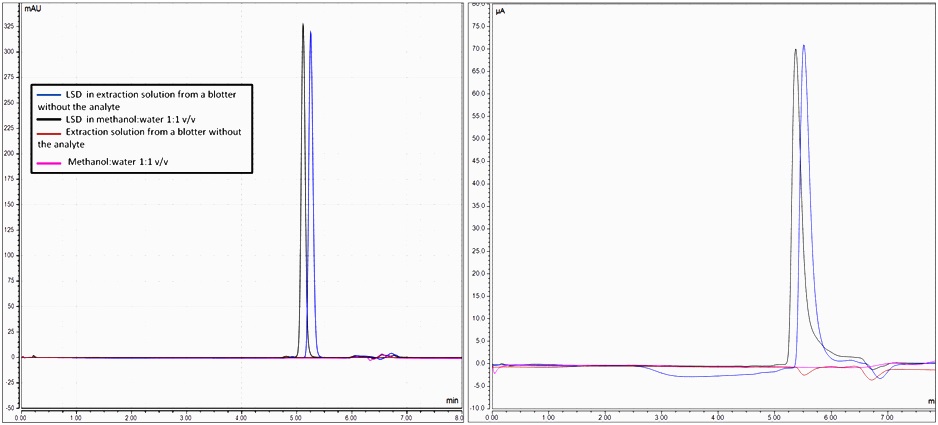
Figure 6. Chromatograms for specificity of LSD 5.75 10-5 mol L-1 diluted in solution for extraction and in a solution from the extraction of a blotter without the presence of LSD. The blank results for both solvents are also registered.
The linear range was established as being from the limit of quantification until 1.15 10-4 mol L-1, since it was observed that above this level, there is not any linear response between the signals (for DAD and ECD) and concentration of LSD.
The Table 3 summarizes the figures of merit calculated for both methodologies, being also a comparison between the detections. The study of specificity is accomplished by an analysis of Test F, comparing the areas integrated for each case. In both of the detectors, the ratio calculated between these areas is below the value known in theory (4.28). Then, it is proven the other components present in blotter - and so, in solution obtained from its extraction-, do not interfere in chromatographic signal.
Table 3. Analytical parameters calculated for each detector.
|
HPLC DAD |
HPLC ECD |
LD |
6.18 10-7 mol L-1 |
2.14 10-6 mol L-1 |
LQ |
2.06 10-6 mol L-1 |
6.47 10-6 mol L-1 |
SDR |
2.41% |
1.69% |
Interday assay |
1.11% |
2.30% |
Linearity (R2) |
0.9957 |
0.9979 |
Sensitivity |
452281.42 mAU min L mol-1 |
260311.91 µA min L mol-1 |
Recovery |
100.69% |
95.98% |
Linear Range (mol L-1) |
2.06 10-6 to 1.15 10-4 |
6.47 10-6 to 1.15 10-4 |
Specificity (S)* |
2.37 |
3.01 |
* Coefficient S is compared to F test value
2021 Copyright OAT. All rights reserv
Although the values obtained for LD and LQ in case of ECD were higher than those obtained for DAD, they are lower than the lowest concentration of LSD usually found in blotters (20 µg). It is important to mention the suitability of both detections to forensic routine, once the sensitivity and specificity were exposed as being satisfactory. Then, the present study proposed an adaption to DAD methodology and proposes a new ECD one, as alternatives to fluorescence detection.
The samples were analyzed by Mass Spectrometry for getting preliminary information about the presence of LSD in any of them (by verifying the presence of the signal mass/charge 324.3). In this analysis, the sample blank solution (containing methanol and water) and a standard solution of LSD had keep up with the sample for comparison purposes. In this way, it was found the presence of the drug just in one of the blotters.
For this real sample containing LSD, the major absorbance of the molecule is in the same wavelength observed for the standard solution of LSD, as it is illustrated in Figure 7.
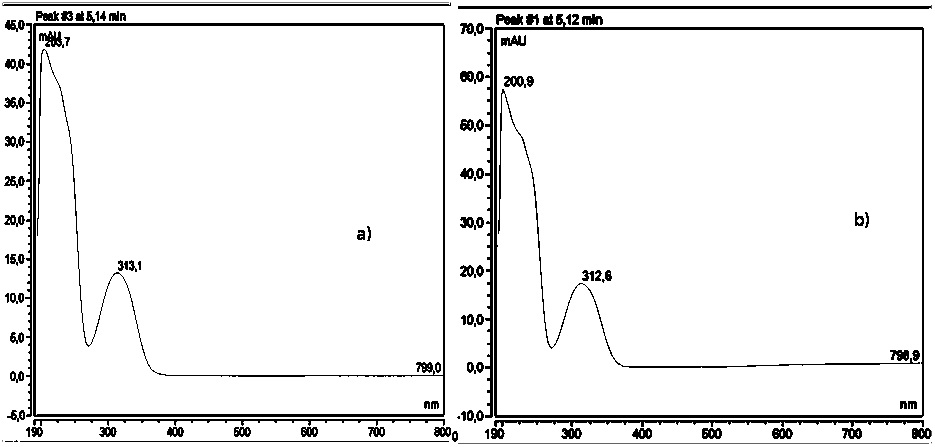
Figure 7. UV VIS spectrums for seized sample and standard solution of LSD.
The sample with positive result for LSD by mass spectroscopy technique presented good signals in both DAD and ECD detectors. From the analytical curves established for both detectors, the quantity of LSD in the sample was 20.36 ± 0.101 (DAD) and 22.79 ± 0.112(ECD). The retention time corresponded to each signal were in agreement to those obtained with standard solution. It is possible to verify the results obtained are similar from each other, and so were the negative results. As negative results from mass spectrometry were obtained for some sample, the same absence of LSD was observed by HPLC (DAD and ECD) and in their UV VIS spectrum.
This study proposes a same methodology that provides two different detections, from distinct chemistry principles: light absorbance (DAD) and electrochemical (ECD) detection. This fact outcome in an alternative procedure for a fast analysis, once a complete chromatographic run is obtained in less of 10 minutes, and it is possible to gather trustful results from validated methodologies. The procedure for DAD was optimized for better results in its analytical parameters. As consequence, the routine of a forensic laboratory might be optimized.
The authors thank to Polícia Científica do Estado de São Paulo for the partnerhip.
The authors also thank to the engineers Tiago Priolli Monteiro and Rodrigo de Castro Baker Botelho for helping in data analysis.
The authors thank to Polícia Científica do Estado de São Paulo for the partnerhip, Conselho Nacional de Desenvolvimento Científico e Tecnológico (CNPq), Fundação de Amparo à Pesquisa do Estado de São Paulo (FAPESP – Process 2016/23825-3), and Coordenação de Aperfeiçoamento de Pessoal de Nível Superior (CAPES – Pró Forense 25/2014) for financial support.
- Global Drug Survey 2015. GDS 2015 by Adam Winstock. Available in http://www.globaldrugsurvey.com/the-global-drug-survey-2015-findings/..
- Halpern JH (1996) The use of hallucinogens in the treatment of addiction. Addict Res 4: 177-189
- Hoffman A (1980) LSD – My problem child. New York: McGraw-Hill pp. 209.
- Drummer O, Odell M, Drummer OH (2001) The forensic Pharmacology of drugs of abuse. Arnold Press: 480.
- Scientific Working Group for The Analysis of Seized Drugs. Recommendations version 7.0. SWGDRUG, 2014. pp 79.
- Marinho PA, Leite EMA (2010) Quantification of LSD in illicit samples by High Performance Liquid Chromatography Braz. J Pharm Sci 46: 695-703.
- Division of Narcotic Drugs (1989) Recommended Methods for testing Lysergide (LSD) - Manual for use by National Narcotics Laboratories. United Nations 25.
- Jane I, Mckinnon A, Flanagan RJ (1985) High Performance Liquid Chromatographic analysis of basic drugs on silica columns using non aqueous ionic eluents. Part II: Application of UV, fluorescence and electrochemical oxidation detection. J Chromatogr 323: 191-225.
- Cumba LR, Smith JP, Zuway KY, Sutcliffe OB, do Carmo DR, et al. (2016) Forensic electrochemistry: simultaneous voltammetric detection of MDMA and its fatal counterpart "Dr Death" (PMA). Anal Methods 8: 142-152.
- Li L (2016) Direct enantiomer determination of methorphan by HPLC-MS and SFC-MS. Forensic Chemistry 2: 82-85.
- de Figueiredo NB, Oiye EN, de Menezes MMT, de Andrade JF, Silva MCB, et al. (2010) Determination of 3,4-methylenedioxymethamphetamine (MDMA) in Confiscated Tablets by High-Performance Liquid Chromatography (HPLC) with Diode Array Detector. J Forensic Res 1: 106-109.
- Tarvin M, McCord B, Mount K, Miller ML (2011) Analysis of hydrogen peroxide field samples by HPLC/FD and HPLC/ED in DC mode. Forensic Sci Int 209: 166-172. [Crossref]
- Veress T (1993) Study of the Extraction of LSD from Illicit Blotters for HPLC Determination. J Forensic Sci 38: 1105-1110. [Crossref]
- Crews C (2015) Analysis of Ergot Alkaloids. Toxins 7: 2024-2050. [Crossref]
- Niwaguchi T, Inoue T (1971) Photodecomposition of Lysergic Acid Diethylamide (LSD). Proc Jpn Acad 4: 747-750.
- Bowen JM, Mcmorrow HA, Purdie N (1982) Quantitative Determination by Circular Dichroism of Lyserglc Acid Diethylamlde in Confiscated Material. J Forensic Sci 27: 822-826.
- Merli D, Zamboni D, Protti S, Pesavento, Profumo A (2014) Electrochemistry and analytical determination of lysergic acid diethylamide (LSD) via adsorptive stripping voltammetry. Talanta 130: 456-461.
- Inczeffy J, Somodi ZB, Pap-Sziklay Z, Farsang G (1993) The study of the differential pulse voltammetric behaviour of ergot alkaloids and their determination by DC amperometric detection in a FIA system. J Pharm Biomed Anal 1: 191-196.
- Gill R, Key JA (1985) High-performance liquid chromatography system for the separation of ergot alkaloids with applicability to the analysis of illicit lysergide (LSD). J Chromatogr 346: 423-427.
- Japp M, Gill R, Osselton (1987) The Separation of Lysergide (LSD) from Related Ergot Alkaloids and Its Identification in Forensic Science Casework Samples. J Forensic Sci 32: 933-940.
- Association of Official Analytical Chemists (2002) AOAC Official methods of analysis. Appendix D: guidelines for collaborative study procedures to validate characteristics of a method of analysis. Washington: AOAC.
- EURACHEM (2012) CITAC Guide CG 4: Quantifying Uncertainty in Analytical Measurement. 3rd Ed. 141p.
- Wood R (1999) How to validate analytical methods. Trends in analytical chemistry. 18: 624-632.