Abstract
“Dangerous trends” toward a “culture of narcissism” have been forecast from allegedly rising Narcissistic Personality Disorder among younger generations. However, the best indexes show these negative trends not materializing. Instead, key risk behaviors among young people have improved dramatically, a point now acknowledged by many researchers. What, then, do narcissism inventories and trends measure at the population level? This paper uses NPD prevalence by age, race, and gender to examine the much higher (but rarely-discussed) NPD prevalence among African Americans and, to a lesser extent, other minorities compared to whites. That NPD trends fail to predict social trends and are strongly connected to socioeconomic status indicate the index is capturing traits unrelated to traditional concepts of narcissism.
Key words
narcissism, age, race, social trends
Introduction
“Narcissistic personality disorder (NPD) is characterized by a pervasive pattern of grandiosity, need for admiration, interpersonal exploitiveness, and lack of empathy” [1,2]. Modern young people display considerably higher scores on certain Narcissistic Personality Inventory (NPI) and related indexes than do past or older generations, a trend receiving considerable attention in scholarly papers [3-5] and popular media [6-9]. Alarms have been raised that allegedly increasing NPD among modern young people reveals “a profound shift in American character” bringing “new… dangerous trends” toward more “shoplifting, fighting, or having unprotected sex” and materialism, obsession with fame, inflated and unrealistic expectations, hookups and fewer boyfriend-girlfriend relationships, more gambling, cheating, depression and loneliness, and more aggression, violence, and crime, “a society of dropouts,” and other “dangers that were once unknown” [7,9]. A narcissistic “society would have high crime rates—white collar and violent—as people take whatever they feel entitled to” and would be “obsessed with power, status and appearance” [3,10]. In short, “egos inflating over time” and “the implications of the rise in narcissism may be … negative for other people, for society, and for the individual in the long term” [11].
However, rising narcissism prevalence on NPI and related indexes may be an artifact of the lack of reliable and consistent measures over time [5,12]. Further, of those key behaviors for which reliable trends can be determined, the best measures indicate that the most worrisome, “dangerous trends”—the ones predicted to operationalize the accumulation of increasing NPD at the individual level to produce a larger “culture of narcissism” at the societal level—are not occurring. “In direct contradiction to Twenge’s claims, rates of risk behavior have undergone a remarkable decline in the past 20 years over a wide range of behaviors … At the same time, emerging adults today show unprecedented acceptance for people who are different from themselves and are participating in community service at record high rates” [12]. Comprehensive analyses show violent crime, property crime, other criminal arrest, early pregnancy, homicide, rape and sexual assault, robbery, suicide and risk-indicated fatalities and injuries, violent deaths, school dropout, and related troubles have declined sharply among children, teenagers, and young adults in recent years to among the lowest levels ever reliably recorded, while high school graduation, college enrollment, community volunteerism, and voting have risen[1] [12-15].
While these measures assess major outcomes and cannot address all issues allegedly related to narcissism, including subtler trends such as the increasing prevalence of unusual names or personal pronoun use [4], they do indicate that society as a whole is not succumbing to new and dire epidemics. In fact, Twenge [16] recently acknowledged that narcissism has “nothing to do with… teen pregnancy, alcohol use, voting, (or) being close to parents”; in fact, “youth crime…is down.”
What tangible outcomes do modern NPD trends have “to do with,” then? The overwhelming majority of citations in popular works on narcissism refer to selected personal anecdotes, incidents from “pages of magazines” and “watching TV,” and quotes from teachers and other grownups praising past and older generations as variously superior to students and other “young people today” (similar to those found in any era) as evidence for rising anxiety, depression, materialism, loneliness, entitlement, obsession with appearance, cynicism, alienation, external locus, and similar correlates of narcissism afflicting “Generation Me” [7-9]. This indicates the lack of consistent, general measures of these traits over time. Even in reviewed papers on narcissism and its correlates, researchers who chart a particular attitude or psychological trait do not substantiate from independent outcome measures that the expected anti-social trends are increasing. These anomalies raise questions of whether we understand what NPI scores really mean.
Part of the difficulty in interpreting larger trends is that investigators have not supplied a mechanism that would be reliably associated with, let alone shown to be a causal factor in, increasing NPD prevalence. For example, Twenge [9] does not show that the school self-esteem curriculums she holds principally accountable (or other cultural factors such as unusual child names or reality televisions shows) were sufficiently pervasive, coincident with rising NPI scores, and significantly associated with differential NPD effects to produce the generation-wide effects postulated.
Beyond popular representations, does the NPI in today’s diverse society measure the same things it purported to measure in the more segregated, monocultural societies of the past? Is the NPI culturally and racially biased, rendering it more prone to mismeasure in today’s increasingly diverse multiculture in which self-worth is gained more by individual achievement than by ascribed race or group status? That African Americans, and other minorities to a lesser extent, have substantially above average prevalence of NPD—indicated on both the definitive National Epidemiologic Survey on Alcohol and Related Conditions [1] and independent surveys of NPD and related indexes [2] —has largely been ignored in popular and mainstream scholarly discourse, though it has gained considerable notice among white supremacists [17]. What factors, including flaws in the NPI and related indexes that capture social-class and demographic tendencies rather than narcissistic psychological traits, require further investigation?
This paper focuses on a question that has received little attention: do higher NPI scores among younger ages reflect their young age and deleterious modern trends, or persistently high poverty rates among the young and a growing generational gap in economic well-being? The hypothesis is that modern NPI scores, for poorly understood reasons, inadvertently capture a mix of socioeconomic, gender, racial, and age/generation factors that are not connected to clinical NPD or newly postulated “cultural narcissism.” This “disconnect” is why NPD prevalence levels have failed to correlate with, predict, or explain expected social outcomes.
Methods
The Wave 2 National Epidemiologic Survey on Alcohol and Related Conditions, including NPD, obtained responses from 34,653 respondents selected to be representative of the United States population [1]. A query to authors produced a more detailed breakdown of NPD responses by age group, gender, and race and Hispanic ethnicity that produced 40 separate cells (five races/ethnicities by four age groups), including 20 for each gender. These were compared to corresponding measures of economic well-being in several ways. Poverty rates by age groups, gender, and race/ethnicity were calculated for each of these 40 cells from detailed American Factfinder, Bureau of the Census [18] tabulations. Similarly, median annual income levels for the 1970-2012 period were extracted from American Factfinder [18] and used to calculate the ratios of median income for under-35 and 35-older householders to that of all ages over the period. Finally, trivariate regression analysis compared the significance and contribution of the independent predictors of age and poverty level to explaining the variances in the dependent criterion, NPD prevalence by age group and race/ethnicity for each gender.
Results
Economic and demographic relationships to NPD prevalence
Table 1 shows that young people, males, African Americans, and, to a lesser extent, other minorities have higher prevalence of lifetime NPD than do older people, females, and non-Hispanic whites, respectively. African Americans’ narcissism scores averaged 2.3 times higher than for whites. Hispanic, Native, and Asian Americans also scored higher than whites. Poorer respondents (those with household incomes below $35,000 per year) also showed higher NPD prevalence than wealthier ones (not shown).
Table 1. Lifetime Prevalence of DSM-IV Narcissistic Personality Disorder and Sociodemographic Characteristics and Sex
Demographic |
Percent (weighted) |
N |
All |
20-29 |
30-44 |
45-64 |
65+ |
All ages |
6.2% |
9.4% |
7.1% |
5.6% |
3.2% |
34,653 |
Black |
12.5% |
16.8% |
12.4% |
11.9% |
7.8% |
6,587 |
Hispanic |
7.5% |
8.8% |
7.7% |
6.9% |
5.2% |
6,359 |
Native |
7.1% |
10.7% |
10.3% |
5.3% |
3.0% |
578 |
Asian/PI |
5.4% |
8.6% |
4.8% |
5.5% |
1.4% |
968 |
White |
5.0% |
8.0% |
6.0% |
4.5% |
2.6% |
20,161 |
N |
34,653 |
4,913 |
10,603 |
11,960 |
7,177 |
|
|
Male |
7.7% |
11.5% |
8.3% |
7.0% |
4.3% |
14,564 |
Black |
13.5% |
19.5% |
12.6% |
12.8% |
8.2% |
2,326 |
Hispanic |
8.3% |
12.0% |
7.2% |
6.7% |
6.2% |
2,719 |
Native |
9.5% |
15.6% |
13.1% |
6.9% |
3.6% |
240 |
Asian/PI |
5.8% |
10.1% |
4.8% |
5.3% |
1.3% |
426 |
White |
6.8% |
9.7% |
8.0% |
6.4% |
4.0% |
8,853 |
N |
14,564 |
2,126 |
4,356 |
5,332 |
2,750 |
|
|
Female |
4.8% |
7.3% |
6.0% |
4.2% |
2.3% |
20,089 |
Black |
11.6% |
14.5% |
12.2% |
11.2% |
7.6% |
4,261 |
Hispanic |
6.8% |
5.2% |
8.3% |
7.0% |
4.3% |
3,640 |
Native |
5.2% |
6.3% |
8.3% |
3.5% |
2.6% |
338 |
Asian/PI |
5.0% |
7.0% |
4.7% |
5.7% |
1.4% |
542 |
White |
3.3% |
6.3% |
4.1% |
2.7% |
1.6% |
11,308 |
N |
20,089 |
2,787 |
6,247 |
6,628 |
4,427 |
|
Figures 1a and 1b show the pattern of narcissism closely resembles the pattern of poverty for White, Black, and all Americans by race and age. Figure 1c illustrates the relative decline in median household incomes (in real dollars) for Americans age 18-24 from 0.76 of the national average in 1970 to 0.64 in 2015 as the incomes of householders ages 45 to 64 rose from 1.17 of the national average to 1.21, with ages 25-44 in between. While older householders had incomes 54% higher than younger ones in 1970, that age gap widened to 89% by 2015. This net economic decline also accompanied an increase in the proportion of the younger population classified as non-Hispanic white, from around one-fifth in 1970 to nearly half by 2015, a racial shift much greater than recorded among older ages [18]. The purported rise in NPI scores among younger ages over the last two generations corresponded to a period of relative economic decline among younger ages relative to older ones.
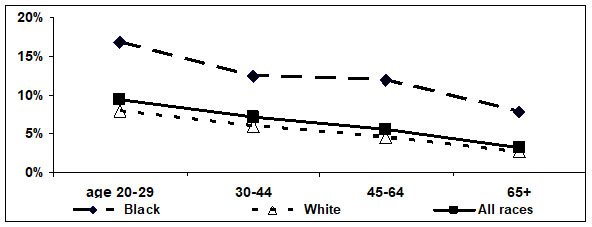
Figure 1a. Narcissism prevalence by race and age
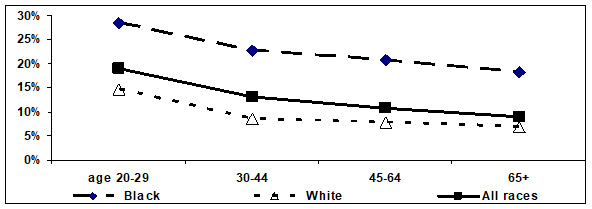
Table 1b. Percent living in poverty by race and age
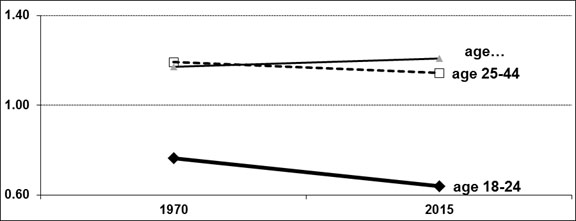
Figure 1c. Ratio of median household income of householders ages 18-24, 25-44, and 45-64 to all householders, 1970-2015, in constant dollars
Age versus poverty level in NPD variance (Table 2)
Table 2. Regression of poverty and age on Narcissistic Personality Disorder prevalence by gender
|
R |
Adjusted R2 |
Beta |
t |
p |
Female |
Age |
0.490 |
0.198 |
-0.215 |
-1.196 |
0.248 |
Poverty |
0.721 |
0.494 |
0.627 |
3.492 |
0.003 |
Age + Poverty |
0.747 |
0.506 |
|
0.945 |
0.358 |
Male |
Age |
0.697 |
0.457 |
-0.697 |
-4.123 |
0.001 |
Poverty |
0.689 |
0.446 |
0.689 |
4.039 |
0.001 |
Age + Poverty |
0.834 |
0.660 |
|
3.790 |
0.002 |
Whether NPI scores are associated more with age or with poverty characteristics connected to their age and race/ethnicity is further assessed by regression analysis, whose results are shown in Table 2. For females, poverty level was associated with 49% (r2=0.494, p=0.003, 18 dof) of the variance in NPI scores by age and race/ethnicity, considerably more than was associated with age, 20% (r2=0.198, p=0.248). When the two independent variables were included in the equation, poverty remained strongly significant but age was not a significant predictor of female NPD prevalence. For males, age and poverty level contributed equally, explaining 46% (r2=0.457, p=0.001, 18 dof) and 45% (r2=0.446, p=0.001), respectively, of the variance in NPI scores by age and race/ethnicity, both strongly significant. Because of the overlap between the two variables, variations in age and poverty level together were associated with 51% of the variance in NPD scores among women and 66% among men; the association was significant for men but not for women. This indicates that individual and unknown factors remain associated with substantial proportions of the variance in NPI scores.
Discussion
The purpose of this paper is to complicate the popular discourse (a) that increased Narcissism Personality Disorder as measured on certain indexes represents a mass psychological trend produced by modern cultural factors such as media, advertising, entertainment, educational, peer, and childraising themes that particularly affect young people, and (b) that these developments are driving larger, negative social trends that would be predicted from clinical NPD criteria. The discourse on narcissism has taken two principal forms. Popular works claiming widespread dangers from rising narcissism [6-9] are based heavily on personal anecdotes and quotes from individuals and popular media sources that are not supported by research. In turn, journal and conference papers asserting troubling narcissism trends rely almost exclusively on popular media content analyses and selected self-reporting surveys and psychological inventories [3,7,19] that are contradicted by other self-reporting indexes and by more reliable outcome measures.
NPD and social outcomes
Key outcome measures consistently show that the trends predicted to accompany rising NPD are not occurring. In fact, in recent decades, younger ages show impressive declines in crime, violence of every type, robbery and property offenses, dropout, early pregnancy, risk-indicated fatality, and other serious risks and increases in safer, healthier, and pro-social and pro-community behaviors [12-14]. Further, young people display a complex mix of trends in and levels of self-reported attitudes that do not consistently affirm the self-esteem, external locus of control, materialism, loneliness, anxiety, depression, and self-focus those that would be expected from rising NPD [12-15, 20-22]. It is middle-agers, including whites, who have shown increases in rates of crime, drug abuse, external mortality, and other risky behaviors in recent years [13]. These trends are not just inconsistent with, but are the opposite of those predicted to accompany high and rising NPD prevalence among the young and lower, more stable scores among the old.
NPD in popular presentations
A major hindrance to assessing narcissism in the modern era is that the covers and commentaries of popular books [7-9] and media pieces [6], among others, prominently associating narcissism with more affluent young people (especially celebrities) in general, and young white women in particular, do not present accurate, scientific representations of where measured NPD is centered. The popular image is that the personal excesses of celebrities represent the leading edge of a growing “culture of narcissism” especially influencing young people, with young, upscale women cited as examples far more often than men. This image is contradicted by NPD surveillances showing that white women under age 30, along with more affluent groups in general, display only average or below average levels of narcissism compared to the population as a whole [1, details provided by author request; see also 2].
NPD and sociodemographic characteristics
Even beginning with the disputed assumption that NPD is accurately assessed and measures the same discreet psychological states by demographic group and over time, explanation is needed as to why trends in and levels of NPD are strongly connected to poverty and income level. Age groups and races showing the highest poverty levels also show the highest NPI scores, and increases in NPI scores track the declining economic well-being (both in absolute, constant-dollar incomes and relative to incomes of older Americans) and increasing minority composition of younger generations over time.
However, presenting African American men (as opposed to young white women) as the exemplars of NPD would be problematic from a variety of standpoints. Aside from risking charges of racial prejudice, a racialized depiction of NPD would shift the focus toward investigating an array of uncomfortable issues relating to racism and economic and social disadvantage that Americans seem particularly reluctant to engage [2, 23]. In contrast, depicting narcissism as a feature of younger generations enables interests and commentators to focus more comfortably on objectionable popular culture, lenient moral standards, material indulgences, and the general troublesomeness of “young people today,” as older generations have done for eons [14]. Unfortunately, bending NPD prevalence and trends to popular discourse has obscured the association of high NPI scores with lower socioeconomic status, which in turn is complicated by the association of young age and minority race with economic disadvantage.
The evidence from these patterns suggests it is not clear what NPI scores or purported increases in NPD prevalence mean in the modern era. Narcissism inventories inadvertently may be capturing the attitudes associated with coping with low economic status. Research on inner-city populations, including ethnographic studies of “cool pose” [24] and the “code of the streets” [23], indicate the role of self-confident presentation and elevated self-worth in surviving impoverished environments. African American “parenting strategies” may be “intended to protect their children from the harmful effects of racism” by encouraging them to “express highly positive self-views, develop feelings of pride in their own group, and avoid basing their feelings of selfworth on the opinions of others in order to inoculate their self-esteem from the racial bias they are likely to encounter during their lives” [2]. Such considerations may apply to other poorer, minority, and younger populations that also display coincidently high NPI scores. However, economic disparities are not a complete explanation of NPD variance. Socioeconomic status does not explain the higher levels of tested NPD among males compared to females, as well as some lesser anomalies.
Future study
Self-reported individual attitudes on the NPI and related check-box indexes are not, in and of themselves, self-referencing proof of negative trends or society-wide harms; they require consistent, independent validation from social outcome measures. An individual cannot definitively be diagnosed as mentally disordered based solely on responses to a psychological test absent confirming real-world behaviors and harms, nor can a society be diagnosed as troubled and dangerous based on population-wide scores on psychological tests absent corroborating real-world outcomes. Reifying NPD trends to advance hard-edged predictions of larger social trends at the population and cultural levels without hard evidence that such trends actually are occurring risks damaging the credibility of psychometrics to yield insights into real-world social problems. One immediate remedy, though not a complete one, is to incorporate disparities in socioeconomic status and their connection to real-world outcomes as pivotal variables in assessment of NPD and other psychometric indexes at both the individual and societal levels.
Limitations
The chief limitation in the present study is the same affecting most efforts to connect the psychological traits of individuals as measured by inventories to population-wide, societal, and cultural outcomes and trends: the best that can be established with present information is correlational associations. That poverty and income level correlates well with NPD prevalence by demographic and over time does not mean one feature causes the other, especially given the large proportion of the variation in NPD prevalence that remains unexplained by age or poverty level.
Authorship
Mike Males, YouthFacts.org, is the sole author.
Funding
No funding was received from outside sources.
Conflicts of interest
The author has no conflicts of interest in this area.
References
- Stinson FS, Dawson DA, Goldstein RB, Chou SP, Huang B, et al. (2008) Prevalence, correlates, disability, and comorbidity of DSM-IV Narcissistic Personality Disorder: results from the Wave 2 National Epidemiologic Survey on Alcohol and Related Conditions. J Clin Psychiatry 69: 1033–1045. [Crossref]
- Zeigler-Hill V, Wallace MT (2011) Racial differences in narcissistic tendencies. J Res Pers 45: 456-467.
- Barry CT, Kerig PK, Stellwagen KK, Barry TD (2011) Narcissism and machiavellianism in youth: implications for the development of adaptive and maladaptive behavior. APA Books.
- Twenge JM, Campbell WK, Gentile B (2013) Changes in pronoun use in american books and the rise of individualism, 1960-2008. J Cross Cult Psychol 44: 406-415.
- Trzesniewski KH, Donnellan MB (2010) Rethinking “Generation Me”: A study of cohort effects from 1976-2006. Perspect Psychol Sci 5: 58-75.
- Stein J (2013) The Me Me Me Generation. Time, May 20, 2013.
2021 Copyright OAT. All rights reserv
- Twenge JM, Campbell WK (2009) The Narcissism epidemic: Living in the age of entitlement. Atria Books.
- Pinsky D, Young SM (2009) The Mirror Effect: How celebrity narcissism is seducing America. Harper-Collins.
- Twenge JM (2007) Generation Me: Why today’s young Americans are more confident, assertive, entitled—and more miserable than ever before.
- Dingfelder SF (2011) Reflecting on narcissism: Are young people more self-obsessed than ever before? APA Monitor 42: 64.
- Twenge JM, Konrath S, Foster JD, Campbell WK, Bushman BJ (2008) Egos inflating over time: A cross-temporal meta-analysis of the Narcissistic Personality Inventory. J Pers 76: 875-901.
- Arnett JJ (2013) The evidence for generation we and against generation me. Emerg Adulthood 1: 5-10.
- Males MA (2017) Items related to Mike Males. Center on Juvenile and Criminal Justice.
- Males MA (2010) Teenage sex and pregnancy: Modern myths, unsexy realities. Santa Barbara, CA: Praeger.
- Males MA (2008) Generation mean. YouthFacts.org.
- Twenge JM (2010) GenMe says.
- American Renaissance (2011) Racial differences in narcissistic tendencies.
- Bureau of the Census (2017) American Factfinder. Advanced search.
- Twenge JM (2013a) The evidence for generation me and against generation we. Emerg Adulthood 1: 11-16.
- Institute for Social Research (2017) Monitoring the future (1975-2016). Ann Arbor: University of Michigan.
- Higher Education Research Institute (2017) The American freshman, fifty-year trends. (1966-2015). Los Angeles: University of California.
- National Center for Education Statistics (2003) Volunteer service by young people from high school through early adulthood. Washington, DC: U.S. Department of Education, Institute of Education Sciences, NCES 2004–365.
- Anderson E (2000) Code of the street: Decency, violence, and the moral life of the inner city. W.W. Norton.
- Majors R, Billson JM (1993) Cool pose: The dilemmas of black manhood in America. Touchstone Press.