Abstract
Cohort study is the factor-referent study (some scholars called factor-control study) with timespan. The essence of cohort study and case-control study (it’s better to call case-referent study) is the correlation analysis study between exposure factors and disease outcomes. Relative risk (RR) and odds ratio (OR) can be regarded as different transformations of correlation coefficient (r). Cohort studies are applicable to natural population, while case-control studies are also applicable to non-natural population. Case-control study can have cohort and use the full information of all source population during a risk period, case-control study based on cohort sampling can be considered as a more efficient form of cohort study. The results of cohort studies and case-control studies can be compared and evaluated by OR values and their confidence limits.
Key words
case-control study (Case-referent study), cohort study, factor-control study (factor-referent study), correlation analysis study
Introduction
Case-control study and cohort study are two classic epidemiological methods. Exploring, understanding, and analyzing the relationship between them are essential to both epidemiology teaching and practice. Many scholars have been looking into these methods from different perspectives [1-12]. Based on many years of epidemiological practice and teaching experience, this paper further explores the nature, internal relationship and application space of cohort study and case-control study by analysing examples and interpreting relevant discussions.
Examples
Case-control study is grouped according to diseases (result-to-cause) while cohort study is grouped according to exposure factors (cause-to-result). They seem to be opposites superficially but are in fact internally unified: Grouping of the case-control study would have been completed when the relative risk (RR) [13,14] was calculated from a cohort study. The odds ratio (OR) [13,14] can also be calculated at the same time. If the exposure factors and diseases (outcomes) can be constantly divided further, the case-control study and cohort study both can be transformed to correlation analysis study at an individual level. We used the examples below to show and explain the nature of the intrinsic relationship between case-control studies and cohort studies (data in the examples are hypothetical).
Example 1
In order to explore the potential intrinsic relationships between the case-control study and the cohort study, we examined the height, weight, and blood pressure of all adults aged 26-54 years old in a village. The body mass index (BMI) ≥ 25 Kg/m2 was defined as the exposure, and the subjects whose diastolic blood pressure (DBP) ≥ 90 mmHg were defined as hypertension cases [13,14]. A total of 150 subjects randomly selected from DBP < 90 mmHg were included in this cohort. The study was conducted according to whether the subjects were exposed or not. After one year, the prevalence of hypertension was compared between the exposed group and non-exposed group. The RR of hypertension with high BMI was calculated (Table 1). The result is as followed:
Table 1. The relationship between high body mass index and hypertension
BMI(Kg/m2) |
DBP(mm Hg) |
Cases (≥ 90) |
Non-cases (< 90) |
Total |
|
Exposed (≥ 25) |
31(a) |
28(b) |
59 |
|
Non exposed (< 25) |
21(c) |
70(d) |
91 |
|
Total |
52 |
98 |
150 |
|
RR = [a/(a+b)]/[c/(c+d)] = (31/59)/(21/91)=2.28(P = 0.0003)
It can be seen from table 1 that although the cohort study is conducted initially to calculate RR, simultaneously, the grouping of case-control study has been completed. Therefore, OR can be calculated (OR can be the result of a case-control study or a cohort study). The result is as follow:
OR = ad/bc = (31*70)/(28*21) = 3.69(P = 0.0003)
Initially, we would not need to group the 150 subjects in the beginning, but it was necessary to record height and weight measurements. After one year, the subjects were grouped by hypertension. The prevalence of high BMI one year ago was compared between the case group and the non-case group. Therefore, a case-control study was carried out directly. The results were the same.
The RR and OR can also be calculated by using the generalized linear model()[20]. The data was analyzed by using SAS9.4 statistical software.
The equation (1) is: log (μ) =-1.4663+0.8228x
RR= eβ=e0.8228=2.28(P = 0.0003)
The equation (2) is: logit (μ) = -1.2040+1.3058x
OR=eβ=e1.3058=3.69(P = 0.0003)
Example 2
The exposed factor, BMI, was further divided into six groups from low to high following one year. This created a cohort comprised of many groups where one could compare the prevalence of hypertension among different groups (analysing dose-response relationship between BMI and hypertension [13,16,18]). The results are as follows:
By using the generalized linear model, the equation is obtained:
Log (μ) =-2.5065+0.4178x
RR= e0.4178=1.519(P < 0.0001)
Data in table 2 can also be analyzed by “case-control study hierarchical exposure data [16,21,22]”. The results are as follows:
Table 2. The relationship between body mass index and hypertension - grading by body mass index
DBP (mm Hg) |
BMI (Kg/m2) |
Total |
< 20.0 |
20.0- |
22.5- |
25.0- |
27.5- |
30.0- |
Cases
(≥ 90) |
0 |
3 |
18 |
15 |
12 |
4 |
52 |
Non-cases
(< 90) |
2 |
27 |
41 |
20 |
8 |
0 |
98 |
Total |
2 |
30 |
59 |
35 |
20 |
4 |
150 |
Ratio (%) |
0.0 |
10.0 |
30.5 |
42.9 |
60.0 |
100.0 |
34.7 |
By using the generalized linear model, this equation is obtained:
logit (μ) = -3.5836+0.8504x
OR=eβ=e0.8504=2.341(P < 0.0001)
Here, RR and OR are average RR and OR values of hypertension (diastolic ≥ 90 mmHg) which refer to every grade of increment of BMI over the former after one year.
Example 3
The body mass index and measurements of diastolic blood pressure were both divided into six grades from low to high, then the rank correlation analysis was conducted [13]. Thereafter, the forms of cohort study and case-control study have disappeared (Table 3). The results are as follows:
Table 3. The relationship between body mass index and blood pressure - body mass index and diastolic blood pressure both were graded
DBP (mm Hg) |
BMI (Kg/m2) |
Total |
< 20.0 |
20.0- |
22.5- |
25.0- |
27.5- |
30.0- |
110- |
0 |
0 |
0 |
2 |
1 |
2 |
5 |
100- |
0 |
0 |
6 |
8 |
5 |
1 |
20 |
90- |
0 |
3 |
12 |
5 |
6 |
1 |
27 |
80- |
2 |
16 |
23 |
14 |
6 |
0 |
61 |
70- |
0 |
5 |
15 |
6 |
2 |
0 |
28 |
< 70 |
0 |
6 |
3 |
0 |
0 |
0 |
9 |
Total |
2 |
30 |
59 |
35 |
20 |
4 |
150 |
By using the generalized linear model, the equation is obtained:
y=1.5999+0.4891x
The standard deviations of X (body mass index) and Y (diastolic blood pressure) at six levels are:
σx=1.069,σy=1.179
Rank correlation coefficient:
r=β*σx/σy=0.4891*1.069/1.179=0.443(P < 0.0001)
Example 4
Since the data of body mass index and diastolic blood pressure are both quantitative, the 150 people in example 3 can be further subdivided into 150 groups (everyone is internal control of each other [16,18]). The correlation and regression analysis of body mass index and blood pressure was analyzed (Figure 1). The results are as follows:
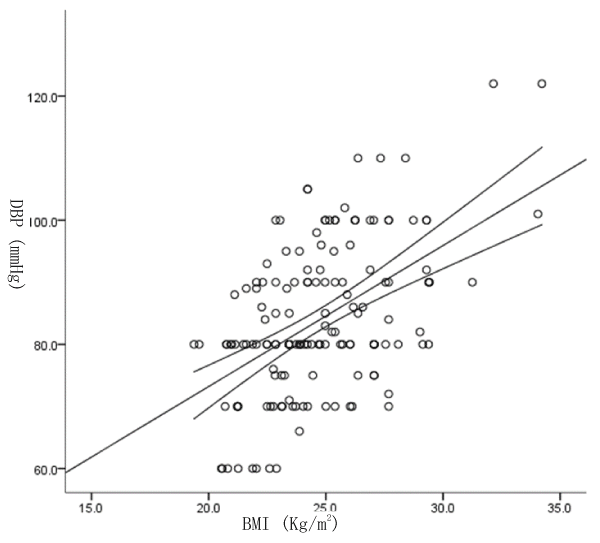
Figure 1. Relationship between body mass index and blood pressure by individual measurements
By using the generalized linear model, this equation is obtained:
y = 27.779+2.272x
Correlation coefficient:
r = β*σx/σy=2.272*0.22227=0.505(P < 0.0001)
If the exposure and outcome variables can be continuously subdivided, then any form of cohort studies(including retrospective cohort studies [13]) and case-control studies (including hospital-based case-control studies [18]) can be transformed into correlation analysis by individual measurements.
Discussion
According to the examples given above and comprehensive analysis of the existing literature about the two methods [13-19,22-32], it can be seen that cohort study and case-control study are essentially correlation analysis studies between exposure factors and diseases or other outcomes. They both use different forms of correlation analysis due to the limitations of the survey data or according to the practical demand. RR and OR can be regarded as different forms of the correlation coefficient (r). As shown in Example 1-4, RR, OR and r can be derived from regression coefficient(β) of a generalized linear model(some scholars have discussed the different methods of calculating r by OR [33]). Whether it is “cause-to-result” or “result-to-cause”, exposure factors are the independent variables, and diseases (outcomes) are the dependent variables. A value of RR or OR greater than 1 indicates a positive correlation, while less than 1 indicates a negative correlation, equal to 1 indicates no correlation;The larger the RR or OR ( when RR or OR is less than 1,that is the larger the 1/RR or 1/OR ), the greater the correlation intensity. This is consistent with the meaning of r (large than 0 indicates a positive correlation, less than 0 indicates a negative correlation, equal to 0 indicates no correlation;The larger the absolute value of r, the greater the correlation intensity).This interpretation of the cohort study and case-control study can help readers to understand the intrinsic relationship and nature of the two methods.
Although the values of RR and OR are generally not equal, both larger than 1, and less than 1 and equal to 1 are the same (same result) in a cohort study. The significance test also obtains the same result (see the RR and OR significant test results from example 1 and example 2). Taking RR and OR as different forms of r does not affect the conclusion that RR can be interpreted as the ratio of one rate over the another (OR can be interpreted as a multiple of one ratio to another). OR is an approximate value of RR when incidence is low [13,22].
Grouping of the case-control study would have been completed when the relative risk (RR) [13,14] was calculated from a cohort study. This means that all the data suitable for a cohort study to calculate RR can also be used for case-control study (RR is always accompanied by OR, see example 1 and 2). Case-control study can also use the full information of all source populations during a risk period. In this case, the two methods have the same intensity and quality to demonstrate the correlation or causality. RR is a result of cohort studies as well as a result of case-control studies using natural population data. However, in the past, when prospective surveys were conducted using natural population data, people used to carry out cohort studies to calculate RR, even considered that RR can only be the result of cohort studies, ignored or denied the objective fact that case-control studies exist at the same time.
It is inappropriate to say that a cohort study is objectively superior to a case-control study. On the contrary, because of incompleteness (non-natural population), a lot of data unsuitable for cohort study can still be carried out in a case-control study (OR can be independent of RR), such as in a hospital based case-control study. This is the advantage of case-control study (flexible and wide application). At this time, due to limitations of survey data or poor implementation, the intensity and quality of a case-control study may be reduced. The misunderstanding that OR is not as good as RR or a case-control study is not as good as a cohort study may come from this misunderstanding. People are accustomed to comparing prospective cohort studies in natural populations with retrospective case-control studies in non-natural populations: the advantages of natural population and prospective data are given to cohort studies, while the disadvantages of non-natural population and retrospective data are imposed on case-control studies. Some current discussions on shortcomings of case-control studies are related to their limitation of survey data or poor implementation [16-18,29], not an inherent flaw in case-control studies themselves. In fact, cohort study is a factor-referent study (some scholars called factor-control study[19]) that survey data of a certain period be collected, and case-control study (case-referent study[2]) etc. belong to one classification system, while prospective study, retrospective study and cross-sectional study belong to another [15]. That is, factor-control study and case-control study can be prospective, retrospective and cross-sectional survey. Factor-control study and case-control study are side by side, but cohort study is a part of factor-control study [19].
It is obvious that cohort study and case-control study are both related analysis studies. However, cohort studies, grouped by exposure factors, are only applicable to the natural population (the denominator of the cases is known, some scholars call it "primary source population [18]"); while case-control studies, grouped by disease, are not only applicable to the natural population, but also to the non-natural population (the denominator of the cases is unknown, some scholars call it "secondary source population [18]").
Case-control study coexists within a cohort study calculating RR. However, in case-control studies using such data, sampling methods are often used further. The basic characteristics of this case-control study are that the case group consists of all the cases in a cohort, while the reference group is a sample from no-cases of the same cohort. The reference group can come from survivors(cumulative sampling, source population (case-cohort sampling), or person-years (density sampling) etc [11,18]. Since all cases are used, as long as the control group is selected according to the statistical requirements, relative to the cohort study, the sampling error and the change of OR confidence limit are very small (OR confidence limit may be slightly widened. Some scholars said “with only a slight reduction in precision”[2,18]), but the sample size can be reduced drastically(improve efficiency greatly), and RR can be estimated. The more rare the disease, the more obvious the reduction of sample size. Therefore, case-control studies based on sampling from cohort can be considered as more effective forms of cohort studies. These include nested case-control studies etc [5,13,14]. The "cohort" is not exclusive to cohort studies (or factor-control studies), and case-control studies can also establish "cohort".
Generally, for diseases with lower incidence, case-control studies sampled in natural population need smaller sample sizes than cohort studies with the same precision requirements, and the rarer the disease, the more obvious it is. Some scholars conceptualized case-control studies as streamlined versions of cohort studies[2].
Using the same population data for cohort study or case-control study, as long as according to the statistical requirements, the ORs are basically same, only sampling errors exist. So the results of cohort studies and case-control studies can be compared and evaluated by OR values and their confidence limits (cohort studies and case-control studies can be included in a same meta-analysis [33]).
What survey indicators can be obtained is determined by the survey data: Case-control studies using natural population data do not affect the acquisition or estimation of incidence and RR; Case-control studies with incomplete data (non-natural population data) can only get OR, which are not suitable to calculate RR, and cohort studies can also not help in such conditions (and even cannot be implemented). The intensity and quality of RR and OR to demonstrate the correlation or causality also depend on the nature and acquisition process of survey data: For a same disease and exposure factor, the intensity and quality of the OR and estimated RR obtained from prospective case-control studies carried out according to statistical design strictly are higher than the RR and OR obtained from retrospective cohort study of poor implementation.
Conclusions
To sum up, cohort study is the factor-referent study(factor-control study) with time-span. The essence of cohort study and case-control study (it’s better to call case-referent study) is the correlation analysis study between exposure factors and disease outcomes. RR and OR can be regarded as different transformations of r. Cohort studies are applicable to natural population, while case-control studies are also applicable to non-natural population. Case-control study can have cohort and use the full information of all source population during a risk period, case-control study based on cohort sampling can be considered as a more efficient form of cohort study. The results of cohort studies and case-control studies can be compared and evaluated by OR values and their confidence limits. We should not underestimate and unilaterally recognize case-control studies, but comprehensively understand case-control studies and cohort studies.
In practical work, every research should be carefully designed according to the purpose of the research, the nature of the data and the possibility of acquisition, so as to prevent the impact of confounding and bias on the results of the research.
Acknowledgement
The National Natural Science Foundation of China (71673003) supported the study.
References
- Mansournia MA, Jewell NP, Greenland S (2018) Case-control matching: effects, misconceptions, and recommendations. Eur J Epidemiol 33: 5-14. [Crossref]
- Rothman KJ (2017) Invited Commentary: When Case-Control Studies Came of Age. Am J Epidemiol 185: 1012-1014. [Crossref]
- Cox DR (2016) The design of empirical studies: towards a unified view. Eur J Epidemiol 31: 217-228. [Crossref]
- Arnold BA, Ercumen A, Benjamin-Chung J, Colford JM Jr (2016) Brief Report: Negative Controls to Detect Selection Bias and Measurement Bias in Epidemiologic Studies. Epidemiology 27: 637–641. [Crossref]
- Kim RS (2015) A new comparison of nested case-control and case-cohort designs and methods. Eur J Epidemiol 30: 197-207. [Crossref]
- Kim RS, Kaplan RC (2014) Analysis of secondary outcomes in nested case-control study designs. Stat Med 33: 4215-4226. [Crossref]
- Mittleman MA, Mostofsky E (2014) Exchangeability in the case-crossover design. Int J Epidemiol 43: 1645-1655. [Crossref]
- Middelburg RA, Wiersum-Osselton JC, van de Watering LM, van der Bom JG (2014) Observational etiologic research: part 3-case-control studies: it's all about the source population. Transfusion 54:12-16. [Crossref]
- Keyes KM, Galea S (2014) Current practices in teaching introductory epidemiology: how we got here, where to go. Am J Epidemiol 180: 661-668. [Crossref]
- Joseph L, Bélisle P (2013) Bayesian sample size determination for case-control studies when exposure may be misclassified. Am J Epidemiol 178: 1673-1679. [Crossref]
- Pearce N (2012) Classification of epidemiological study designs. Int J Epidemiol 41: 393-397. [Crossref]
- Vandenbroucke JP, Pearce N (2012) Case-control studies: basic concepts. Int J Epidemiol 41: 1480-1489. [Crossref]
- Shi LY, Li LM (2010) Modern epidemiology dictionary. People's Medical Publishing House, Beijing: 20-283. (Chinese)
- Porta M (2014) A dictionary of epidemiology.6th ed. Oxford: Oxford university press: 88-229.
- Ma JL (2004) Discussion about epidemiologic surveys. Chin J Dis Control Prev 8: 60-62. (Chinese)
- Zhan SY (2013) National University Textbooks. Epidemiology. 8th ed. People's Medical Publishing House, Beijing. 2-175. (Chinese)
- Li ZH (2016) Epidemiology. 2nd ed. Science Press, Beijing: 5-121. (Chinese)
- Wang JH (2015) Epidemiology (First volumes).3rd ed. People's Medical Publishing House, Beijing: 113-895. (Chinese)
- Liu RZ, Yin DM, Zhou K (1985) Epidemiologic methodology.1st ed. People's Medical Publishing House, Beijing. 120-128. (Chinese)
- Feng GS, Liu DP (2012) Logistic regression analysis and SAS implementation in medical research[M].1st ed. Peking University Medical Press, Beijing: 2012:27-38. (Chinese)
- Fang JQ (2012) Health statistics. 7th ed. People's Medical Publishing House, Beijing: 392. (Chinese)
- Tan HZ (2008) Modern Epidemiology. 2nd ed. People's Medical Publishing House, Beijing: 167-196. (Chinese)
- Leon Gordis (2014) Epidemiology.5th ed. Saunders, Philadelphia: 2-214.
- Kenneth J, Rothman KJ, Greenland S (2014) Handbook of epidemiology. 2nd ed. Springer, Berlin: 187-258.
- Shen HB, Qi XY (2013) National University Textbooks. Epidemiology. 8th ed. People's Medical Publishing House, Beijing: 37-85. (Chinese)
- Zhan SY (2015) National University Textbooks. Clinical Epidemiology. 2nd People's Medical Publishing House, Beijing: 50-51. (in Chinese)
- Jr LH (2017) Applied Epidemiologic Principles and Concepts: Clinicians' Guide to Study Design and Conduct.1st ed. CRC Press, Boca Raton: 143-203.
- Rothman KJ, Greenland S, Lash TL (2008) Modern Epidemiology. 3rd Lippinctt Williams & Wilkins, Philadelphia: 113-606.
- Friis RH, Sellers TA (2014) Epidemiology for public health practice. 5th Jones & Bartlett Learning, Burlington: 279-361.
- Gail MH, Benichou J (2000) Encyclopedia of epidemiologic methods. 5th John Wiley & Sons, Ltd, New York: 49-282.
- Teng GX, Xu T, Zhang ZY (2016) Generalized Epidemiology.1st ed. Suzhou University Press, Suzhou: 1-14. (Chinese)
- Liu XB, Wang SP (2013) Clinical Epidemiology and Evidence Based Medicine. 4th People's Medical Publishing House, Beijing: 52-62. (Chinese)
- Cleophas TJ, Zwinderman AH (2017) Modern Meta-Analysis.1st Springer, Switzerland: 39-242.