Abstract
Exercise capacity is decreased in submersion and depth. A possible explanation for this is an increase in the work of breathing (WOB) due to increased effort to move the chest, increased breathing resistance, and increased gas density. WOB has been measured by the esophageal balloon technique, although this method does not measure alveolar pressure. One purpose of the present study was to test a modification of the P.1 interrupter technique that measures alveolar pressure (PA) based on mouth pressure after a rapid interruption of flow by insertion of a wedge in the air supply as an alternative method of quantifying WOB and WOB per minute (POB) in the diving environment. A second purpose was to use this method to determine WOB submersed and at pressure. It was hypothesized that both submersion and depth would increase the WOB and POB. PA – volume loops were generated based on the P.1 method and WOB and POB calculated for both rest and exercise in 10 healthy male subjects during submersion and at depth. These results were compared to control conditions. Ventilation was increased in submersion, but was not significantly affected by depth. POB was found to be significantly increased in submersion, and further increased as a function of depth. The increased POB in these conditions were observed both at rest and during exercise, both during inspiration and expiration. The POB determined by the P.1 interrupter technique confirmed previous studies that used the esophageal balloon technique, with accurate determination of alveolar pressure and pressure-volume loops.
Key words
submersion, depth, work of breathing, ventilation, alveolar pressure-volume loop, P1 technique.
Introduction
Recent work has established that respiratory muscle fatigue may limit sustained sub-maximal exercise endurance in environments where there is an increased work of breathing (WOB) [1,2,3]. One such environment is encountered during diving where a pressure compensated breathing system is required to adjust for hydrostatic pressure, which increases with depth. The increased pressure increases density of breathing gas as a function of depth, and airway and external resistances increase due to the breathing gear and because the source of breathing gas is often at a different hydrostatic pressure than the chest centroid. This produces static lung loading (SLL) [4], usually negative, and requires greater pressure generation by the diver. In fact exercise endurance is compromised at depth [1,2,3,5,6], and the effect is greater as the depth increases [1,2,3]. The reduced exercise capacity is associated with the subject being unable to sustain tidal volume, while minute ventilation (⩒E) increases due to respiratory compensation for metabolic acidosis [2,3]. This results in an unsustainable increased energy cost of ventilation [5,7] which results in a reduction in blood flow to the locomotor muscles leading to reduced exercise performance [8].
The reductions in exercise endurance during diving could be due to increased work of breathing (WOB) or reduction in efficiency of the respiratory system. Submersion itself translocates blood that normally pools in the extremities to the thorax [9], decreasing total lung capacity, residual volume [9,10,11], and lung compliance [9]. These changes increase the elastic work of breathing. In addition, negative SLL increases the demand on the inspiratory muscles (Lundgren 1999). WOB has usually been shown to increases as a function of depth [2,3,7,13], however this is not uniformly found [2]. The increase in WOB at depth is associated with increased airway resistance as a result of increased gas density [13].
Airway resistance and the WOB are usually calculated by comparing pressure at the mouth to pressure in an air-filled balloon placed within the lower third of the esophagus [14], which reflects pleural pressure. However, calculations of the work of breathing and resistance that use this method incorporate both elastic and resistive components, whereas alveolar pressure (PA) alone better describes the resistive work of breathing and provides a more accurate measure by which to calculate airway resistance. Recently, airway resistance in divers has been estimated by briefly interrupting airflow and measuring mouth pressure in the system (taken to approximate alveolar pressure) [7] along with gas flow to calculate resistance. This is a modification of the “P.1 technique,” first developed by Otis and Proctor [15]. Although this technique gives an indication of the degree of respiratory muscle activation [16] and central respiratory drive [17], a single point measurement does not allow calculation of the WOB. P.1 airway resistance values at sea level are comparable to values obtained by the traditional esophageal balloon technique [18,19], and have been used to assess airway resistance during simulated dives at depths up to 1450 feet of seawater (fsw) [20].
The P.1 technique has been further modified to allow the generation of PA vs. volume (V) loops which in turn allows the calculation of the WOB, as determined by the integrated area within the PA-V loop [14]. This technique requires that P.1 be measured multiple times at discrete time points during both inspiration and expiration under steady-state conditions. From these discrete points a PA-V loop can be generated, and the WOB and POB calculated using traditional methods [14]. The technique of multiple interruptions during the breathing cycle has been used in patients with acute lung injury or respiratory distress and healthy subjects [21,22] and is reproducible with good inter-observer reliability [21]. However, it has not been used in unusual environments or during exercise.
The purpose of this study was to determine whether or not the effects of submersion and increased gas density (depth) on the WOB can be accurately described using the P.1 interrupter technique. To accomplish this, the P.1 interrupter technique was adapted to submersion, particularly at pressure. It was hypothesized that P.1 interrupter technique could be adapted for submersed rest and exercise at depth, and that the WOB would increase as a result of submersion and with increased depth during expiration and inspiration, at rest and during exercise.
Methods
The study was approved by the Health Sciences Institutional Review Board, and 10 healthy male experienced scuba divers from the local diving community participated after providing informed consent and a undergoing a physical examination. Ten male subjects completed the study and they were 24.5 ± 3.2 years of age, 181 ± 5 cm in height, weighed 77.7 ± 10.9 kg and had maximal oxygen consumption of 48.6 ± 3.2 mL/min/kg while cycling at 1 ATA. Subjects wore shorts or swim trunks and were seated upright on a cycle ergometer in a hyperbaric chamber, where they completed 30 minutes of rest and then 30 min exercise. The same protocol was performed in air and underwater, at the surface and at a depth of 120 fsw on separate occasions. The exercise consisted of a constant work rate of 100 W (O2 consumption of 1.89 ± 0.35 L/min and was nominally 50% of each subjects maximal V̇O2 determined at 1 ATA) which could be easily sustained for the 30 min by all subjects. During the submersed exercise the ergometer was set at 75W with 25W added due to the hydrodynamic resistance of the legs moving through the water [4]. The order of experiments was randomized. During rest and exercise discrete measures of PA and V were made during inspiration and expiration over a wide range of flows to develop PA-V loops, which were subsequently used to calculate the WOB and POB. After the experiments at depth, the subjects were decompressed using standard Navy decompression tables.
The experimental setup has been described before [7], however, P.1 pressure in that study was measured at one point in the breathing cycle while in the present study P.1 was measured intermittently throughout inspiration and expiration. The method is briefly described here with the addition of multiple interruption methods. During data collection, the subject was seated on a cycle ergometer inside a wet/dry hyperbaric chamber and was accompanied by two tenders. During submersion, the water level was adjusted to impose a -15cm static lung load on the subject, which is commonly experienced by divers [12]. A 3-lead electrocardiogram (ECG) signal was used to monitor the subject to increase safety. The experiments were performed in a wet/dry hyperbaric chamber. Subjects breathed from a mouthpiece equipped with two one-way valves, hoses, a pressure transducer (DP15-28, Validyne Engineering, Northridge, CA) that continuously measured pressure at the mouth (Pmouth), and an interrupter that was built in-house for measurement of PA ( Figure 1). The mouthpiece connected to a bag-in-box system consisting of a meteorological balloon (250L) within a 55 gallon drum. A spirometer (Ohio Medical Products, Houston, TX) in line with the breathing gas system allowed continuous measurement of lung volume (V) and later calculation of tidal volume (VT) and frequency of breathing (bf). After gas collection, the contents of the bag were vented to ambient pressure, where the volume was measured with a dry gas meter (750 Meter, Rockwell International Meter Division, Pittsburgh, PA) gas concentrations (O2 and CO2) were measured with a mass spectrometer (MGA 1100, Perkin-Elmer, Pomona, CA), and temperature was recorded from a thermocouple (DP-80 series, Omega Engineering, Stamford, CT). At the surface, the bag was emptied by filling the barrel with pressurized breathing gas, which forced the gas collected in the bag to vent. ⩒E was calculated from the volume of gas collected. Data were recorded using BIOPAC Systems MP150 with AcqKnowledge data acquisition software.
A modification of the P.1interrupter technique for use in a high-pressure environment was used to calculate alveolar pressure (PA). The interrupter was mounted just distal to the subjects’ mouthpiece and was made of a small metal plate inside a plastic housing (Figure 1). The metal plate was connected to a piston which was driven by a pneumatic system and triggered by a solenoid valve that caused the metal plate to block the airway for about 150 ms before resetting to the open flow position. A magnet on top of the mouthpiece detected a full extension of the interrupter, and the airway obstruction was observed as a spike in the Pmouth signal. During the interruption, pressure measured at the mouth was assumed to be in equilibrium with PA. The interrupter fired at a series of discrete times during inspiration and expiration. Using an automated system that mapped breaths based on their inspiration and expiration patterns, interruption sequences were initiated at various delays (150 – 2000 ms) after the onset of inhalation or exhalation to determine PA across a variety of flow rates and lung volumes. Interruptions were initiated at random intervals to ensure that subjects could not anticipate an interruption. PA, and flow, and V were determined throughout the breathing cycle at a frequency of 500 Hz. The data for PA and flow were used to construct the PA-V loop. The integrated area under the PA-V loop for inspiration, expiration and total were used to estimate the WOB (described below). Two inspiratory and two expiratory interruptions for each time delay were averaged and used in the analysis. The pressure vs. time relationships to calculate PA were judged acceptable if the preceding VT and bf were representative of the values during rest and exercise and there were no visual distortions of the wave forms and the backward linear extrapolation had a correlation coefficient of greater than 0.85.
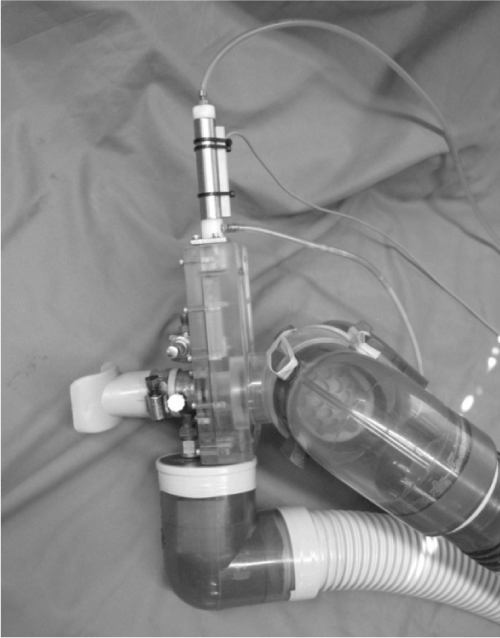
Figure 1. Breathing Mouthpiece and Interrupter for Recording Alveolar Pressure. The device included A) the interrupter, B) breathing hoses and one-way valves, C) the Pmouth pressure transducer in a large bore hose D) pressure lines to activate the interrupter, and E) the interrupter signal magnet.
When the bag in barrel system was full it was emptied and the interrupter was stopped. After emptying, the experiment continued from the last delay period. Once each delay period from 150 ms to 2000 ms of the breathing cycle was completed, the rest period was completed and preparations for the exercise period began.
A two-minute warm-up period of cycling, where no measurements were taken, was initiated to get the subject to a steady-state V̇O2 and heart rate. Exercise was carried out at a work rate of 100 W at 60 ± 5 rpm which all subjects could sustain for 30 min. The ergometer was set at 75 W in wet conditions to compensate for the increased resistance of pedaling in water, thus making the total equivalent to 100 W [4]. The same measurement procedures used for the rest collection were used during exercise.
After data acquisition was completed, PA from the interruptions throughout the breathing cycle was calculated. Flow was calculated from the volume data [7]. Each volume was determined for individual interruptions in a breath cycle, and three volumes per interruption point were taken and averaged to determine the value of PA and V used in subsequent analysis. Three periods from each breath were selected for analysis. The first represented a large picture of the breath cycle from one volume peak to the subsequent peak, while encompassing the entire interruption period. The second selection was made to determine the linear regression for the PA curve. A representative tracing of mouth pressure and the calculation of PA is shown in Figure 2. These selections usually represented 50-100 ms of the interruption trace and focused on getting a steady, noise-free representation of the slope. The third selection was made from the beginning of the interruption firing to the end point of the previous selection.
From these points, a linear regression was applied to the Pmouth signal to determine pressure at the time of interruption (PA).VT, V at the time of interruption, and flow at the time of interruption were also determined (Figure 2). Using these values, the lung volume was calculated. This process was repeated for each interruption point during a trial, and a PA-V loop was assembled (Figure 3). Extreme outliers and points with too much interference were disregarded in the final analysis.
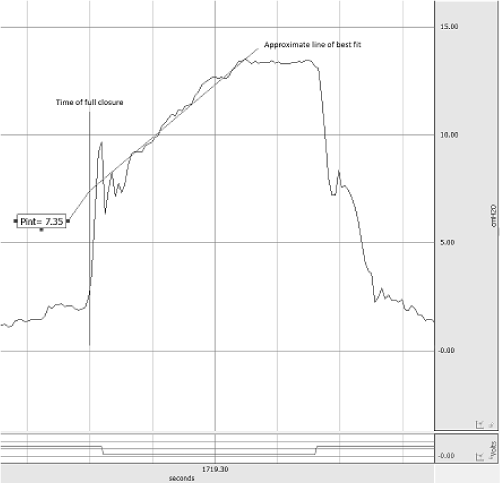
Figure 2. Representative tracing of mouth pressure for the calculation of PA. The tracing is marked to show the time of interruption, an approximate line of best fit, and the pressure at the time of interruption, PA.
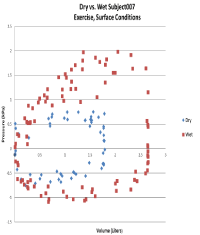
Figure 3. Representative raw data scatter plot (Excell file) of the relationship between PA and Vfor an individual subject during exercise, both dry and submersed, at 120 fsw. The WOB (the area encompassed by the loop) in the wet condition is greater than in the dry condition.
For the purposes of PA-V loop analysis, a procedure was developed using commercial programs in combination, i.e. Microsoft Excel, Visual CADD and Alpha Blender. PA and volume values were used to calculate work of each breath after conversion of units. The values were sorted and imported into an Excel file. The first step then was to plot PA and V volume values using Microsoft Excel (Figure 3). The data points on this graph were then connected via 3 point boxcar moving average with smoothing. Then a Visual CADD window was opened, the Excel graph was imported behind the CADD window, and the CADD window was made “transparent” on the computer screen through the use of Alpha Blender. After this, the overlaying tracing of the curve and area was drawn using the included free draw tool. The area of 1 watt was determined on the graph with visual CADD to be used as a factor for converting the area under the entire curve to work of breathing (WOB) (Figure 4). The curve was then traced using the Bezier curve tool to determine the area under the PA-V loop for one breathing cycle to calculate the WOB. This procedure was then repeated for all inspiratory and expiratory PA-V loops. The values for one breath were then multiplied by the breathing frequency to determine the total WOB per minute (power of breathing, POB).
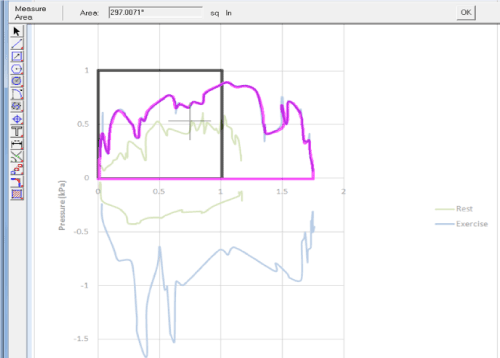
Figure 4. This figure shows a snap shot from the screen of the analysis using Excel, Visual CADD and Alphas Blender soft wear to determine the area under the PA-V loop used for the calculation of the WOB. The square indicates the calibration area to determine the area under the PA-V loop.
For statistical analysis: Data are expressed as mean and standard deviations. Two-way analysis of variance (ANOVA) for repeated measures was used to compare dependent variables of wet vs. dry at the surface and at depth and the effect of depth on both wet and dry (Sigma Stat 3.5). The post-hoc Holm-Sidak test was performed for pair wise comparisons. Differences were considered to be significant at p≤ 0.05.
Results
Other than the expected increases in parameters going from rest to exercise there were no significant effects of time. The average exercise V̇O2 of 1.89 ± 0.35 L/min, V̇E as shown below and end-tidal CO2 of 44 ± 3 mmHg were not different during the 30 minute period.
Figure 3 shows a representative raw data PA-V plot in Excel for one subject comparing dry vs. wet conditions during exercise at depth (120 fsw).For this particular plot, the WOB can be visually ascertained from the area under the curve as higher in conditions of submersion as opposed to dry conditions.
Resting and exercise V̇E are shown in Figure 5. Resting V̇E was not affected by pressure; however submersion increased it 25% at the surface and 14% at 120 fsw. During exercise, V̇E was significantly higher than during rest for all conditions. It was still unaffected by depth, but increased with submersion (19% at the surface, and 9% at 120 fsw). In summary, V̇E was increased by submersion, but not depth.
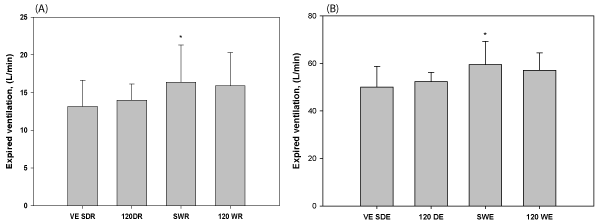
Figure 5. V̇E during rest (a) and exercise (b). V̇E increased with submersion, but not depth. *Indicates a statistically significant difference from the corresponding dry experiment.
Inspiratory POB at rest and exercise is shown in Figure 6a. There was a statistically significant increase in POB when going from dry to wet conditions (47% at 0 fsw, 64% at 120 fsw). There were also 64% and 79% increases in POB at depth during rest and exercise, respectively.
Expiratory POB at rest and exercise for each condition are shown in Figure 6b, for rest and exercise, respectively. There is a statistically significant increase in WOB when going from dry to wet conditions, (111% at 0 fsw, 88% at 120 fsw). The POB was also higher at 120 fsw compared to the surface during rest (63%) and exercise (41%).
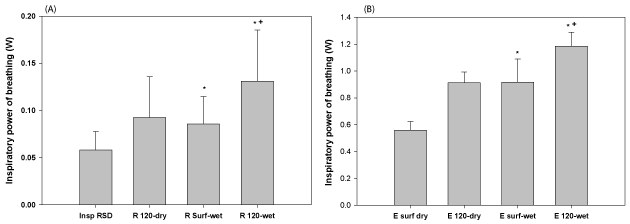
Figure 6. POB a) inspiration at rest and b) inspiration during exercise. Inspiratory POB was higher during submersion and increased from surface to 120 fsw for wet conditions. *Indicates a statistically significant difference between this condition and the corresponding dry experiment. +Indicates a statistically significant difference between this condition and the corresponding surface experiment.
Discussion
⩒E
During rest and exercise, ⩒E was not affected by pressure, but was significantly higher immersed compared to dry. It is likely that the increase in ventilation during submersion was due to the increase in metabolic rate that immersion in cool water likely caused. This was especially likely during rest, when the water temperature was somewhat below the thermoneutral temperature [23,24]. Alternatively, the increase in V̇E may have resulted from the greater inspiratory effort required to overcome the SLL. The lack of change in V̇E with depth is somewhat puzzling as most other studies have found differences [7,25,26]. Some studies have found increased ⩒E as a function of depth, which has historically been attributed to the Haldane effect [27], whereby the high PO2 at depth inhibits O2 unloading from hemoglobin and impairs CO2 transport. More recently, hyperoxic hyperventilation [28], which may occur when the high PO2 blunts peripheral chemosensitivity but an accumulation of free radicals stimulates central chemoreceptors, has been suggested as an alternative explanation. In contrast, other studies have found decreased ⩒E as a function of depth, especially during exercise [7]. This is typically attributed to increased airway resistance and WOB as a function of increased gas density. Given that we observed no change, it is likely that two or more of these competing mechanisms were at work here and effectively cancelled each other’s impact. As previously shown [4,25], subjects performed one of two respiratory compensations when exposed to the increased WOB at depth. One possible compensation is increasing ventilation compared to the surface, however this was shown to lead to dyspnea [4]. The other compensation was to maintain WOB as at the surface, with the consequence being a similar ⩒E, however in this case PaCO2 was elevated, but there was no dyspnea [4]. Although it was not the aim of this study, none of the subjects spontaneously reported dyspnea and all subjects completed the 30 minutes of exercise.
PA and POB
Submersion increased POB both at rest and during exercise in the present study. One possible explanation is that the increased POB is a result of extra work required during inspiration when water is displaced by expansion of the subject’s chest wall, as well as the added pressure required during inspiration to overcome the negative SLL. Another possible explanation for the increased POB when submersed is congestion of the airways with blood translocated from the lower body, leading to increased resistance [4,12]. The erect posture and imposed SLL in the present study are more likely to be responsible for the increased POB than submersion per se, as the latter would increase chest wall elastic recoil at the start of inspiration [4]. Finally, it should be noted that submersion may alter functional residual capacity (FRC), so even though breaths were matched for VT and bf, FRC was not measured and thus it cannot be concluded with certainty that the effect seen during submersion was due to the negative SLL alone. The potential physiological variations in VT, bf and FRC may account for the scatter seen in the PA-V loops [Figure 7] and could preclude disclosure of small changes in the WOB and POB.
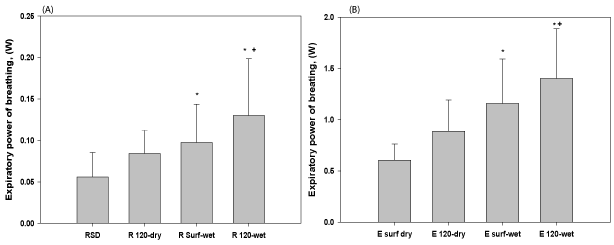
Figure 7. POB a) expiration during rest b) expiration during exercise. Expiratory POB was higher during submersion and increased from surface to 120 fsw for wet conditions. *Indicates a statistically significant difference between this condition and the corresponding dry experiment. +Indicates a statistically significant difference between this condition and the corresponding surface experiment.
Depth also increased POB during rest and exercise. This most likely resulted from the increase in gas density, which in turn increased airway resistance and therefore increased the PA required to move air through the airways. This may be exacerbated by the increased inertia of gas flowing in the airways and breathing apparatus (inertance). Although inertance increases in direct proportion to gas density [29], due to the low V̇E, and specifically slow bf of divers reported here and elsewhere its role is not likely to be the main cause of the increased POB, which is supported by a previous study [30]. Both submersion and depth impose obvious limitations on physical exertion during open water dives due to these increases in POB. These increases in POB have been found before [7,13,20], as has the associated limitation to exercise [2,3]. SLL affects both inspiration and expiration at depth in the presence of increased gas density, particularly during exercise. Previous studies have shown that increasing both inspiratory and expiratory muscle force (pressure) by resistance respiratory muscle training reduces the WOB [5,31] and the energy cost of ventilation (Stimson, Held), as well as increasing exercise endurance [1,2,3,6]. The major factor for the reduced POB is that after respiratory muscle training there is a reduction in V̇E and increased VT, and lower bf, especially during sustained exercise where respiratory muscle fatigue resulted in a reduction in VT and a compensatory increase in bf [1,2,3,6,31].
Alveolar pressure was successfully measured during the use of this method, and minimal interference was noted as a result of depth and/or submersion. This confirms a previous study that used the same technique, however in that study only one point was measured and only resistance was calculated [7]. The data for the effect of submersion and depth on WOB in the present study using the P.1 technique were similar in inspiration to a previous study in our laboratory [7] and another laboratory [32] using the esophageal balloon technique. The increases in the POB in the present study ranged from 47 – 64% during submersion and 41 – 63% at depth, while the previous study reported a 20 – 40% increase in the POB. The present study demonstrated a 41 - 63% increase in POB at depth, which was not seen in the previous study [7].
The subjects studied with the P.1 technique reported minimal discomfort from this method, as opposed to the use of transnasal esophageal balloons which are sometimes uncomfortable. This is similar to the traditional method of calculating WOB as the area within a pleural pressure—tidal volume loop [33]. Much like the traditional calculations, our calculations exclude the portion of the elastic work of breathing that falls outside this loop. In addition, we did not have measures of esophageal pressure which would have allowed us to separate the resistive components from some of the elastic WOB. While these are admitted limitations of the technique, we chose to calculate the work of breathing in this way to determine the reliability of this alternative, and potentially more tolerable, method. Our results correlate well with previous results that utilized the esophageal balloon technique [7]. It should be noted however that the values of resistance during submersion and at depth previous reported using the interrupter techniques [7,31] and the POB in the present study are higher than similar values calculated from esophageal measurements [7,34,35]. One explanation for the high resistances reported previously [7,31] is that the measurements were made at the start of the breathing and not during the peak flow as done in previous studies using the esophageal pressure technique; however, in this study, measurements were made throughout the breath, so this explanation most likely does not account for the differences. Alternatively, the higher PA measured with the interrupter technique may be closer to the true PA. Esophageal pressure measured by the esophageal balloon only approximates pleural pressure, and likely underestimates pleural pressured since some force may be lost to deformation of the esophageal tissue. Thus, the P.1 technique may more accurately reflect airway resistance and POB, as calculations made with this measure more precisely define the actual pressure drop throughout the airways. One final possibility is that for both resistance and POB, differences in breathing pattern among the subjects studied may explain the different results.
Conclusion
The results of the present study support the conclusions that POB increases with submersion as well as with increasing depth. In this study, POB increased with increasing pressures and submersion for both rest and exercise phases of a subject’s physiology. Both inspiratory and expiratory POB increased as well under conditions of submersion and increasing pressure. Although the increase in ⩒E with submersion is in agreement with other studies, ⩒E was not affected by depth as some, but not all, have shown previously. Lastly, the results of this study indicate that the revised P.1 method is practical and yields reasonable results. It is thus of value in future studies observing respiratory physiology, including those in the diving environment.
Acknowledgement
We would like to acknowledge the contribution of Andrew Barth for his assistance in the interrupter device and analysis software development. We thank the Center for Research and Education in Special Environments staff—Andrew Barth, Lukas Eckhardt, Michael Fletcher, Ron Okupski, Curtis Senf, Amber Simpson, Eric Stimson, and Matthew Vargo—for their assistance in data collection. We would also like to thank Administrative Assistant Nancy Niedermayer for her organizational work. Finally, we would like to acknowledge the support from the Office of Naval Research for funding this project (Grant# N00014-08-1-0255).
References
- Wylegala JA, Pendergast DR, Gosselin LE, Warkander DE, Lundgren CE (2007) Respiratory muscle training improves swimming endurance in divers. Eur J Appl Physiol 99: 393-404. [Crossref]
- Ray AD, Pendergast DR, Lundgren CE (2008) Respiratory muscle training improves swimming endurance at depth. Undersea Hyperb Med 35: 185-196. [Crossref]
- Ray AD, Pendergast DR, Lundgren CE (2010) Respiratory muscle training reduces the work of breathing at depth. Eur J Appl Physiol 108: 811-820. [Crossref]
- Thalmann ED, Sponholtz DK, Lundgren CE (1979) Effects of immersion and static lung loading on submerged exercise at depth. Undersea Biomed Res 6: 259-290. [Crossref]
- Simpson AL, Ray AD, Lundgren CE, Pendergast DR (2012) Energy cost of breathing at depth: effect of respiratory muscle training. Undersea Hyperb Med 39: 829-836. [Crossref]
- Lindholm P, Wylegala J, Pendergast DR, Lundgren CEG. (2007) Resistive Respiratory Muscle Training Improves and Maintains Endurance Swimming Performance in Divers. Undersea and Hyperb Med 34:169-180. [Crossref]
- Held HE, Pendergast DR (2013) Relative effects of submersion and increased pressure on respiratory mechanics, work, and energy cost of breathing. J Appl Physiol (1985) 114: 578-591. [Crossref]
- Harms CA, Babcock MA, McClaran SR, Pegelow DF, Nickele GA, et al. (1997) Respiratory muscle work compromises leg blood flow during maximal exercise. J Appl Physiol (1985) 82: 1573-1583. [Crossref]
- Dahlbäck GO, Jönsson E, Linér MH (1978) Influence of hydrostatic compression of the chest and intrathoracic blood pooling on static lung mechanics during head-out immersion. Undersea Biomed Res 5: 71-85. [Crossref]
- Taylor NA, Morrison JB (1991) Lung volume changes in response to altered breathing gas pressure during upright immersion. Eur J Appl Physiol Occup Physiol 62: 122-129. [Crossref]
- Moon RE, Cherry AD, Stolp BW, Camporesi EM (2009) Pulmonary gas exchange in diving. J Appl Physiol (1985) 106: 668-677. [Crossref]
- Lundgren CE. Immersion effects. In: The Lung at Depth, edited by Lundgren CE, and Miller J. New York: Dekker, 1999: 91-128.
- Dubois AB, Lanphier EH, Marshall R (1956) Resistance to breathing in normal subjects during simulated dives. J Appl Physiol 9: 5-10. [Crossref]
- Otis AB, Fenn WO, Rahn H (1950) Mechanics of breathing in man. J Appl Physiol 2: 592-607. [Crossref]
- Otis AB, Proctor DF (1948) Measurement of alveolar pressure in human subjects. Am J Physiol 152: 106-112. [Crossref]
- Hayot M, Ramonatxo M, Matecki S, Milic-Emili J, Prefaut C (2000) Noninvasive assessment of inspiratory muscle function during exercise. Am J Respir Crit Care Med 162: 2201-2207. [Crossref]
- Whitelaw W, Derenne JP, Milic-Emily J. (1957) Occlusion pressure as a measure of respiratory center output in conscious man. Respir Physiol 23: 181-199. [Crossref]
- Mead J, Whittenberger JL (1954) Evaluation of airway interruption technique as a method for measuring pulmonary airflow resistance. J Appl Physiol 6: 408-416. [Crossref]
- Jackson AC, Milhorn HT Jr, Norman JR (1974) A reevaluation of the interrupter technique for airway resistance measurement. J Appl Physiol 36: 264-268. [Crossref]
- Clarke JR, Jaeger MJ, Zumrick JL, O'Bryan R, Spaur WH (1982) Respiratory resistance from 1 to 46 ATA measured with the interrupter technique. J Appl Physiol Respir Environ Exerc Physiol 52: 549-555. [Crossref]
- Mehta S, Stewart T, macDonald R, Hallett D, Banayan D, et al. (2003) Temporal change, reproducibility, and interobserver variability in pressue-volume curves in adults with acute lung injury and acute respiratory distress syndrome. Crit Care Med 31(8): 2118-2125. [Crossref]
- Bellani G, Patroniti N, Weiserman D, Galbiati L, Curto F, et al. (2007) Measurement of pressure-time product during spontaneous assisted breathing by rapid interrupter technique. Anesthesiology 106(3): 484-490. [Crossref]
- Craig AB Jr, Dvorak M (1966) Thermal regulation during water immersion. J Appl Physiol 21: 1577-1585. [Crossref]
- Datta A, Tipton M. (2006) Respiratory responses to cold water immersion: neural pathways, interactions, and clinical consequences awake and asleep. J Appl Physiol 100: 2057. [Crossref]
- Warkander DE, Norfleet WT, Nagasawa GK, Lundgren CE (1992) Physiologically and subjectively acceptable breathing resistance in divers' breathing gear. Undersea Biomed Res 19: 427-445. [Crossref]
- Norfleet WT, Hickey DD, Lundgren CE (1987) A comparison of respiratory function in divers breathing with a mouthpiece or a full face mask. Undersea Biomed Res 14: 503-526. [Crossref]
- Whalen RE, Saltzman HA, Holloway DH Jr, Mcintosh HD, Sieker HO, et al. (1965) Cardiovascular and blood gas responses to hyperbaric oxygenation. Am J Cardiol 15: 638-646. [Crossref]
- Hong SK, Cerretelli JC, Cruz C, and Rahn H. (1969) Mechanics of respiration during submersion in water. J ApplPhysiol; 27:1969. [Crossref]
- Mead J (1956) Measurement of inertia of the lungs at increased ambient pressure. J Appl Physiol 9: 208-212. [Crossref]
- Moon RE, Cherry AD, Stolp BW, Camporesi EM (2009) Pulmonary gas exchange in diving. J Appl Physiol (1985) 106: 668-677. [Crossref]
- Held HE, Pendergast DR (2014) The effects of respiratory muscle training on respiratory mechanics and energy cost. Respir Physiol Neurobiol 200: 7-17. [Crossref]
- Dean JB, Mulkey DK, Henderson RA 3rd, Potter SJ, Putnam RW (2004) Hyperoxia, reactive oxygen species, and hyperventilation: oxygen sensitivity of brain stem neurons. J Appl Physiol (1985) 96: 784-791. [Crossref]
- Otis AB (1954) The work of breathing. Physiol Rev 34: 449-458. [Crossref]
- Vorosmarti J, Bradley ME, Anthonisen NR (1975) The effects of increased gas density on pulmonary mechanics. Undersea Biomed Res 2: 1-10. [Crossref]
- Wood LD, Bryan AC (1978) Exercise ventilatory mechanics at increased ambient pressure. J Appl Physiol Respir Environ Exerc Physiol 44: 231-237. [Crossref]


