Ribaxamase is an orally delivered β-lactamase intended to be co-administered with intravenous β-lactam antibiotics (penicillins and cephalosporins) to protect the gut microbiome from excess antibiotics excreted into the gastrointestinal tract. In a placebo-controlled, multinational Phase 2b proof-of-concept clinical study, ribaxamase significantly reduced the incidence of Clostridium difficile infection in patients treated with ceftriaxone for a lower respiratory tract infection. Patients could also receive treatment with macrolides at the discretion of the clinician. During the clinical study, three sequential fecal samples were collected for analysis of the gut microbiome and microbiologic determination of intestinal colonization by certain pathogens. Changes in the gut microbiome were analyzed using 16S rRNA gene sequencing. Ribaxamase significantly ameliorated the loss of alpha and beta diversity as compared with the placebo group. During the clinical study, significantly more placebo patients became newly colonized with vancomycin resistant enterococci (VRE), and the present microbiome analysis determined that significantly more placebo patients also became monodominated by enterococci (15 vs. 4). Notably, VRE-colonized patients had a significant reduction in gut microbiome alpha diversity as compared with non-colonized patients. These data demonstrate that ribaxamase limited antibiotic-mediated damage to the gut microbiome in patients treated with ceftriaxone and support further clinical development. Ribaxamase is a unique gut microbiome protectant intended to reduce opportunistic infections like C. difficile in patients receiving IV β-lactam antibiotics.
β-lactamase, ceftriaxone, clinical study, gut microbiome protectant.
The gut microbiome is important to human health and provides colonization resistance against opportunistic pathogens like Clostridium difficile [1-3]. When the balance of the gut microbiome is perturbed, colonization resistance can be lost allowing overgrowth of pathobionts, potentially leading to infection [1,4]. The mechanism of colonization resistance has been well documented for C. difficile as strains of gut bacteria metabolize primary bile salts to secondary bile salts, which, in turn, inhibit germination of C. difficile spores [5]. When these beneficial bacteria, most of which are obligate anaerobes, are lost, so too is the inhibition of C. difficile germination. Thus, alterations to gut microbiome composition in the presence of C. difficile spores can result in fulminant C. difficile infection (CDI) [6].
Antibiotics are a major cause of gut microbiome disruption, and broad-spectrum antimicrobials are strongly associated with an increased risk for CDI [6-8] including clindamycin, fluoroquinolones and β-lactam antibiotics (penicillins, cephalosporins and carbapenems) [2,6,9-12]. All intravenous (IV) β-lactam antibiotics are at least partially processed in the liver and excreted through the bile into the intestine as active antimicrobials [13]. Biliary excretion of β-lactams can range from a small percentage of the input dose to up to 40% for antibiotics like ceftriaxone [13], resulting in high intestinal concentrations of up to 1 mg/ml [14]. β-lactams are the most commonly used broad spectrum antibiotics and are especially harmful to the commensal organisms of the gut microbiome, particularly the beneficial anaerobes that play a role in colonization resistance [9].
While antibiotics remain the mainstay for treatment of bacterial infections, their use can significantly increase the risk for gut microbiome damage leading to the development of infections like CDI. A correlation between the duration of treatment with antibiotics, the number of different types of antibiotics used and the risk for CDI was demonstrated revealing that longer courses of therapy and use of multiple antibiotics significantly increase the risk for CDI [10]. Thus, limiting exposure of the microbiome to antibiotics would diminish microbiome disruption and provide a beneficial strategy to reduce the incidence of antibiotic-associated infections like CDI.
Ribaxamase is an orally-administered β-lactamase intended to be coadministered with IV penicillins and cephalosporins [15]. Ribaxamase is formulated for release at pH 5.5, the pH of the upper small intestine at the site of bile release [16]. The prophylactic strategy is to have sufficient active β-lactamase available to degrade excess β-lactams as they are excreted into the intestinal lumen, before reaching and harming the colonic microbiota. Protection of the gut microbiome is expected to maintain colonization resistance and prevent opportunistic infections like CDI in addition to other negative health effects associated with gut microbiome dysbiosis [17].
Ribaxamase was evaluated clinically in several studies. In Phase 1 clinical studies, oral ribaxamase was well tolerated and remained in the intestinal lumen when dosed orally [18]. Phase 2a clinical studies verified the ribaxamase mechanism of action by demonstrating that co-administration of oral ribaxamase with IV ceftriaxone resulted in elimination of ceftriaxone in intestinal chyme to undetectable levels [14]. Importantly, ribaxamase did not affect plasma concentrations of ceftriaxone, consistent with finding that the active enzyme remains in the intestinal lumen.
Based on these promising clinical results, a Phase 2b proof-of-concept study was performed in 412 patients who were admitted to the hospital for treatment of a lower respiratory tract infection (LRTI) with IV ceftriaxone [19]. Patients were randomized one-to-one to receive co-treatment with either ribaxamase or placebo. In addition to ceftriaxone administered as per local protocol, patients could also receive macrolides as required by the attending physician. Study drug administration began up to 30 minutes prior to the first infusion of ceftriaxone, and no later than prior to the second infusion of ceftriaxone, and was continued for 72 hours after the last antibiotic administration to insure sufficient enzyme was available to inactivate residual antibiotic excreted into the intestine. Patients were monitored for diarrhea and then tested for CDI during and for 6-weeks after the primary course of ceftriaxone treatment. The study met its primary endpoint of significantly reducing the incidence of CDI in patients that received ribaxamase compared to placebo. A total of 3.4% of the placebo patients were diagnosed with CDI, while only 1.0% of ribaxamase patients developed CDI (risk reduction 2.4%, 95% CI –0.6 to 5.9; one-sided p=0.045), a 71% reduction in the incidence of CDI [19] including CDI caused by 027 strains [20].
During the Phase 2b study, fecal samples were collected at three prescribed points and analyzed using 16S rRNA gene sequencing to evaluate changes in the fecal microbiome as a representation of the changes to the gut microbiome. Here we report the findings of that analysis and demonstrate, consistent with its intended mechanism of action, ribaxamase appeared to protect the gut microbiome of patients treated with ceftriaxone from antibiotic-mediated damage.
Clinical Study (sample source)
A Phase 2b proof-of-concept study was conducted with ribaxamase from Nov. 2015 to Nov. 2016 (NCT02563106) [19]. This study enrolled 412 patients (average age 70), primarily from Eastern Europe, who were admitted to the hospital for treatment with ceftriaxone for a LRTI. Patients were randomized 1:1 to receive either ceftriaxone plus ribaxamase or ceftriaxone plus placebo. A key inclusion criterion for the study was that the patients were expected to receive at least five days of treatment with ceftriaxone. Study drug was administered during and for 72 hours after ceftriaxone treatment (Figure 1). Each group received similar ceftriaxone therapy, mean total amounts were 18.9 g for the ribaxamase group and 17.7 g for placebo, delivered for a median and mean of 11.0 days each. [19] Patients could also receive macrolides at the discretion of the treating physician. A similar number of patients in each treatment group received the additional macrolide treatment during the study, 76 (36.9%) in the ribaxamase group and 72 (35.0%) in the placebo group [19]. Patients were followed for diarrhea and the occurrence of CDI for 6-weeks post-ceftriaxone treatment.
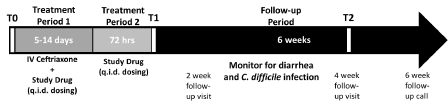
Figure 1. A Schematic representation of the Phase 2b clinical study design for ribaxamase. Patients were enrolled in the study and randomized 1:1 to receive either concurrent ribaxamase (150 mg) or placebo treatment q.i.d. during IV ceftriaxone treatment for their LRTI (Treatment Period 1, 5-14 days). Following completion of IV ceftriaxone treatment, the patients continued to receive their assigned study drug for an additional 72 hours (Treatment Period 2). Patients were followed for an additional 6 weeks for diarrhea and CDI. At three pre-specified points, fecal samples were collected for microbiologic determination of colonization by specific pathogens and microbiome analysis. These samples were collected as indicated by the white bars at T0, screening; T1, the conclusion of Treatment Period 2 and T2, the 4-week Follow-up visit
Sampling
During the course of the study, fecal samples for microbiome analysis and microbiologic determination of bacterial colonization with certain pathogens (e.g., vancomycin resistant enterococci [VRE]) were expected to be collected at three prescribed points from all participants. These samples were to be collected during screening (T0, Figure 1), at a clinical visit which occurred 72 hours post-ceftriaxone treatment and at the end of study drug treatment (T1) and at a 4-week follow-up visit (T2). The samples consisted of a rectal or fresh fecal swab (BD eSwab Collection Kit) to microbiologically assess colonization and a fresh fecal sample collected in Omnigene Gut collection tubes (DNA Genotek, Ottawa, Canada) as a representation of the gut microbiome. Both sample types were sent to a central lab (ACM Global) where the rectal swabs were plated on selective media to assess the presence of the pathogens, and the fecal samples for microbiome analysis were frozen for later analysis.
DNA extraction and sequencing
Frozen fecal samples were sent to DNA Genotek for DNA extraction, 16S rRNA gene sequencing and data analysis. All procedures were performed as per DNA Genotek’s protocols. Briefly, DNA was extracted and quantified, and library prep was performed with Illumina’s NexteraXT protocol. Amplicon sequencing was performed on the Illumina MiSeq platform and DNA was extracted with the MoBio PowerMag isolation kit on an automated KingFisher platform. Library prep was performed with a customized dual index version of Illumina’s Nextera XT protocol. The V3-V4 region of the 16S ribosomal subunit was amplified with custom polymerase chain reaction primers and sequenced on an Illumina MiSeq.
Read merging and quality filtering was performed on the raw sequencing reads to eliminate any sequencing artifacts and low quality reads. The FLASh algorithm [21] was used for read merging and automated rejection of low quality sequences; quality screening for length and ambiguous bases was performed with proprietary scripts. A curated taxonomic database was used to assign a taxonomic classification to the sequencing reads. A closed-reference taxonomic classification was performed, where each sequence was aligned to the curated SILVA version 123 reference database [22]. Sequences were aligned at 97% sequence identity using the NINJA-OPS algorithm, version 1.5.1 [23]. All samples were rarefied to 25,000 classified sequences per sample to eliminate effects of variance in sequencing depth, and samples with fewer than 25,000 classified sequences per sample were included in the complete operational taxonomic unit (OTU) table but excluded from further analysis.
Data analysis
Metadata supplied from the study was used in combination with study objectives as described below to sort samples by group and/or time point. The mean relative abundance of each group was calculated to visualize differential abundance between treatment groups or within a treatment group over time. Shannon diversity [24], observed OTUs and Chao1 diversity [25] were calculated for all samples. The statistical significance of differences between the comparison groups were then determined. Bray-Curtis dissimilarity [26], Weighted UniFrac distance, and Unweighted UniFrac distance [27] were used to determine the variance in an individual over time and the mean dissimilarity between individuals in each group. The Unweighted UniFrac distances were also used to calculate principal coordinates (PCoA) plots. Magnitude of change between time points was measured for both alpha and beta diversity, and significant differences between treatment groups, and between duration groups, were determined and visualized with box plots. Statistical analysis of the mean Chao1 diversity of macrolide-treated vs. non-macrolide-treated patients (Figure 6) was performed using Kruskal-Wallis non-parametric ANOVA with Dunn’s multiple comparisons test (GraphPad Prism 7).
The change in alpha diversity over time (the difference in alpha diversity in the post-antibiotic samples vs. the screening samples for each patient) was calculated by a mixed linear model which was built for each alpha diversity metric, with magnitude of change of alpha diversity as the response variable, the interaction between treatment and time point, gender, and age as fixed predictors, and the subject as a random predictor variable. Least-squares means were then computed for the combination of time point and treatment.
Significant differences in beta diversity due to time were calculated, and differences between treatment groups, using permutational Multivariate Analysis of Variance (perMANOVA) [28] on models with beta diversity as the response variable, the interaction between treatment and time point, gender, and age as predictors, and the subject as a stratifying variable. To determine pairwise differences, pairwise.perm.manova was applied to the models, using the Pillai-Bartlett statistic and False Discovery Rate (FDR) p-value adjustment [29].
To determine if significant differences in alpha diversity were observed between VRE colonized vs. non-colonized patients, first a generalized linear model (Gaussian family, “identity” link) was built, with Chao1 as the response variable, colonization status (colonized or not), gender, and age as predictor variables. Then general linear hypotheses testing was performed on the model, with differences determined by Tukey multiple comparisons of means testing [30].
Analysis groups
Intergroup and intragroup comparisons were made between treatment groups, ribaxamase vs. placebo-treated patients, at the three collection points. The mean of individual changes in relative abundance from point-to-point between the two groups were also determined. Comparisons were made between relative abundance (Chao1 alpha diversity) of T1 samples from VRE-colonized vs. non-colonized patients and the relative abundance of T1 and T2 samples from patients who received macrolide treatment during the study vs. those who did not.
Samples sequenced and analyzed
A total of 862 samples were collected out of a possible 1236 samples (Table 1). Of these collected samples, 676 were DNA extracted and sequenced. The criteria to sequence a sample was that there had to be a screening sample available for that study patient to serve as the baseline control for that patient’s other samples. These sequenced samples represented 229 study subjects of which 187 were full three sample sets (T0, T1 and T2). The other sets consisted of a screening sample and one other sample (T1 or T2). Of these samples sets, 112 were from study subjects treated with ceftriaxone plus ribaxamase and 117 were study subjects treated with ceftriaxone plus placebo. A total of 19 samples were collected and sequenced from patients diagnosed with CDI during the study and 46 samples were from patients with non-C. difficile, antibiotic-associated diarrhea (AAD). In addition, 129 samples were collected from patients after they had been treated with a macrolide, including azithromycin, clarithromycin, midecamycin or roxithromycin, along with ceftriaxone [19]. There were 81 samples collected at the T1 point from patients who were negative on screening and colonized with VRE at T1.
Table 1. Number of Various Sample Types Included in the Study (a In order to be sequenced, a patient had to have a screening sample to serve as their own control
b 652 samples sequenced initially in 5 batches + 24 supplemental samples from CDI and AAD patients
c Samples with fewer than 25,000 classified sequences per sample were excluded from further analysis
d 112 treated with ceftriaxone plus placebo and 117 treated with ceftriaxone plus ribaxamase
e As determined by microbiologic culture of feces on selective media
f T0 samples=6, T1 samples=58 and T2 samples=17
g T1 samples=72 and T2 samples=57, from patients who received macrolides prior to sampling)
Category |
Number |
Total possible samples |
1236 |
Samples collected |
862 |
Samples extracted and sequenced a |
676 b |
<25,000 classified sequences per sample c |
25 |
Patients represented d |
229 |
Full three samples sets |
187 |
Samples which coincided with VRE colonization e |
81 f |
Samples from patients who received macrolides |
129 g |
Fecal Microbiome Analysis
Mean relative abundance of phyla and genera by treatment assignment: Bacteroides and Firmicutes were the dominant phyla present in the fecal samples, and while there was some variation in the relative abundance of minor phyla during the study, the relative abundance of the major phyla remained fairly stable (Figure 2A). At the genus level, however, differences in relative abundance between the two treatment groups were more apparent (Figure 2B). For example, an increase in relative abundance of Enterococcus, was observed in T1 samples from patients treated with ceftriaxone plus placebo vs. those treated with ceftriaxone plus ribaxamase.
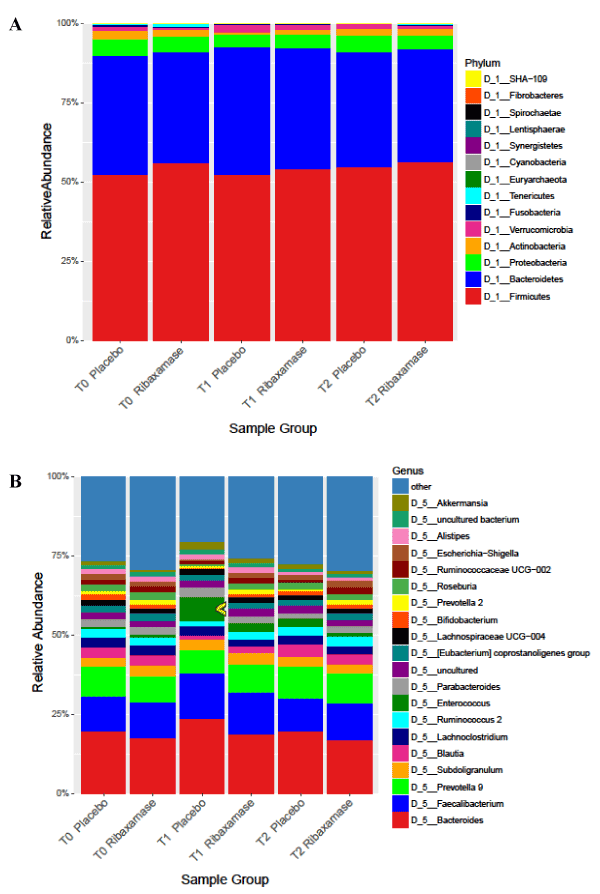
Figure 2. Mean relative abundance of phylum (A) and genus (B) at each time point for each treatment group. Individual colors indicate phyla or genera. Number of samples: T0 PBO=114, RBX=110; T1 PBO=102, RBX=105; T2 PBO=96, RBX=93.The yellow arrow on B was added for emphasis of the increased abundance of the Enterococcus genus at T1 in the placebo group
Changes in diversity
Alpha diversity: Alpha diversity was determined using three metrics, observed OTUs, Chao1 and Shannon index. The baseline alpha diversity at T0 was not significantly different by any metric between the two treatment groups (Table 2). There was a significant loss of alpha diversity at T1 observed with all three metrics in ceftriaxone plus placebo samples vs. ceftriaxone plus ribaxamase samples (Table 2 and Figure 3). By the T2 collection point, the alpha diversity of the placebo group samples remained significantly lower compared to the screening samples (Table 2). In contrast, the alpha diversity of the ribaxamase T2 samples were no longer significantly different from the screening samples (Table 2), suggesting that the microbiomes were recovering. The mean magnitude of change in alpha diversity over time for each patient (i.e., the change from T0 to T1, T1 to T2 and T0 to T2) for the various metrics supported these findings with the placebo-treated patients demonstrating significantly more change than the ribaxamase-treated patients for the three intervals (Table 3).
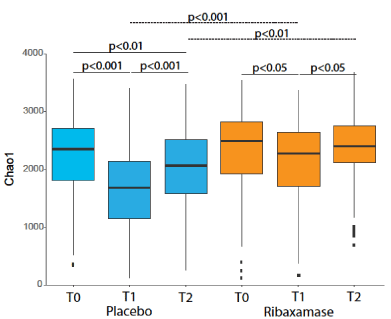
Figure 3. Box plot of the mean Chao1 diversity of the fecal microbiome for each treatment group, placebo (blue) and ribaxamase (orange) at each collection point (T0, T1, T2). The median is marked by a horizontal line, and the whiskers represent +/- 1.5 times the interquartile range. Outliers are marked as individual points. The significance of the differences (P value) between sample groups are depicted on the figure. If a P value is not shown on the figure then there was no significant difference between the collection points. Number of samples: T0 PBO=114, RBX=110; T1 PBO=102, RBX=105; T2 PBO=96, RBX=93
Table 2. Comparison of Various alpha Diversity Metrics, Placebo vs. Ribaxamase and by Collection Point (P value of contrast) (a Number of samples included in group
b Placebo was lower than ribaxamase for all three diversity metrics
c T1 was lower than T0 for all three diversity metrics
d T2 was higher than T1 for all three diversity metrics
e T2 was lower than T0 for all three diversity metrics)
Collection Point |
Contrast |
OTUs |
Chao1 Diversity |
Shannon Index |
T0 |
Placebo (114)a vs. ribaxamase (110) |
0.3728 |
0.5199 |
0.8811 |
T1 |
Placebo (102) vs. ribaxamase (105) b |
<0.0001 |
<0.0001 |
0.0005 |
T2 |
Placebo (96) vs. ribaxamase (93) b |
0.0014 |
0.0011 |
0.0482 |
Treatment Group |
|
|
|
|
Placebo |
T0 (114) vs. T1(102) c |
<0.0001 |
<0.0001 |
<0.0001 |
Placebo |
T1 (102) vs. T2 (96) d |
0.0001 |
0.0002 |
0.0083 |
Placebo |
T0 (114) vs. T2 (96) e |
0.0081 |
0.0015 |
0.1078 |
Ribaxamase |
T0 (110) vs. T1 (105) c |
0.0069 |
0.0104 |
0.3522 |
Ribaxamase |
T1 (105) vs. T2 (93) d |
0.0132 |
0.0252 |
0.3226 |
Ribaxamase |
T0 (110) vs. T2 (93) |
0.9969 |
0.9829 |
0.9923 |
Table 3. Comparison of Changes in Various alpha Diversity Metrics Over Time, Placebo vs. Ribaxamase (P value of contrast)
(a The change over time was a significantly greater reduction from the first to the second collection point for placebo vs. ribaxamase)
Alpha Diversity Metric |
T0 to T1 a |
T1 to T2 |
T0 to T2 a |
OTUs |
0.0004 |
0.1785 |
0.0550 |
Chao1 Diversity |
0.0002 |
0.1678 |
0.0296 |
Shannon Index |
0.0027 |
0.1450 |
0.1965 |
Beta diversity: Beta diversity was also determined using three metrics, Bray-Curtis dissimilarity, Weighted and Unweighted UniFrac distances. Consistent with the alpha diversity data, the beta diversity of the T0 screening samples was not significantly different between both treatment groups by any metric (Table 4). Placebo group T1 samples displayed a significant loss of beta diversity as determined by principle coordinate analysis using Unweighted UniFrac distances compared with the screening samples (P<0.001; Figure 4 and Table 4). In contrast, beta diversity of the ribaxamase group T1 samples was not altered significantly from baseline compared to those of the placebo groups (Table 4). At T2, the ribaxamase group appeared to have recovered to near baseline (Figure 4), while the placebo group remained significantly disrupted (Table 4). These Unweighted UniFrac distance data were supported by Bray-Curtis dissimilarity analysis of the placebo samples which demonstrated similar significant differences between T0 and T1 samples and T1 and T2 samples (Table 4). However, Weighted UniFrac distance analysis did not reach statistical significance in placebo or ribaxamase groups at any of the three collection points (Table 4). When the mean magnitude of change in beta diversity metrics over time (i.e., the change from T0 to T1, T1 to T2 and T0 to T2) were calculated, significant differences in the magnitude of change were again observed for the placebo group vs. the ribaxamase group by Bray Curtis dissimilarity and Unweighted UniFrac distance analyses for all three point-wise comparisons (Table 5). In addition, a significant change in beta diversity was observed from T1 to T2 in the placebo group as compared with the change in the ribaxamase group when analyzed using Weighted UniFrac distances (Table 5).
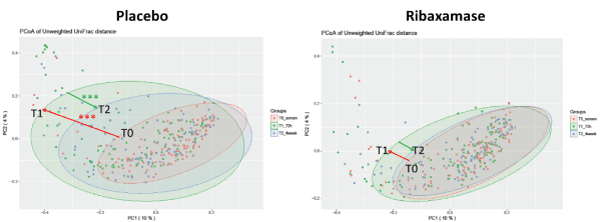
Figure 4. Principle coordinate analyses of the Unweighted Unifrac Distances. The plots depict the phylogenetic distribution of the two treatment groups (placebo and ribaxamase) at each of the three collection points (T0 (pink), T1 (green), T2 (blue). The colored arrows are added for emphasis to indicate the change from T0 to T1 (loss of diversity, red arrow) and the change from T1 to T2 (recovery, green arrow). The asterisks indicate a significant difference between the change in phylogenetic distribution from T0 to T1 and T1 to T2 within the placebo group as well as compared with the ribaxamase group, ***, P < 0.01. If a P value is not displayed there was no significant difference between data sets. Number of samples: T0 PBO=114, RBX=110; T1 PBO=102, RBX=105; T2 PBO=96, RBX=93
Table 4. Comparison of Various beta Diversity Metrics, Placebo vs. Ribaxamase and by Collection Point (P value of contrast)
(a Number of samples included in group
b Placebo was lower than ribaxamase for Bray-Curtis and Unweighted UniFrac
c Placebo was lower than ribaxamase for Unweighted UniFrac
d T1 was lower than T0 for all three diversity metrics
e T2 was higher than T1 for Bray-Curtis and Unweighted UniFrac
f T2 was lower than T0 for Unweighted UniFrac)
Collection Point |
Contrast |
Bray-Curtis |
Unweighted UniFrac |
Weighted UniFrac |
T0 |
Placebo (114)a vs. ribaxamase (110) |
0.8804 |
0.9257 |
0.6170 |
T1 |
Placebo (102) vs. ribaxamase (105) b |
0.0180 |
0.0025 |
0.4350 |
T2 |
Placebo (96) vs. ribaxamase (93) c |
0.5150 |
0.0064 |
0.4690 |
Treatment Group |
|
|
|
|
Placebo |
T0 (114) vs. T1 (102) d |
0.0037 |
0.0025 |
0.0800 |
Placebo |
T1 (102) vs. T2 (96) e |
0.0037 |
0.0025 |
0.1420 |
Placebo |
T0 (114) vs. T2 (96) f |
0.8804 |
0.0319 |
0.5460 |
Ribaxamase |
T0 (110) vs. T1 (105) |
0.7575 |
0.0614 |
0.5540 |
Ribaxamase |
T1 (105) vs. T2 (93) |
0.9950 |
0.1713 |
0.5540 |
Ribaxamase |
T0 (110) vs. T2 (93) |
0.9950 |
0.9920 |
0.971 |
Table 5. Comparison of Changes in Various beta Diversity Metrics Over Time, Placebo vs. Ribaxamase (P value of contrast)
(a The change over time was a significant greater reduction in the metric from the first to the second collection point for placebo vs. ribaxamase
b The change over time was a significant greater increase in the metric from the first to the second collection point for placebo vs. ribaxamase)
Beta Diversity Metric |
T0 to T1 a |
T1 to T2 b |
T0 to T2 a |
Bray-Curtis |
0.0059 |
0.0033 |
0.0418 |
Unweighted UniFrac |
0.0001 |
0.0003 |
0.0003 |
Weighted UniFrac |
0.1356 |
0.0119 |
0.1321 |
VRE colonization: During the Phase 2b study, a significantly greater number of placebo patients developed new colonization with VRE as determined microbiologically and defined as negative on screening and then positive at one or both of the two subsequent collection points, T1 and T2, compared with ribaxamase patients (69 placebo and 36 ribaxamase, P=0.0001 and 71 placebo and 40 ribaxamase, P=0.0002, respectively) [19]. A significant reduction in mean alpha diversity, measured with the Chao1 metric, was observed in fecal samples collected from VRE-colonized patients compared to un-colonized patient samples (P<0.001; Figure 5).
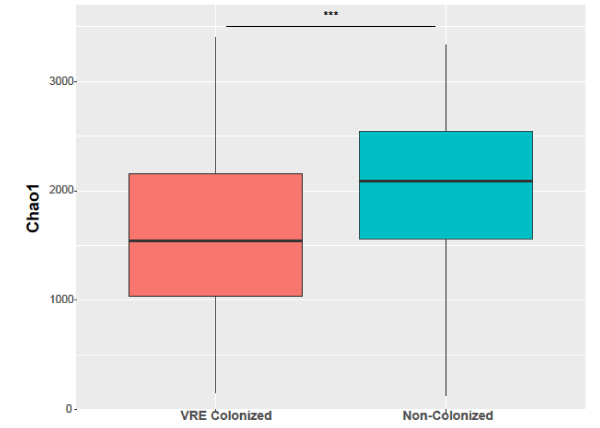
Figure 5. Chao1 diversity plotted by VRE colonization status (VRE colonized, pink; non-colonized, blue) at the second time point (T1). The box spans the first and third quartiles. The median is marked by a horizontal line, and the whiskers represent +/- 1.5 times the interquartile range. *** P<0.001. Number of samples: VRE Colonized=55, Non-colonized=152
Monodomination has been defined as ≥30% of gut microbiome composition consisting of a single genera and is considered to negatively impact patient health [31]. Analysis of the relative abundance of enterococci in patient microbiomes revealed that 15 patients treated with placebo became dominated by enterococci, compared to only four patients that received ribaxamase (P=0.004). Consistent with this observation, six of these enterococcally-dominated placebo patients and only one of the dominated ribaxamase patients were also colonized by VRE as determined by microbiologic methods.
Macrolide use: During the course of the Phase 2b study, treatment of the LRTI with ceftriaxone could be augmented with the use of macrolides at the discretion of the treating physician. A total of 76 patients in the ribaxamase group and 72 patients in the placebo group received macrolides in addition to ceftriaxone prior to the T2 collection point [19]. From these patients, 72 fecal samples were collected at T1 and 57 at T2. Analysis of the mean alpha diversity at each collection point (Chao1 shown as an example, Figure 6) revealed that adding macrolides to the ceftriaxone treatment lead to a further reduction in alpha diversity at T1 and T2 as compared with patients who did not receive macrolides. This reduction appeared more dramatic in patients treated with macrolides in the ceftriaxone plus ribaxamase group than the placebo group.
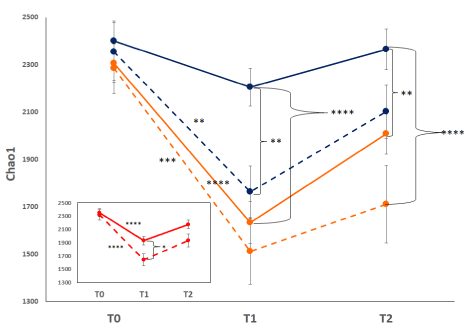
Figure 6. Mean Chao1 diversity macrolide-treated vs. non-macrolide treated patients. The mean Chao1 index for each collection point is displayed: placebo (blue) vs. ribaxamase (orange), macrolide-treated (dashed lines) vs. non-macrolide-treated (solid lines). Error bars indicate standard error. Inset: mean Chao1 of all samples from macrolide-treated patients (dashed line) vs. non-macrolide treated patients (solid line). Significance differences are depicted as asterisks: * P=0.1, ** P<0.05, *** P=0.0001, **** P<0.0001. Number of samples: T0 PBO=82, PBO+macrolide=33, RBX=75, RBX+macrolide=36; T1 PBO=74, PBO+macrolide=36, RBX=80, RBX+macrolide 36; T2 PBO=76, PBO+macrolide=25, RBX=66, RBX+macrolide=32. Inset number of samples: TO no macrolide=157, macrolide=69; T1 no macrolide=154, macrolide=72; T2 no macrolide=142, macrolide=57
Comparisons of diversity by study endpoints: CDI and AAD: The primary endpoint of the Phase 2b study was development of CDI as diagnosed by the local clinical laboratory [19]. CDI was defined as diarrhea and the detection of the C. difficile toxins (or their genes) in the diarrheal fecal sample. If a diarrheal sample was negative for the toxins, then it was defined as non-C. difficile, antibiotic-associated diarrhea (AAD). By these criteria, nine patients were diagnosed with CDI (seven placebo and two ribaxamase) while 23 patients met the criteria for non-C. difficile AAD (12 placebo and 11 ribaxamase) [19]. From these patients, 19 and 46 fecal samples were collected respectively. Comparison of the mean alpha diversity for all CDI vs. all non-CDI samples demonstrated a significant difference in all three indices (Table 6), while AAD vs. non-AAD samples were only significantly different in terms of Chao1 diversity, but not the other two indices (Table 6). No significant difference in any alpha diversity metrics was observed between samples collected from CDI patients treated with ribaxamase vs. those treated with placebo, and no significant differences were observed in CDI vs. AAD samples (Table 6).
Beta-diversity metrics were obtained by adjusting for age, gender, and stratifying by patient to compare treatment groups and sample collection points. Significant differences in beta diversity were observed between CDI and AAD samples for weighted and unweighted UniFrac, CDI and non-CDI samples for Bray-Curtis dissimilarity and Unweighted UniFrac, and AAD and non-AAD samples for all three metrics (Table 6).
Table 6. Comparison of alpha and beta Diversity Metrics by Study Endpoints (a Alpha diversity metrics were used as the response variable for three linear mixed models. Predictor variable for each model included study outcome, gender and age. Patient ID was used as the stratifying variable and least squares means were calculated for each model, b Number of samples, c Includes AAD samples, d Includes CDI samples
e Beta diversity metrics were used as the response variable for three linear mixed effect models. Predictor variable for each model included study outcome, gender and age, and patient ID was used as the stratifying variable to test the interaction between study outcome collection points and treatment groups. perMANOVA was used for each model)
alpha Diversity a |
Estimate |
Standard error |
Degrees freedom |
t ratio |
P value |
CDI (19)b vs. non-CDI (589)c |
|
|
|
|
|
Chao1 |
-568.2 |
211.0 |
291.7 |
-2.693 |
0.0075 |
Observed OTUs |
-370.8 |
148.6 |
294.3 |
-2.496 |
0.0131 |
Shannon Index |
-0.675 |
0.269 |
303.0 |
-2.509 |
0.0126 |
AAD (46) vs. non-AAD (543)d |
|
|
|
|
|
Chao1 |
-328.1 |
138.9 |
273.6 |
-2.362 |
0.0189 |
Observed OTUs |
-190.3 |
97.9 |
274.8 |
-1.944 |
0.0529 |
Shannon Index |
-0.159 |
0.177 |
275.5 |
-0.899 |
0.3693 |
beta Diversity e |
Df |
Sum of Squares |
Mean Squares |
F. Model |
R2 |
Pr(>F) |
CDI (19) vs. AAD (46) |
|
|
|
|
|
|
Bray-Curtis |
1 |
0.5503 |
0.55033 |
1.24644 |
0.02187 |
0.051 |
Unweighted UniFrac |
1 |
0.3268 |
0.32685 |
1.10814 |
0.01943 |
0.023 |
Weighted UniFrac |
1 |
0.1676 |
0.16755 |
1.13084 |
0.01434 |
0.046 |
CDI (19) vs. non-CDI (589) |
|
|
|
|
|
|
Bray-Curtis |
1 |
0.712 |
0.71221 |
1.62617 |
0.00249 |
0.001 |
Unweighted UniFrac |
1 |
0.520 |
0.52046 |
1.8799 |
0.00284 |
0.001 |
Weighted UniFrac |
1 |
0.177 |
0.17671 |
1.0194 |
0.00154 |
0.103 |
AAD (46) vs. non-AAD (543) |
|
|
|
|
|
|
Bray-Curtis |
1 |
0.866 |
0.86616 |
1.97947 |
0.00302 |
0.001 |
Unweighted UniFrac |
1 |
0.688 |
0.68802 |
2.4854 |
0.00375 |
0.001 |
Weighted UniFrac |
1 |
0.66 |
0.66031 |
3.8205 |
0.00576 |
0.013 |
Ribaxamase is designed to protect the gut microbiome from excess β-lactam antibiotics, which are excreted into the GI following IV administration [15]. The potential clinical efficacy of ribaxamase was demonstrated in a Phase 2b study where the addition of ribaxamase to ceftriaxone treatment of a LRTI significantly reduced the incidence of CDI [19]. CDI is strongly linked to the use of antibiotics, which perturb the balance of the gut microbiome thus reducing colonization resistance afforded by an intact microbiome [1]. The results of the present follow-on analysis of fecal samples collected during the Phase 2b study were consistent with ribaxamase reducing gut microbiome disruption in patients treated with ceftriaxone plus ribaxamase as compared with those treated with ceftriaxone plus placebo. This conclusion was supported by both static analysis of the alpha and beta diversity at the three collection points (Figures 3 and 4 and Tables 2 and 4) as well as the intra-patient changes in alpha and beta diversity between collection points (Tables 3 and 5). While there was some loss of diversity in the ribaxamase group at the T1 collection point as compared with T0, the loss was significantly less than that seen in the placebo group and the diversity of the ribaxamase group appeared to recover to near their baseline by T2 while the placebo group remained significantly disrupted (Table 2).
Differences between the two treatment groups in terms of beta diversity were less for Weighted Unifrac distance than for Unweighted Unifrac distance or Bray-Curtis Dissimilarity. Weighted Unifrac distance is a dissimilarity distance metric that uses the phylogenetic distribution of the OTU’s in a sample together with the relative abundance of those OTU’s to measure the distance between two samples, while Unweighted Unifrac distance also measures the phylogenetic distribution of the OTU’s in a sample, but relies only on presence/absence data instead of abundance data [27]. Qualitative measurements that disregard relative abundance such as Unweighted UniFrac, are frequently used to detect permanent changes in a community, such as those caused by antibiotic disruption of the microbiome, while more quantitative measures, such as Weighted UniFrac, reveal the effects of more transient factors such as nutritional changes [32]. The distinct applications of these diversity metrics may help to explain the differences seen in the results for these analyses in this study.
The Phase 2b ribaxamase study was designed to recruit patients at higher risk for CDI. The patients were older (actual mean age was 70), expected to be hospitalized and receive ≥5 days of ceftriaxone treatment (actual median of 8 days ceftriaxone treatment and average days in hospital ranged from a mean of 6 in the US/Canada to 13 in Serbia) and sicker (pneumonia index score [33] of 90-130) [19]. Thus, the baseline health of the gut microbiome for this patient group would already be expected to be reduced as compared with a younger, healthier population [34]. When the alpha diversity of the gut microbiomes of patients who met the study endpoints of CDI and non-C. difficile AAD were compared with the rest of the patients, these endpoint populations displayed a significant reduction in microbiome alpha diversity (Table 6). Thus, while the study population was likely less fit in terms of baseline gut microbiome diversity compared with the general population, those that developed CDI and AAD suffered a further degradation of their gut microbiomes that coincided with disease progression.
One of the potential benefits of gut microbiome analysis is to develop indices to allow clinicians to predict when patients might be at heighten risk for development of serious complications like CDI [35, 36]. While there was a limited number of samples available from the endpoint populations during the study, it was interesting to note that there was a significant difference between CDI and non-CDI samples by all three alpha diversity metrics, but no significant difference in alpha diversity between CDI patients between the two treatment groups. This may suggest that the patients who were diagnosed with CDI during the study may have reached some minimal alpha diversity threshold beyond which they were no longer able to resist colonization and outgrowth by C. difficile. There was less difference between AAD and non-AAD patients suggesting that that AAD patients may have had less disruption of their gut microbiome than CDI patients, although the differences in microbiome diversity between CDI and AAD patients were not significant. Comparison of beta diversity metrics, however, demonstrated significant differences between both CDI and non-CDI and AAD and non-AAD patients when collection point and treatment group were considered in the analysis. Collectively, these data suggest that some minimal threshold of microbiome diversity may exist that could be predictive of risk. A limitation of this study was the few patient samples available from the endpoint populations for comparison, and thus, analysis of considerably more samples from distinct populations would be necessary to develop and validate any microbiome index.
Disruption of the gut microbiome can lead to colonization by opportunistic pathogens like C. difficile and other organisms [1,2,37]. Enterococci are notorious for colonizing the gut subsequent to microbiome perturbation [38-40] and are strongly associated with development of CDI [38,39]. Often, these enterococci are vancomycin-resistant, and colonization with VRE is an important risk factor for development of enterococcal bacteremia [41-43]. The Phase 2b study revealed that significantly more placebo than ribaxamase patients became newly colonized with VRE [19] and in this analysis, a correlation between VRE-colonization and loss of microbiome diversity was demonstrated (Figure 5). Alterations to the gust microbiome can also lead to dominance by a single genera, often Enterococcus [31]. A total of 19 patients for whom enterococci comprised ≥30% of their gut microbiome were identified, 15 in placebo and four in the ribaxamase group, however, no systemic enterococcal infections were observed during the study and follow-up period. These results are further support that ribaxamase limited disruption of the gut microbiome in the ceftriaxone-treated patients.
During the course of the Phase 2b ribaxamase study, the treating physician had the option of adding macrolide treatment to the prescribed ceftriaxone. The addition of macrolides appeared to exacerbate the loss of alpha diversity as compared with ceftriaxone alone (Figure 6, inset). Comparison of each treatment group revealed a greater drop in diversity in the ribaxamase patients who also received macrolides than that observed for placebo patients (Figure 6). This more pronounced effect was likely due to the ribaxamase treated patients retaining a less disrupted microbiome and thus having more diversity to lose when exposed to macrolides. Of the nine patients who developed CDI during the study, six (five placebo and one ribaxamase) received macrolides in addition to ceftriaxone. As the risk for CDI is related to the number of classes of antibiotics administered [6,10], these data are consistent with macrolides causing additional microbiome damage thereby increasing the risk for CDI. While similar numbers of patients in each treatment group received macrolides, there were significantly fewer in the ribaxamase group who developed CDI (risk reduction 2.4%, 95% CI –0.6 to 5.9; one-sided p=0.045) [19]. These data support the concept that reducing the amount of excess cephalosporin in the gut can lower the risk for CDI even if other antibiotics, like macrolides, are also administered.
While antibiotics are essential for treatment of serious bacterial infections, they can have the unintended consequence of disrupting the gut microbiome. This disruption not only increases the risk for opportunistic infections, like CDI, but can also have other deleterious, long lasting health effects [17]. The oral ribaxamase approach takes advantage of a natural defensive agent, a β-lactamase that bacteria normally use to protect themselves from antibiotics, to instead shield the gut microbiota from β-lactam collateral damage. The data presented here, in addition to the results from the Phase 2b study [19], demonstrate the utility of this novel prophylactic strategy and support the continued development of ribaxamase as a gut microbiome protectant for patients receiving IV β-lactams. Ribaxamase may especially benefit patients who require prolonged IV β-lactam therapy, such as the hematopoietic cell transplantation population, who are at high risk for developing adventitious infections and additional complications including acute graft vs. host disease caused by antibiotic-mediated microbiome damage [44].
The Phase 2b ribaxamase study and subsequent sample analysis were funded by Synthetic Biologics, Inc.
The Phase 2b ribaxamase study protocol and informed consent forms were approved by the appropriate institutional review boards or ethics committees, and all study patients provided written consent to participate in the study and have analysis of their fecal samples conducted.
JK-K and SC are, or were, employees of Synthetic Biologics, Inc. who is developing ribaxamase for commercial use.
We would like to thank Chenxiong Le for reviewing the manuscript and Evan Byers, Denise Lynch and the team at DNA Genotek for their excellent technical support. We would also like to thank the investigators and study coordinators from the Phase 2b ribaxamase study for their diligence in collecting the fecal samples used for this analysis and the patients for providing the samples.
JK-K conceived of and designed the study, analyzed the data and wrote the manuscript. SC analyzed the data and reviewed the manuscript. Both authors read and approved of the final manuscript.
- Britton RA, Young VB (2014) Role of the intestinal microbiota in resistance to colonization by Clostridium difficile. Gastroenterology 146: 1547-1553.
- Vincent C, Manges AR (2015) Antimicrobial use, human gut microbiota and Clostridium difficile colonization and infection. Antibiotics (Basel) 4: 230-253.
- Yuille S, Mackay WG, Morrison DJ, Tedford MC (2015) Optimising gut colonisation resistance against Clostridium difficile infection. Eur J Clin Microbiol Infect Dis 34: 2161-2166.
- Zacharioudakis IM, Zervou FN, Pliakos EE, Ziakas PD, Mylonakis E (2015) Colonization with toxinogenic C. difficile upon hospital admission, and risk of infection: A systematic review and meta-analysis. The American Journal of Gastroenterology 110: 381.
- Kochan TJ, Somers MJ, Kaiser AM, Shoshiev MS, Hagan AK, et al. (2017) Intestinal calcium and bile salts facilitate germination of Clostridium difficile spores. PLoS Pathog 13: e1006443.
- Crowther GS, Wilcox MH (2015) Antibiotic therapy and Clostridium difficile infection - primum non nocere - first do no harm. Infect Drug Resist 8: 333-337.
- Kuntz JL, Smith DH, Petrik AF, Yang X, Thorp ML, et al. (2016) Predicting the risk of Clostridium difficile Infection upon admission: A score to identify patients for antimicrobial stewardship efforts. Perm J 20: 20-25.
- Dubberke ER, Olsen MA, Stwalley D, Kelly CP, Gerding DN, et al. (2016) Identification of medicare recipients at highest risk for Clostridium difficile infection in the US by population attributable risk analysis. PLoS One 11: e0146822.
- Knecht H, Neulinger SC, Heinsen FA, Knecht C, Schilhabel A, et al. (2014) Effects of beta-lactam antibiotics and fluoroquinolones on human gut microbiota in relation to Clostridium difficile associated diarrhea. PLoS One 9: e89417.
- Stevens V, Dumyati G, Fine LS, Fisher SG, van Wijngaarden E (2011) Cumulative antibiotic exposures over time and the risk of Clostridium difficile infection. Clin Infect Dis 53: 42-48.
- Wieczorkiewicz JT, Lopansri BK, Cheknis A, Osmolski JR, Hecht DW, et al. (2016) Fluoroquinolone and macrolide exposure predict Clostridium difficile infection with the highly fluoroquinolone- and macrolide-resistant epidemic C. difficile strain BI/NAP1/027. Antimicrob Agents Chemother 60: 418-423.
- Slimings C, Riley TV (2015) Antibiotics and hospital-acquired Clostridium difficile infection: update of systematic review and meta-analysis. J Antimicrob Chemother 69: 881-891.
- Karachalios G, Charalabopoulos K (2002) Biliary excretion of antimicrobial drugs. Chemotherapy 48: 280-297.
- Kokai-Kun JF, Roberts T, Coughlin O, Sicard E, Rufiange M, et al. (2017) The oral beta-lactamase SYN-004 (ribaxamase) degrades ceftriaxone excreted into the intestine in phase 2a clinical studies. Antimicrob Agents Chemother 61.
- Kaleko M, Bristol JA, Hubert S, Parsley T, Widmer G, et al. (2016) Development of SYN-004, an oral beta-lactamase treatment to protect the gut microbiome from antibiotic-mediated damage and prevent Clostridium difficile infection. Anaerobe 41: 58-67.
- Bristol A, Hubert S, Hofmann F, Baer H (2017) Formulation development of SYN-004 (ribaxamase) oral solid dosage form, a beta-lactamase to prevent intravenous antibiotic-associated dysbiosis of the colon. Int J Pharm 534: 25-34.
- Kinross JM, Darzi AW, Nicholson JK (2011) Gut microbiome-host interactions in health and disease. Genome Med 3: 14.
- Roberts T, Kokai-Kun JF, Coughlin O, Lopez BV, Whalen H, et al. (2016) Tolerability and pharmacokinetics of SYN-004, an orally administered beta-lactamase for the prevention of Clostridium difficile-associated disease and antibiotic-associated diarrhea, in two phase 1 studies. Clin Drug Investig 36: 725-734.
- Kokai-Kun JF, Roberts T, Coughlin O, Le C, Whalen H, et al. (2019) Use of ribaxamase (SYN-004), a β-lactamase, to prevent Clostridium difficile infection in β-lactam-treated patients: a double-blind, phase 2b, randomised placebo-controlled trial. The Lancet Infectious Diseases 19: 487-496.
- Kokai-Kun JF, Sarver JL, Carman RJ (2018) Characterization of Clostridium difficile isolates collected during a phase 2b clinical study with SYN-004 (ribaxamase) for the prevention of C. difficile infection. Anaerobe 53: 30-33.
- Magoc T, Salzberg SL (2011) FLASH: fast length adjustment of short reads to improve genome assemblies. Bioinformatics 27: 2957-2963.
- Quast C, Pruesse E, Yilmaz P, Gerken J, Schweer T, et al. (2013) The SILVA ribosomal RNA gene database project: improved data processing and web-based tools. Nucleic Acids Res 41: D590-596.
- Al-Ghalith GA, Montassier E, Ward HN, Knights D (2016) NINJA-OPS: Fast accurate marker gene alignment using concatenated ribosomes. PLoS Comput Biol 12: e1004658.
- Shannon CE (2001) A mathematical theory of communication. ACM SIGMOBILE Mobile Computing and Communications Review 5: 3.
- Chao A (1984) Nonparametric estimation of the number of classes in a population. Scandinavian J Statistics 11: 265-270.
- Bray JR, Curtis JT (1957) An ordination of the upland forest communities of southern Wisconsin. Ecological Monographs 27: 325-349.
- Lozupone C, Lladser ME, Knights D, Stombaugh J, Knight R (2011) UniFrac: an effective distance metric for microbial community comparison. ISME J 5: 169-172.
- Anderson MJ (2001) A new method for non-parametric multivariate analysis of variance. Austral Ecology 26: 32-46.
- Pillai KCS (1955) Some new test criteria in multivariate analysis. Ann Math Stat 26: 117-121.
- Tukey JW (1949) Comparing individual means in the analysis of variance. Biometrics 5: 99-114.
- Taur Y, Xavier JB, Lipuma L, Ubeda C, Goldberg J, et al. (2012) Intestinal domination and the risk of bacteremia in patients undergoing allogeneic hematopoietic stem cell transplantation. Clin Infect Dis 55: 905-914.
- Lozupone C, Hamady M, Kelley ST, Knight R (2007) Quantitative and qualitative b-diversity measures lead to different insights into factors that structure microbial communities. Appl Envir Microbiol 73: 1576-1585.
- Fine MJ, Auble TE, Yealy DM, Hanusa BH, Weissfeld LA, et al. (1997) A prediction rule to identify low-risk patients with community-acquired pneumonia. N Engl J Med 336: 243-250.
- Zapata HJ, Quagliarello VJ (2015) The microbiota and microbiome in aging: potential implications in health and age-related diseases. J Am Geriatr Soc 63: 776-781.
- Santiago M, Allergretti J, Aroniadis O, Brandt L, Budree S, et al. (2017) A human micorbiome disruption index can identify recurrent Clostridium difficile infection and increases with antibiotic use. In: Carattoli A, Peixe L, ASM Microbe. New Orleans, LA, ASM Press.
- Halpin AL, Man TJ, Kraft CS, Perry KA, Chan AW, et al. (2016) Intestinal microbiome disruption in patients in a long-term acute care hospital: a case for development of microbiome disruption indices to improve infection prevention. Am J Infect Control 44.
- Freedberg DE, Zhou MJ, Cohen ME, Annavajhala MK, Khan S, et al. (2018) Pathogen colonization of the gastrointestinal microbiome at intensive care unit admission and risk for subsequent death or infection. Intensive Care Med 44: 1203-1211.
- Dumford DM, 3rd, Nerandzic M, Chang S, Richmond MA, Donskey C (2011) Epidemiology of Clostridium difficile and vancomycin-resistant Enterococcus colonization in patients on a spinal cord injury unit. J Spinal Cord Med 34: 22-27.
- Fujitani S, George WL, Morgan MA, Nichols S, Murthy AR (2011) Implications for vancomycin-resistant Enterococcus colonization associated with Clostridium difficile infections. Am J Infect Control 39: 188-193.
- Kamboj M, Chung D, Seo SK, Pamer EG, Sepkowitz KA, et al. (2010) The changing epidemiology of vancomycin-resistant Enterococcus (VRE) bacteremia in allogeneic hematopoietic stem cell transplant (HSCT) recipients. Biol Blood Marrow Transplant 16: 1576-1581.
- Miller WR, Munita JM, Arias CA (2014) Mechanisms of antibiotic resistance in enterococci. Expert Rev Anti Infect Ther 12: 1221-1236.
- Gold HS (2001) Vancomycin-resistant enterococci: mechanisms and clinical observations. Clin Infect Dis 33: 210-219.
- Alevizakos M, Gaitanidis A, Nasioudis D, Tori K, Flokas ME, et al. (2017) Colonization with vancomycin-resistant enterococci and risk for bloodstream infection among patients with malignancy: a systematic review and meta-analysis. Open Forum Infect Dis 4: ofw246.
- Andermann TM, Peled JU, Ho C, Reddy P, Riches M, et al. (2018) The microbiome and hematopoietic cell transplantation: Past, present, and future. Biol Blood Marrow Transplant 24: 1322-1340.