Considerable evidence has accumulated for outbreaks of a novel type of infectious agent. Deaths, medical admissions, bed occupancy, ED and outpatient attendances, NHS staff sickness absence, stillbirths, the gender ratio at birth, and certain types of congenital malformations all simultaneously increase. This study uses social groups across the whole of England and Wales to demonstrate that female deaths are especially increased during these presumed infectious events, and that the pattern of deaths over time appears to be influenced by social behaviours. The effect upon NHS staff sickness absence appears to occur before that upon deaths. A very significant increase in deaths in 2015 is also investigated. Evidence suggests that this increase was due to an interaction between influenza and the proposed novel infectious agent. Analysis by social group demonstrates that white British bore the primary brunt of this unique event. The social group most affected (with around an 8% increase in deaths over 2014) was older people living in communal establishments (nursing homes and retirement homes), where proximity and the movement of staff appears to have led to enhanced person to person transmission with catastrophic consequences. The increase in 2015 was replicated across most of Europe with a few notable exceptions. The potential role of immune switching and of the immune modifying virus, cytomegalovirus, in these outbreaks is discussed.
death, emerging infectious diseases, social groups, volatility, social behaviours, deaths in 2015, immune switching
Recent research has highlighted the role of outbreaks of a presumed infectious agent which leads to on/off (up/down) switching of deaths, medical admissions, hospital bed occupancy, emergency department and outpatient attendances, staff sickness absence, human fertility, the gender ratio at birth, stillbirths, and the incidence of certain congenital conditions [1-29]. Females are affected more so than males via spontaneous abortion of the female foetus and medical admissions in the elderly [27]. Complex very small area spatial spread of mini-epidemics (occurring all the time) is involved leading to larger national level events every 2 to 5 years [3,5,7,8,11,13,14,20]. These events are international in scope and have been demonstrated across the whole of Europe and all other Western countries [10,15]. Far wider scope appears entirely likely, and this agent may eventually be recognised as the ultimate source or exacerbating factor behind more deaths than influenza and other large scale sources of mortality.
This study aims to provide insight into the role of social behaviours in the magnitude and timing of the outbreaks, and to investigate an unusual increase in deaths in 2015 which swept across most of Europe and elsewhere in the world.
Data sources
Annual deaths were obtained from the following sources: Australia (2003 to 2015, Australian Bureau of Statistics), 45 European countries (2013 to 2015, Eurostat deaths (total) by month), England and Wales (2013 to 2015, Office for National Statistics deaths by area of residence), Scotland (2013 to 2015, National Records of Scotland).
Output area annual deaths for males and females in England and Wales (2001 to 2015) from the Office for National Statistics. Output Area Classification lookup tables for England and Wales from the Office for National Statistics (ONS).
NHS staff sickness absence was obtained from NHS Digital.
Analysis
Direct year-on-year percentage differences for local government areas in the UK, Europe and Australia.
Output Area (OA) deaths were aggregated into social groups using the Output Area Classifications for England and Wales, and for London, from the ONS and the London Data Store. Difference between successive years were calculated as Standard Deviation equivalents (STDEV) using Poisson statistics as per previous studies [11-15,20].
The ratio of male to female deaths was calculated for various LOAC. A simple linear trend line (Microsoft Excel) was then fitted to this trend after excluding high years. The excess of female deaths relative to the trend was then calculated.
Analysis of the data is presented in two sections. In the first, social groups from England and Wales are used to investigate the roles of gender and social behaviours on the magnitude and timing of the infectious events.
In the second part, data on deaths is examined across the UK, Europe and Australia. Potential causes behind an unusual international increase in deaths in 2015 are examined.
Female specificity
Figure 1 investigates the magnitude of the year-to-year volatility in deaths for males and females in each of 76 social groups (determined from 2011 census variables) in England and Wales. Difference between years was calculated as a standard deviation equivalent (STDEV) [24,27] relative to the average deaths between 2001 to 2014, and the average volatility calculated over the 15-year period. Converting the year-to-year differences into STDEV equivalents adjusts all social groups for size [24], enabling like-for-like comparison.
Figure 1 illustrates the principle that female deaths are generally more volatile than males, i.e. outbreaks of the agent generally affect females more than males. Volatility needs to be understood in the context that outbreaks of the presumed infectious agent lead to on/off switching in deaths, and it is the resulting high/low behaviour which generates additional year-to-year volatility. Certain social groups show higher volatility due to higher sensitivity to the presumed infectious agent.
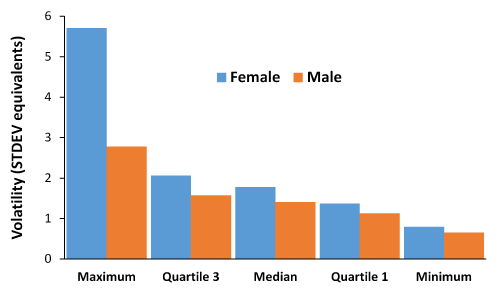
Figure 1. Average year-to-year volatility in deaths (as STDEV equivalents) for social groups in England and Wales by gender, 2001 to 2015
Highest and lowest volatility female groups were 5b2 (communal retirement) and 2c2 (migrant commuters) respectively, while highest and lowest male volatility was found in 8c1 (hard pressed ageing industrious workers) and 8b2 (hard pressed rented terraces). Social deprivation per se seems to not play a major role since both high and low volatility male groups are from socially deprived areas. However, both male and female high volatility groups are from aged communities. It is also clear that males and females within the same social group show differential volatility, and this confirms the observation that the genders respond to different social factors [24].
Higher deaths in certain years
Figure 2 illustrates the principle that deaths are higher in certain years. The social group in Figure 2 is high in persons with a black ethnic origin. As can be seen female deaths are greater during the outbreaks, and peak at almost 2-times higher than seen in males. Genetic, cultural and social network factors may be involved in this difference.
After excluding high years, a second order polynomial was used to estimate the baseline trend in Figure 2.
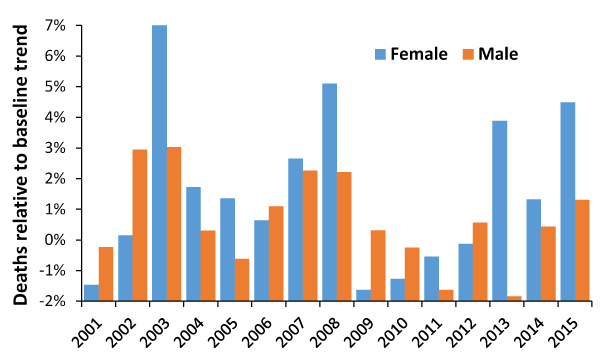
Figure 2. Deaths relative to the underlying trend for social group 8d2 (hard pressed ethnic mix, high in black ethnic origin)
While there is a general downward trend in deaths after 2001 in most social groups in England and Wales there are exceptions, and it is sometimes difficult to know if the baseline trend follows a second order polynomial on all occasions.
To remedy this issue the ratio of male to female deaths was calculated, high years excluded, and a linear fit was used to calculate the trend line. The ratio of female to male deaths (a dimensionless ratio) appears to avoid some of the uncertainty regarding the underlying trend in deaths. This analysis shows years in which there are an excess of female deaths relative to the baseline ratio. A negative value represents a period of excess male deaths.
Figures 3 to 5 illustrate the different profiles between males and females observed across three diverse social groups. Differences in both magnitude and timing can be inferred. Recall that annual data is made more difficult to interpret due to part year effects, and the possibility that onset in males and females can lag behind each other [24].
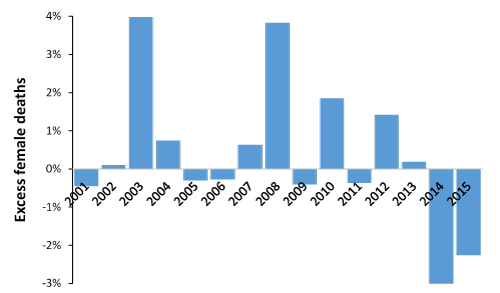
Figure 3. Excess female relative to male deaths in group 5b2 (ageing communal retirement)
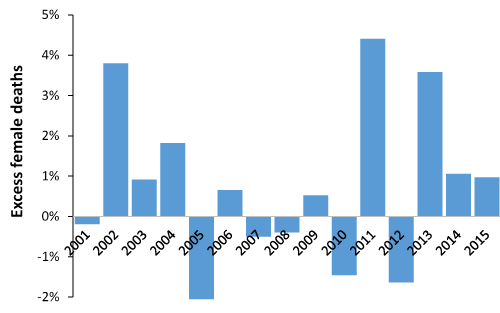
Figure 4. Excess female to male deaths in group 6b2 (white suburban semi-detached communities)
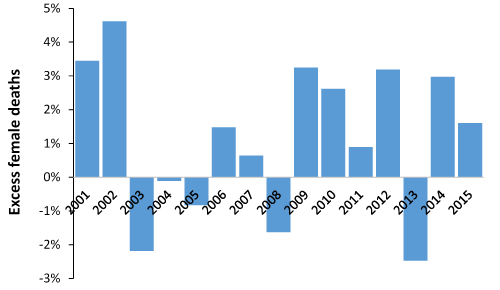
Figure 5. Excess female relative to male deaths in group 8b2 (hard pressed rented terraces)
Unusual deaths in 2015
In the UK the year 2015 saw the largest increase in deaths (+5.6%) over the previous year since the 1960s [30]. No official explanation has ever been offered.
Table 1 shows the social groups in England and Wales which experienced a statistically significant (> 3 STDEV) increase in 2015. Females occur in Table 1 on 35% more occasions than males. As a generalization, the social groups most affected are of white British ethic origin, especially elderly. Ethnicity (genetic factors?), social or cultural behaviours and female gender are clearly implicated. At the opposite end of the spectrum (data not shown) are student and several Eastern European social groups who experience a reduction rather than an increase – on both occasions younger age is the common factor.
Table 1. Social groups in England and Wales showing a statistically significant change between 2014 and 2015
Sex
|
OAC
|
Supergroup
|
Group
|
Subgroup
|
2014
|
Change
|
STDEV
|
F |
5b2 |
Urbanites |
Ageing Urban Living |
Communal Retirement |
21,477 |
7.4% |
10.8 |
M |
5b2 |
Urbanites |
Ageing Urban Living |
Communal Retirement |
11,887 |
7.8% |
8.5 |
F |
1c3 |
Rural Residents |
Ageing Rural |
Detached Rural Retirement |
5,821 |
10.0% |
7.6 |
F |
5b3 |
Urbanites |
Ageing Urban Living |
Self-Sufficient Retirement |
9,622 |
7.5% |
7.4 |
F |
6a3 |
Suburbanites |
Suburban Achievers |
Detached Retirement Living |
7,886 |
8.1% |
7.2 |
F |
1c2 |
Rural Residents |
Ageing Rural |
Renting Rural Retirement |
5,754 |
9.4% |
7.1 |
F |
1b1 |
Rural Residents |
Rural Tenants |
Rural Life |
4,666 |
10.4% |
7.1 |
F |
7a2 |
Constrained City |
Challenged Diversity |
Hampered Aspiration |
4,249 |
10.4% |
6.8 |
F |
4a1 |
Multicultural Metropolitans |
Rented Family Living |
Social Renting Young Families |
5,621 |
9.0% |
6.7 |
F |
8d1 |
Hard-Pressed Living |
Migration and Churn |
Hard-Pressed Family |
3,509 |
10.9% |
6.5 |
F |
6b3 |
Suburbanites |
Semi-Detached Suburbia |
Semi-Detached Ageing |
8,843 |
6.8% |
6.4 |
M |
5b3 |
Urbanites |
Ageing Urban Living |
Self-Sufficient Retirement |
9,227 |
6.5% |
6.3 |
M |
6a3 |
Suburbanites |
Suburban Achievers |
Detached Retirement Living |
8,467 |
6.3% |
5.8 |
F |
5a1 |
Urbanites |
Urban Professionals and Families |
White Professionals |
6,147 |
7.4% |
5.8 |
F |
6a4 |
Suburbanites |
Suburban Achievers |
Ageing in Suburbia |
6,650 |
7.0% |
5.7 |
F |
8c1 |
Hard-Pressed Living |
Hard-Pressed Ageing Workers |
Ageing Industrious Worker |
7,735 |
6.2% |
5.4 |
M |
7d3 |
Constrained City |
Ageing City |
Retired Communal City |
2,101 |
11.6% |
5.3 |
M |
6b2 |
Suburbanites |
Semi-Detached Suburbia |
White Suburban |
8,596 |
5.6% |
5.2 |
M |
8b1 |
Hard-Pressed Living |
Challenged Terraced Workers |
Deprived Blue-Collar |
3,401 |
8.5% |
5.0 |
M |
1c2 |
Rural Residents |
Ageing Rural |
Renting Rural Retirement |
3,356 |
8.6% |
5.0 |
F |
1a2 |
Rural Residents |
Farming Communities |
Established Farming |
2,323 |
10.2% |
4.9 |
F |
8c2 |
Hard-Pressed Living |
Hard-Pressed Ageing Workers |
Ageing Rural Industry |
3,009 |
8.8% |
4.8 |
M |
1b3 |
Rural Residents |
Rural Tenants |
Ageing Rural Flat Tenant |
3,473 |
8.0% |
4.7 |
F |
3b1 |
Ethnicity Central |
Endeavouring Ethnic Mix |
Striving Service Workers |
1,008 |
14.9% |
4.7 |
F |
6b2 |
Suburbanites |
Semi-Detached Suburbia |
White Suburban Communities |
7,987 |
5.3% |
4.7 |
M |
7d1 |
Constrained City |
Ageing City |
Ageing and Families |
1,852 |
10.9% |
4.7 |
M |
1c3 |
Rural Residents |
Ageing Rural |
Detached Rural Retirement |
3,491 |
7.8% |
4.6 |
M |
6a2 |
Suburbanites |
Suburban Achievers |
Comfortable Suburbia |
2,099 |
9.8% |
4.5 |
M |
8c1 |
Hard-Pressed Living |
Hard-Pressed Ageing Workers |
Ageing Industrious Workers |
6,937 |
5.3% |
4.5 |
M |
6b4 |
Suburbanites |
Semi-Detached Suburbia |
Older Workers/ Retirement |
5,969 |
5.6% |
4.4 |
F |
4a2 |
Multicultural Metropolitans |
Rented Family Living |
Private Rent New Arrivals |
2,821 |
8.2% |
4.3 |
F |
7d3 |
Constrained City |
Ageing City |
Retired Communal City |
3,715 |
7.1% |
4.3 |
F |
4a3 |
Multicultural Metropolitans |
Rented Family Living |
Commuters with Young Families |
3,132 |
7.7% |
4.3 |
F |
8a1 |
Hard-Pressed Living |
Industrious Communities |
Industrious Transitions |
7,051 |
5.1% |
4.3 |
F |
1c1 |
Rural Residents |
Ageing Rural |
Rural Employed/ Retirees |
1,175 |
12.4% |
4.3 |
M |
8a1 |
Hard-Pressed Living |
Industrious Communities |
Industrious Transitions |
6,959 |
5.0% |
4.2 |
M |
5a3 |
Urbanites |
Urban Professionals and Families |
Families in Terraces/ Flats |
5,012 |
5.7% |
4.0 |
M |
6a4 |
Suburbanites |
Suburban Achievers |
Ageing in Suburbia |
5,696 |
5.3% |
4.0 |
M |
3a1 |
Ethnicity Central |
Ethnic Family Life |
Established Renting Families |
2,155 |
8.5% |
3.9 |
M |
3b2 |
Ethnicity Central |
Endeavouring Ethnic Mix |
Bangladeshi Mixed Employment |
568 |
16.4% |
3.9 |
F |
5b1 |
Urbanites |
Ageing Urban Living |
Delayed Retirement |
5,141 |
5.3% |
3.8 |
F |
1b3 |
Rural Residents |
Rural Tenants |
Ageing Rural Flat Tenant |
3,198 |
6.7% |
3.8 |
F |
6a2 |
Suburbanites |
Suburban Achievers |
Comfortable Suburbia |
1,682 |
9.2% |
3.8 |
M |
4c1 |
Multicultural Metropolitans |
Asian Traits |
Achieving Minorities |
2,799 |
7.0% |
3.7 |
F |
1b2 |
Rural Residents |
Rural Tenants |
Rural White-Collar Worker |
4,448 |
5.6% |
3.7 |
M |
6b1 |
Suburbanites |
Semi-Detached Suburbia |
Multi-Ethnic Suburbia |
3,809 |
6.0% |
3.7 |
M |
2c3 |
Cosmopolitans |
Comfortable Cosmopolitans |
Professional Service |
181 |
26.5% |
3.6 |
M |
6b3 |
Suburbanites |
Semi-Detached Suburbia |
Semi-Detached Ageing |
9,710 |
3.5% |
3.5 |
M |
8c2 |
Hard-Pressed Living |
Hard-Pressed Ageing Workers |
Ageing Rural Industry |
2,793 |
6.5% |
3.4 |
F |
7c1 |
Constrained City |
White Communities |
Challenged Transitionaries |
1,187 |
9.8% |
3.4 |
M |
1c1 |
Rural Residents |
Ageing Rural |
Rural Employment/ Retired |
1,182 |
9.7% |
3.3 |
M |
4a3 |
Multicultural Metropolitans |
Rented Family Living |
Commuters with Young Families |
2,997 |
6.1% |
3.3 |
F |
6b1 |
Suburbanites |
Semi-Detached Suburbia |
Multi-Ethnic Suburbia |
3,617 |
5.5% |
3.3 |
F |
6a1 |
Suburbanites |
Suburban Achievers |
Indian Tech Achievers |
3,714 |
5.4% |
3.3 |
F |
2a2 |
Cosmopolitans |
Students Around Campus |
Student Digs |
244 |
20.9% |
3.3 |
F |
7d1 |
Constrained City |
Ageing City |
Ageing and Families |
2,269 |
6.8% |
3.2 |
M |
1a4 |
Rural Residents |
Farming Communities |
Older Farming Community |
1,827 |
7.6% |
3.2 |
M |
7a3 |
Constrained City |
Challenged Diversity |
Multi-Ethnic Hardship |
5,547 |
4.3% |
3.2 |
F |
8d3 |
Hard-Pressed Living |
Migration and Churn |
Hard-Pressed European |
2,220 |
6.7% |
3.2 |
F |
1a4 |
Rural Residents |
Farming Communities |
Older Farming Community |
1,572 |
7.9% |
3.1 |
F |
3d1 |
Ethnicity Central |
Aspirational Techies |
New EU Tech Workers |
810 |
11.0% |
3.1 |
F |
7a3 |
Constrained City |
Challenged Diversity |
Multi-Ethnic Hardship |
5,404 |
4.2% |
3.1 |
F |
7a1 |
Constrained City |
Challenged Diversity |
Transitional E. European |
1,719 |
7.5% |
3.1 |
International scope
The outbreaks of a presumed infectious agent are international in scope, with Australia being no exception [15,31]. Figure 6 shows the trend in total deaths in Australia between 2003 and 2015. Due to very different patterns of immigration after World War II Australia shows a general increase in total deaths, as opposed to the general decrease in the UK. However, certain years are clearly higher than the trend such as 2008 and 2014/2015.
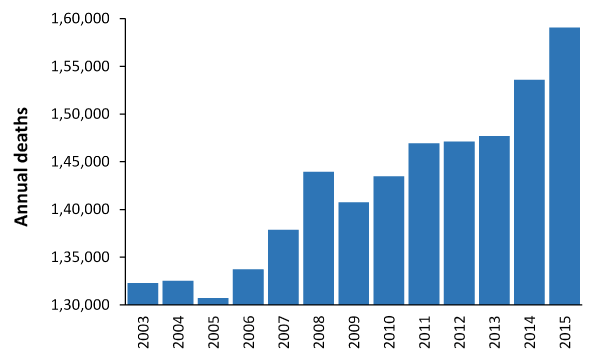
Figure 6. Annual deaths in Australia, 2003 to 2015
The suggestion is that whatever led to higher deaths in 2015 in the UK may have commenced in mid-2014 in Australia. Recall that the winter occurs in mid-year in Australia, and that the population of Australia is highly dispersed which would facilitate slower spread.
Is there any evidence that similar dispersion occurred elsewhere?
Common patterns
To investigate this possibility Figure 7 shows the difference in deaths between 2013 to 2014 and 2014 to 2015 seen at local authority level across the UK and at country level across Europe. To limit statistical scatter analysis is restricted to local authority/countries with over 2,000 deaths per annum. As can be seen the change in 2015 (over 2014) is greatly influenced by the magnitude of the change seen in 2014 (over 2013), i.e. areas experiencing a large increase in deaths in 2014 generally did not show the large increase in deaths in 2015, and vice versa. The effect was clearly not limited to the UK, although UK government agencies have not made this clear and all concerned have been left to speculate.
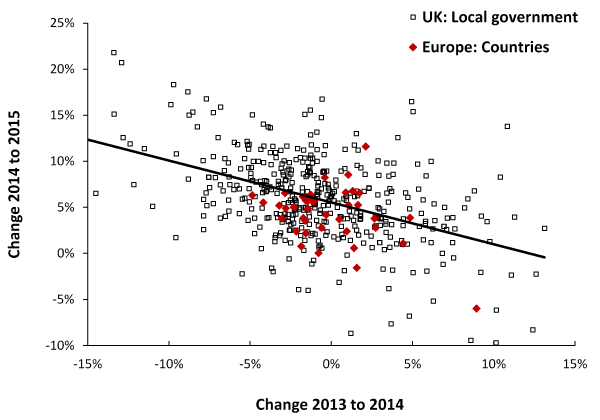
Figure 7. Annual deaths in European countries and UK local government areas (>2,000 deaths per annum), change between 2014 to 2015 versus change 2013 to 2014
This pattern is further investigated in Figure 8 for social groups in London with more than 2,000 deaths per annum. Figure 8 also contains a male/female split where it can be seen that a higher proportion of females within social groups had a reduction in deaths in 2014 (over 2013), while the opposite is true for males. Hence females tended to experience a higher increase in deaths in 2015.
A similar situation is observed when using smaller output area data (OA) for England and Wales (excluding London) – data not shown. When converted to STDEV equivalents this smaller OA data shows the following linear relationship 2015 (as STDEV) = 0.33 – 0.42 x 2014 (as STDEV). Hence any small area experiencing no change between 2013 and 2014 will on average experience a 0.33 STDEV equivalent increase in 2015. A small area experiencing a -5 STDEV reduction in 2014 would on average show a +2.2 STDEV increase in 2015. Females show a similar preference for a reduction in 2014 as in Figure 8.
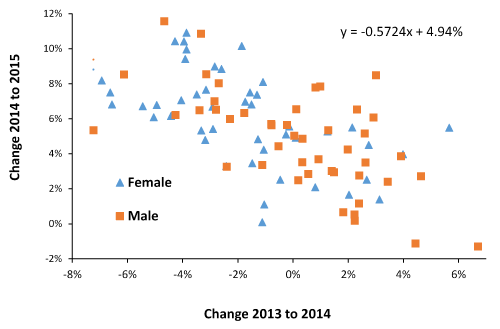
Figure 8. Annual male or female deaths in social groups within England and Wales (>2,000 deaths per annum), change between 2014 to 2015 versus change 2013 to 2014
Understanding annual patterns
Due to the data availability at output area (OA) level in England and Wales this study has been restricted to calendar year totals. Several of the above sections contain comments regarding interpreting such annual totals in the context of smaller area movement of the suspected pathogen.
Figure 9 illustrates these issues with running (moving) 12-month total deaths for two local authorities in Berkshire, namely Slough and West Berkshire. West Berkshire is a predominantly affluent white British community with the majority of the population living in Newbury and nearby Thatcham. Slough has a very large Pakistani community, and due to its close proximity to Heathrow and London attracts new immigrants and asylum seekers. There is a thriving black market in the provision of sub-standard accommodation (with poor sanitation) including converted garden sheds. The Slough council has claimed for many years that the true population of Slough (as measured by the weight of refuse as a proxy for human habitation) is far higher than the census figures represent.
A previous study of the 2012 outbreak in Berkshire, using mid super output area (MSOA) data for medical admissions, demonstrated that Slough and West Berkshire respond to the outbreaks in different ways [8,11]. As can be seen in Figure 9 the pattern over time in West Berkshire shows clearer saw-tooth behaviour which is indicative of on/off switching, while that in Slough is more complex due to the greater diversity of social networks and far higher proportion of other ethnic groups.
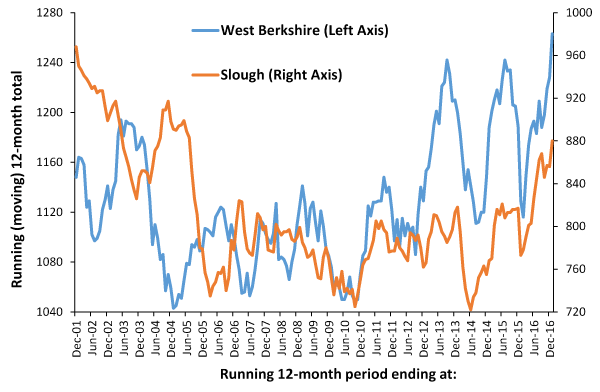
Figure 9. Running (moving) 12-month total deaths in Slough and West Berkshire
The 2002 outbreak shows anti-phase behaviour in Slough and does not commence until 2003. Between 2006 and 2009 Slough demonstrates indeterminate behaviour, which is assumed to arise when male/female outbreaks go out-of-phase. It is only from 2010 onward that the series of outbreaks in 2010, 2012, 2014 and 2016 can be seen in high synchrony in both locations. The ongoing 2016 outbreak in the UK, mixed with a cocktail of bad policy, led to chaos in the NHS during the winter of 2016/17.
The interaction with influenza in 2015 shows as a ‘table top’ shaped feature added on top of the saw-tooth pattern arising from the 2014 outbreak, however, the strength of this interaction differs between the two locations.
Calendar year totals are the total every December in the running (moving) 12-month total chart. Hence year-on-year comparisons can be blurred depending on when each event initiates and the annual total can contain a mix of partial year effects.
It is these partial year effects which generate the scatter in Figures 7 and 8, and can lead to the volatility observed in the other charts. The effects at national level therefore depend on the sum total of all small areas and the degree of synchrony. For example, a high proportion of anti-phase behaviour can ‘hide’ an outbreak which was largely the case for the 2010 outbreak when observed at national level [7,14].
Wider links with illness
It has been previously observed that the effects of these events on the gender ratio at birth, Emergency Department attendance and medical admissions occur slightly earlier than the effect upon deaths [19]. Effects against NHS staff sickness absence have also been observed [29]. Figure 10 explores the issue regarding the timing of the effect against NHS staff sickness absence relative to deaths (all-cause mortality) in England. As can be seen in Figure 10, sickness absence tends to initiate slightly before the increase in deaths, and that the relative effects against sickness absence and deaths are different during each event.
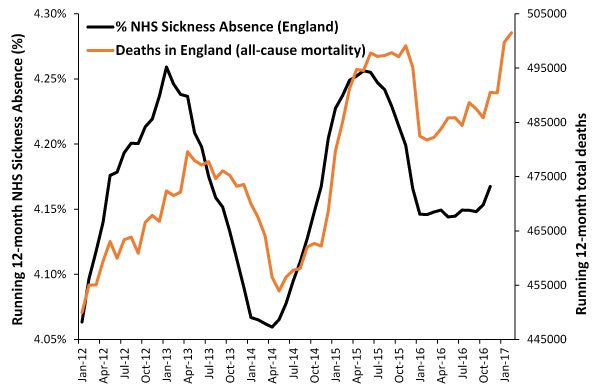
Figure 10. Running (moving) 12-month average NHS staff sickness absence rate and deaths (all-cause mortality) in England
The previous study in this series [24], established the principles that these outbreaks occur continuously over time in very small areas, with around 1% of small areas having a mini-outbreak at any point in time. Males and females behave as separate compartments with magnitude seemingly influenced by different population characteristics, i.e. deaths in women were more sensitive to the presence of children, etc. Male or female outbreaks can occur simultaneously but more commonly lag-behind each other. Chance appears to play a major role in all these behaviours.
This study has used annual totals to illustrate broad principles, however, these outbreaks do not occur in neat calendar year temporal patterns. Hence as in Figure 6 (deaths in Australia) the trends area mix of part-year and full-year effects which depend on timing and magnitude, and upon wider spread across the whole of Australia. Figure 9 illustrated this effect using monthly data from two socially diverse local authority areas in Berkshire (England), while Figure 10 used monthly deaths and NHS staff sickness absence to demonstrate that for the whole of England (a composite of all small areas) the increase in sickness absence commenced before the increased in deaths.
However, the behaviour of countries, local authority areas, social groupings and very small areas all display similar patterns suggesting a common source for the behaviour. As suggested in previous studies [1-30], and confirmed in Figure 10, these events are highly likely to be of an infectious origin. There is a cascade of morbidity and mortality with the effects upon pregnancy seeming to occur first. This is followed by increased ED attendance, medical admissions, and staff sickness absence, with deaths rising last in this cascade of poor health.
Figures 1 and 2 have re-emphasized the central role of gender differences in these outbreaks. All studies conducted in the future need to split the data by gender.
Figures 2 to 5 show that different social groups and/or population dispersion patterns can show male or female peaks in different years. However, superimposed on this are larger (inter)national events which occur roughly around 2003, 2008 and more recently 2012, 2014, 2016 in the UK. The data for Australia (Figure 6) is a composite for a dispersed population, however, the detail becomes clearer using monthly data in 12-month running totals at State and local government geographies [15,30,31].
Figures 7 and 8 demonstrated that the outbreaks occur at all geographic levels from very small spatial units (output areas) through to local government and national geographies.
Another study has suggested that an interaction between the presumed infectious agent and influenza led to the jump in deaths in January 2015, which then had ongoing effects upon mortality for an extended period [28]. A further study demonstrates that the magnitude of the increase in 2015 in both the UK and Europe is strongly influenced by the difference in deaths between December 2014 and January 2015 [32], which seemingly arose from an influenza outbreak following vaccination of the population with a poorly matched antigen vaccine [28,32].
These infectious events appear to occur as on/off switching. The switch-on leads to higher deaths for a 12-month period, followed by switch-off until the next event is initiated. At very small area level the switch-on occurs at very approximate two year intervals [24]. It has been suggested that this on/off switching has an immune system basis [27,33,34].
This presumably partly explains why the timing of events has such a profound effect on the magnitude of the 2015 increase. Those countries/locations which experienced switch-on for most of 2014 therefore went into switch-off in 2015, and apparently, this prevented any interaction with influenza and/or vaccination with the incorrect antigen mix.
In the UK, it has been proposed that the increase in deaths in 2015 was due to reduced funding of social care [35-37]. This proposal is contradicted by the small-area and international behaviour demonstrated in this study and elsewhere [32].
The potential involvement of the immune modifying virus, cytomegalovirus, has been discussed elsewhere, both in terms of adult deaths, medical admissions, and stillbirths in the foetus [1,2,4,6,9,19,22,23,27].
Current models for expected number of deaths need to be modified to include the effects of the outbreaks of this presumed pathogen. Sophisticated spatial and fractal analysis is required to investigate how transmission occurs in different social groups. The male/female difference is clearly of fundamental importance, as is the degree of in-phase and anti-phase behaviour.
Given the seeming ability of this pathogen to increase stillbirths and certain congenital conditions [27], urgent international research is required to confirm the pathogen and develop a workable vaccine. Government agencies in the UK remain in (public) denial regarding the presence of this pathogen [38].
Another outbreak of influenza A (H3N2) has occurred in December 2016 to February 2017 similar to that which was seemingly involved in the 2015 increase in deaths [33]. It remains to be seen if the events in 2015 will be repeated in 2017.
- Jones R (2013) Could cytomegalovirus be causing widespread outbreaks of chronic poor health. In: Hypotheses in Clinical Medicine, M. Shoja, et al. (Eds.), 37-79. New York: Nova Science Publishers Inc. Available from: http://www.hcaf.biz/2013/CMV_Read.pdf
- Jones R (2013) Recurring outbreaks of a subtle condition leading to hospitalization and death. Epidemiology: Open access 4: 137.
- Jones R (2014) Infectious-like spread of an agent leading to increased medical admissions and deaths in Wigan (England), during 2011 and 2012. Brit J Med Medical Res 4: 4723-41.
- Jones R (2014) A Study of an Unexplained and Large Increase in Respiratory Deaths in England and Wales: Is the Pattern of Diagnoses Consistent with the Potential Involvement of Cytomegalovirus? Brit J Med Medical Res 4: 5179-92.
- Jones R (2015) Infectious-like spread of an agent leading to increased medical hospital admission in the North-East Essex area of the East of England. Fractal Geometry and Nonlinear Analysis in Medicine and Biology 1: 98-111.
- Jones R (2015) An unexpected increase in adult appendicitis in England (2000/01 to 2012/13): Could cytomegalovirus (CMV) be a risk factor? Brit J Med Medical Res 5: 579-603.
- Jones R (2015) A Previously uncharacterized infectious-like event leading to spatial spread of deaths across England and Wales: Characteristics of the most Recent Event and a Time Series for Past Events. Brit J Med Medical Res 5: 1361-80.
- Jones R, Beauchant S (2015) Small Area Spread of a New Type of Infectious Condition across Berkshire in England between June 2011 and March 2013: Effect on Medical Emergency Admissions. Brit J Med Medical Res 6: 126-48.
- Jones R (2015) Roles for cytomegalovirus in infection, inflammation and autoimmunity. In: Infection and Autoimmunity, (2ndedn), Chapter 18, pp 319-357. Rose N, et al. (eds.) Amsterdam, Elsevier.
- Jones R (2015) Recurring Outbreaks of an Infection Apparently Targeting Immune Function, and Consequent Unprecedented Growth in Medical Admission and Costs in the United Kingdom: A Review. Brit J Med Medical Res 6: 735-70.
- Jones R (2015) Unexpected and disruptive changes in admissions associated with an infectious-like event experienced at a hospital in Berkshire, England around May of 2012. Brit J Med Medical Res 6: 56-76.
- Jones R (2015) Are emergency admissions contagious? Brit J Healthc Manage 21: 227-235.
- Jones R (2015) Simulated rectangular wave infectious-like events replicate the diversity of time-profiles observed in real-world running 12-month totals of admissions or deaths. Fractal Geometry and Nonlinear Analysis in Medicine and Biology 1: 78-79.
- Jones R (2015) Small area spread and step-like changes in emergency medical admissions in response to an apparently new type of infectious event. Fractal Geometry and Nonlinear Analysis in Medicine and Biology 1: 42-54.
- Jones R (2015) Deaths and international health care expenditure. Brit J Healthc Manage 21: 491-493.
- Beeknoo N, Jones R (2016) The demography myth - how demographic forecasting underestimates hospital admissions, and creates the illusion that fewer hospital beds or community-based bed equivalents will be required in the future. Brit J Med Medical 19: 1-27.
- Jones R (2016) A presumed infectious event in England and Wales during 2014 and 2015 leading to higher deaths in those with neurological and other disorders. Journal of Neuroinfectious Diseases 7: 1000213.
- Jones R (2014) Unexpected single-year-of-age changes in the elderly mortality rate in 2012 in England and Wales. Brit J Med Medical Res 4: 3196-207.
- Jones R (2016) Is cytomegalovirus involved in recurring periods of higher than expected death and medical admissions, occurring as clustered outbreaks in the northern and southern hemispheres? Brit J Med Medical Res 11: 1-31.
- Jones R (2016) Deaths in English Lower Super Output Areas (LSOA) show patterns of very large shifts indicative of a novel recurring infectious event. SMU Medical Journal 3: 23-36.
- Jones R (2016) A fatal flaw in mortality-based disease surveillance. Brit J Healthc Manage 22: 143-145.
- Jones R (2016) The unprecedented growth in medical admissions in the UK: the ageing population or a possible infectious/immune aetiology? Epidemiology: Open Access 6: 1000219.
- Jones R (2016) Rising emergency admissions in the UK and the elephant in the room. Epidemiology (Sunnyvale): Open Access 6: 1000261.
- Jones R (2016) A regular series of unexpected and large increases in total deaths (all-cause mortality) for male and female residents of mid super output areas (MSOA) in England and Wales: How high level analysis can miss the contribution from complex small-area spatial spread of a presumed infectious agent. Fractal Geometry and Nonlinear Analysis in Medicine and Biology 2: 1-13.
- Beeknoo N, Jones R (2017) Information asymmetry in financial forecasting within healthcare and simple methods to overcome this deficiency. British Journal of Medicine and Medical Research 20: 1-12.
- Jones R (2017) Anticipated ambulance workload during the 2016/17 winter. Journal of Paramedic Practice 9: 52-54.
- Jones R (2017) Outbreaks of a Presumed Infectious Agent Associated with Changes in Fertility, Stillbirth, Congenital Abnormalities and the Gender Ratio at Birth. British Journal of Medicine and Medical Research 20: 1-36.
- Jones R (2017) Year-to-year variation in deaths in English Output Areas (OA), and the interaction between a presumed infectious agent and influenza in 2015. SMU Medical Journal 4: 37-69.
- Jones R (2016) Unusual trends in NHS staff sickness absence. Brit J Healthc Manage 22: 239-240.
- Office for National Statistics (2016) Deaths in England and Wales in 2015. https://www.ons.gov.uk/releases/deathsinenglandandwalesin2015
- Jones R (2015) A time series of infectious-like events in Australia between 2000 and 2013 leading to extended periods of increased deaths (all-cause mortality) with possible links to increased hospital medical admissions. International Journal of Epidemiologic Research 2: 53-67.
- Jones R (2017) Did austerity cause the rise in deaths in 2015. Brit J Healthc Manage 23: 418-424.
- Vestergaard L, Nielsen J, Krause T, Espenhain L, Tersago K, et al. (2017) Excess all-cause and influenza-attributable mortality in Europe, December 2016 to February 2017. Euro Surveill 22: pii 30506.
- Jones R (2017) Immune switching and the gender ratio at birth. Int J Fertil Steril 10: in press.
- Green M, Dorling D, Minton J (2017) The Geography of a rapid rise in elderly mortality in England and Wales, 2014-15. Health Place 44: 77-85. [Crossref]
- Hiam L, Dorling D, Harrison D, McKee M (2017) Why has mortality in England and Wales been increasing? An iterative demographic analysis. J R Soc Med 110: 153-162. [Crossref]
- Hiam L, Dorling D, Harrison D, McKee M (2017) What caused the spike in mortality in England and Wales in January 2015? J R Soc Med 110: 131-137. [Crossref]
- Beeknoo N, Jones R (2017) Information asymmetry in financial forecasting within healthcare and simple methods to overcome this deficiency. Brit J Med Medical Res 20: 1-12.


