The pedunculopontine tegmental nucleus (PPT) contains distinct populations of cholinergic, glutamatergic, and GABAergic neurons and plays an important role in the control of cortical activity and sleep-wake states, i.e. wakefulness (W), slow-wave sleep (SWS), and paradoxical (or rapid eye movement) sleep (PS). To understand the precise roles of PPT neurons, a prerequisite is to determine the electrophysiological properties and discharge profiles of a large number of PPT neurons during the complete sleep-wake cycle and at state transitions. In the present study, a total of 335 PPT neurons were recorded during the complete sleep-wake cycle using a high-impedance glass pipette microelectrode in non-anesthetized, head-fixed mice. Here, I report, for the first time, that the mouse PPT contains presumed cholinergic W/PS-selective and PS-on neurons and that they may play an important role in the induction, maintenance, and cessation of PS, and its major tonic and phasic phenomena, such as brain activation, rhythmic theta waves, and phasic electrical potentials in the cortical EEG.
pedunculopontine tegmental nucleus, cholinergic neurons, functional heterogeneity, paradoxical sleep-on neurons, theta frequency oscillation
Abbreviations
AW, active wakefulness; ChAT, choline acetyltransferase; D, drowsy state; DAB, 3,3’-diaminobenzidine ; DMT, dorsomedial tegmental area; EEG, electroencephalogram; EMG, electromyogram; GABA, gamma-aminobutyric acid; HR, heart rate; IMF, instantaneous mean frequency; LCα, locus coeruleus pars alpha; LDT, laterodorsal tegmental nucleus; Nb, neurobiotin; PAG, periaqueductal gray; peri-LCα, peri-locus coeruleus alpha; PGO, ponto-geniculo-occipital; PnO, oral pontine reticular nucleus; PPT, pedunculopontine tegmental nucleus; PPTc, pedunculopontine tegmental nucleus, pars compacta; PPTd, pedunculopontine tegmental nucleus, pars dissipata; PS, paradoxical sleep; PSt, transition period from slow-wave sleep to PS; QW, quiet wakefulness; REM, rapid eye movement; S1 and S2, light and deep slow-wave sleep, respectively; scp, superior cerebellar peduncle; SD, standard deviation; SLD, sublaterodorsal nucleus; SubCA, subcoeruleus pars alpha; SubLDT, sublaterodorsal tegmental nucleus; SWS, slow-wave sleep; W, wakefulness.
Early pharmacological, brain lesioning, and electrophysiological studies in the cat have demonstrated that the dorsolateral mesopontine tegmentum contains several key structures responsible for the initiation and maintenance of wakefulness (W) and/or paradoxical sleep (PS), also known as rapid eye movement (REM) sleep [1-9]. In terms of the control of sleep-wake states, recent studies in rodents have also attached importance to the dorsolateral mesopontine tegmentum, in particular the laterodorsal (LDT), sublaterodorsal (SubLDT), and pedunculopontine tegmental (PPT) nuclei [10-17], which all contain distinct populations of cholinergic, glutamatergic, and GABAergic neurons [18,19]. I recently demonstrated [14], in mice, the presence of sleep-specific neurons displaying sustained tonic discharge either just prior to, and during, PS (PS-on neurons) or during both slow-wave (or non-REM) sleep (SWS) and PS (SWS/PS-on neurons). PS-on and SWS/PS-on neurons are not found in the LDT, but are found in the SubLDT located beneath the LDT. I have proposed that the mouse SubLDT is homologous to the cat peri-locus coeruleus alpha (peri-LCα) playing a pivotal role in PS generation [14] and that mouse PS-on neurons play an important role in the mechanisms underlying the induction, maintenance, and cessation of PS, as well as its major tonic and phasic signs, such as muscle atonia, rhythmic theta waves, and cardiac activity, while SWS/PS-on neurons may play an important role in both the induction of SWS and maintenance of both SWS and PS [14]. Mouse PS-on neurons are all characterized by a biphasic action potential, none displaying the triphasic broad action potential that is a characteristic of cholinergic neurons [13,14]. These findings are not consistent with those of our previous studies in the cat reporting the presence of possibly cholinergic and non-cholinergic PS-on neurons in the dorsal pontine tegmentum [20-22]. One of the main purposes of the present study was to examine whether or not the mouse PPT contains cholinergic PS-on neurons with a triphasic broad action potential and discharging tonically and selectively just prior to, and during, PS.
The precise roles of cholinergic, glutamatergic, and GABAergic PPT neurons in regulating cortical activity and behavioral states still remain to be determined. Recently, Van Dort et al. [16] showed, in transgenic mice, that optogenetic stimulation of cholinergic PPT neurons during SWS increases the number of PS episodes, implying the involvement of cholinergic mechanisms in induction of PS. However, a more recent study using a chemogenetic approach in three Cre-driver mouse lines reported that selective activation of cholinergic PPT neurons does not increase PS, but, instead, promotes light SWS, while selective activation of glutamatergic or GABAergic neurons results in, respectively, induction of W or a slight reduction in PS [17]. To understand the precise roles of mouse PPT neurons in the control of cortical activity and behavioral states, a prerequisite is to determine the electrophysiological properties and discharge profiles of a large number of PPT neurons during the complete sleep-wake cycle and at state transitions. Here, I report, for the first time, that the mouse PPT contains presumed cholinergic PS-on and W/PS-selective neurons and that they may play an important role in the induction, maintenance, and cessation of PS, and its major tonic and phasic phenomena, such as brain activation, rhythmic theta waves, and phasic electrical potentials in the cortical EEG.
Animals and surgery
All procedures were approved by the University of Lyon 1 Animal Care Committee, the standards of which meet those of Council Directive 2010/63EU of the European Parliament and the Council of 22 September 2010 on the protection of animals used for scientific purposes. All efforts were made to minimize the number of animals used and their suffering.
Twenty-seven male adult C57BL/6 mice weighing 27-35 g at the time of surgery were used. Under ketamine/xylazine anesthesia, all mice were implanted with electrodes to record the cortical EEG, neck electromyogram (EMG), and electrocardiogram as described previously [14]. As a stereotaxic reference during the experiment, a 30 gauge stainless steal tube was fixed on the skull. In addition, a U-shaped plastic plate was fixed to the skull so that the cranium could be painlessly returned to the same stereotaxic position, as described previously [23].
Extracellular single-unit and polygraphic recordings
After recovery, the animals were progressively habituated to the head-fixed position for 7-14 days. Single neuronal activity was then recorded using a glass pipette microelectrode (GC150F-15, Harvard Apparatus, Kent, UK; ≈1 µm tip diameter) filled with 0.5 M sodium acetate solution containing 2% Direct Blue 15 (Sigma, St Louis, USA). Neuronal activity was recorded after amplification and filtering (0.1-50.0 kHz) using a NeuroLog system (Digitimer, Hertfordshire, UK). Neuronal activity and the polygraphic signals were digitized at a sampling rate of, respectively, 20.8 kHz and 508.1 Hz using a CED 1410 data processor (Cambridge Electronic Design [CED], Cambridge, UK) and stored on a personal computer.
Unit recordings were made either unilaterally or bilaterally at intervals of 0.2 mm rostrocaudally and mediolaterally. In order to mark the recording site, Direct Blue 15 was injected from the recording electrode at the end of each experiment. During the experiment, behavior was monitored using a video camera placed in front of the mouse, as described previously [14].
Juxtacellular labeling with Neurobiotin
Studies combining electrophysiology and Neurobiotin (Nb) injection were performed on 4 of the 27 mice under ketamine/xylazine anesthesia on the last day of the experiment. The level of anesthesia was assessed by the absence of neck EMG activity and the synchronous appearance of large amplitude (> 150 µV) spiky waves on the cortical EEG, as described previously [13].
Septum Theta glass two-barrel capillaries (TGC200-15, Harvard Apparatus, UK; 1-1.5 µm tip diameter) were used. One barrel was filled with 0.5 M NaCl containing 3.0% Nb (Vector Laboratories, Burlingame, CA) and used for single unit recording and Nb injection, while the other was filled with 0.5 M sodium acetate solution containing 2% Direct Blue 15 and used for dye marking, as described previously [13]. Under continuous electrophysiological monitoring, Nb was delivered through the recording electrode with a 50% duty cycle of 200 ms anodal current pulses of increasing intensity (<15 nA) [24,25]. After Nb injection, the electrode was placed either 0.2-0.3 mm above, or lateral to, the unit recording site for dye labeling for subsequent identification of the Nb-labeled neuron or 0.2-0.3 mm lateral to the previous electrode track for second-unit recording and Nb labeling. Within 6 h after the end of Nb labeling, the mice were killed by an overdose of pentobarbital and were processed for histochemistry as described below.
Histochemistry and determination of unit recording sites
Under deep pentobarbital anesthesia, all animals were perfused transcardially with Ringer’s solution, followed by fixative consisting of 4% paraformaldehyde, 0.05% glutaraldehyde, and 0.2% picric acid in 0.1 M phosphate buffer, pH 7.4. The brain was removed, postfixed for 24 h at 4°C in the same fixative without glutaraldehyde, and placed in 0.1 M phosphate buffer, pH 7.4, containing 30% sucrose for 48 h at 4°C. Twenty micrometer coronal sections were then cut serially on a cryostat. All brain sections from the four mice used for Nb labeling were first incubated overnight at 4°C with ABC diluted 1/1000, then, after rinses, were processed for visualization using 3,3’-diaminobenzidine (DAB) as chromogen, before being processed for choline acetyltransferase (ChAT) immunostaining using DAB-nickel as chromogen, as described previously [13]. For this two-color dual-immunostaining procedure, the reaction times were adjusted to avoid any strong immunostaining, so that one color did not entirely mask the other. In the remaining 23 mice, every third section was processed for ChAT, serotonin, or tyrosine hydroxylase immunohistochemistry, as described in detail in a previous paper [13]. The location of each unit recording site was determined based on the dye marking sites and the stereotaxically-determined recording points noted during the experiment, as previously described [14].
Data analysis
Sleep-wake stages: Based on the cortical EEG and neck EMG recordings, sleep-wake stages were defined and scored using 3-s bins. Mean discharge rates were calculated from all of the recordings for each unit using 2- to 10-s bins for each of the following 7 states: (1) active or attentive W (AW; 2– to 10-s bins); (2) quiet W (QW; 2- to 10-s bins); (3) drowsy state (D), the first 3-s period during the transition from W to SWS; (4) light SWS or S1 (10-s bins); (5) deep SWS or S2 (10-s bins); (6) PSt, the transition period from SWS to PS (10-s bins); and (7) PS (10-s bins), as described in detail in a previous paper [14].
State transitions: Sleep-wake state transitions were determined as described previously [26]. For the SWS/W transitions, onset of W was determined by the first sign of EEG desynchronization, while onset of sleep was defined by the first appearance of a synchronized, slow EEG. During the transitions from SWS to PS and from PS to W, the onset and end of PS were defined, respectively, by the appearance of continuous rhythmic theta waves and by the interruption of sustained theta waves on the EEG.
Spike shape and duration: Spike shape and duration were determined for each unit from averaged action potentials using a low frequency cutoff at 100 Hz. The duration was measured from onset to the positive peak (D1), first zero crossing (D2), negative peak (D3), and second zero crossing (D4).
Statistical analysis: Non-parametric tests were used to evaluate the significance of differences between numerical values using StatEL statistical software (ad Science, SARL, Paris, France), as the discharge rates of the neurons were not always normally distributed. Friedman’s Repeated Measures Rank test was used to calculate the overall statistical significance of differences in discharge rate across the seven different behavioral states as described above; this was followed by the non-parametric Wilcoxon signed rank test or Mann-Whitney U test to test for statistically significant differences in discharge rates between two behavioral states. For the analysis of trends in spike activity at state transitions, the Mann-Whitney U test was used. A P value of < 0.05 or < 0.01 was considered, respectively, as significant or highly significant [Figures 1 and 2].
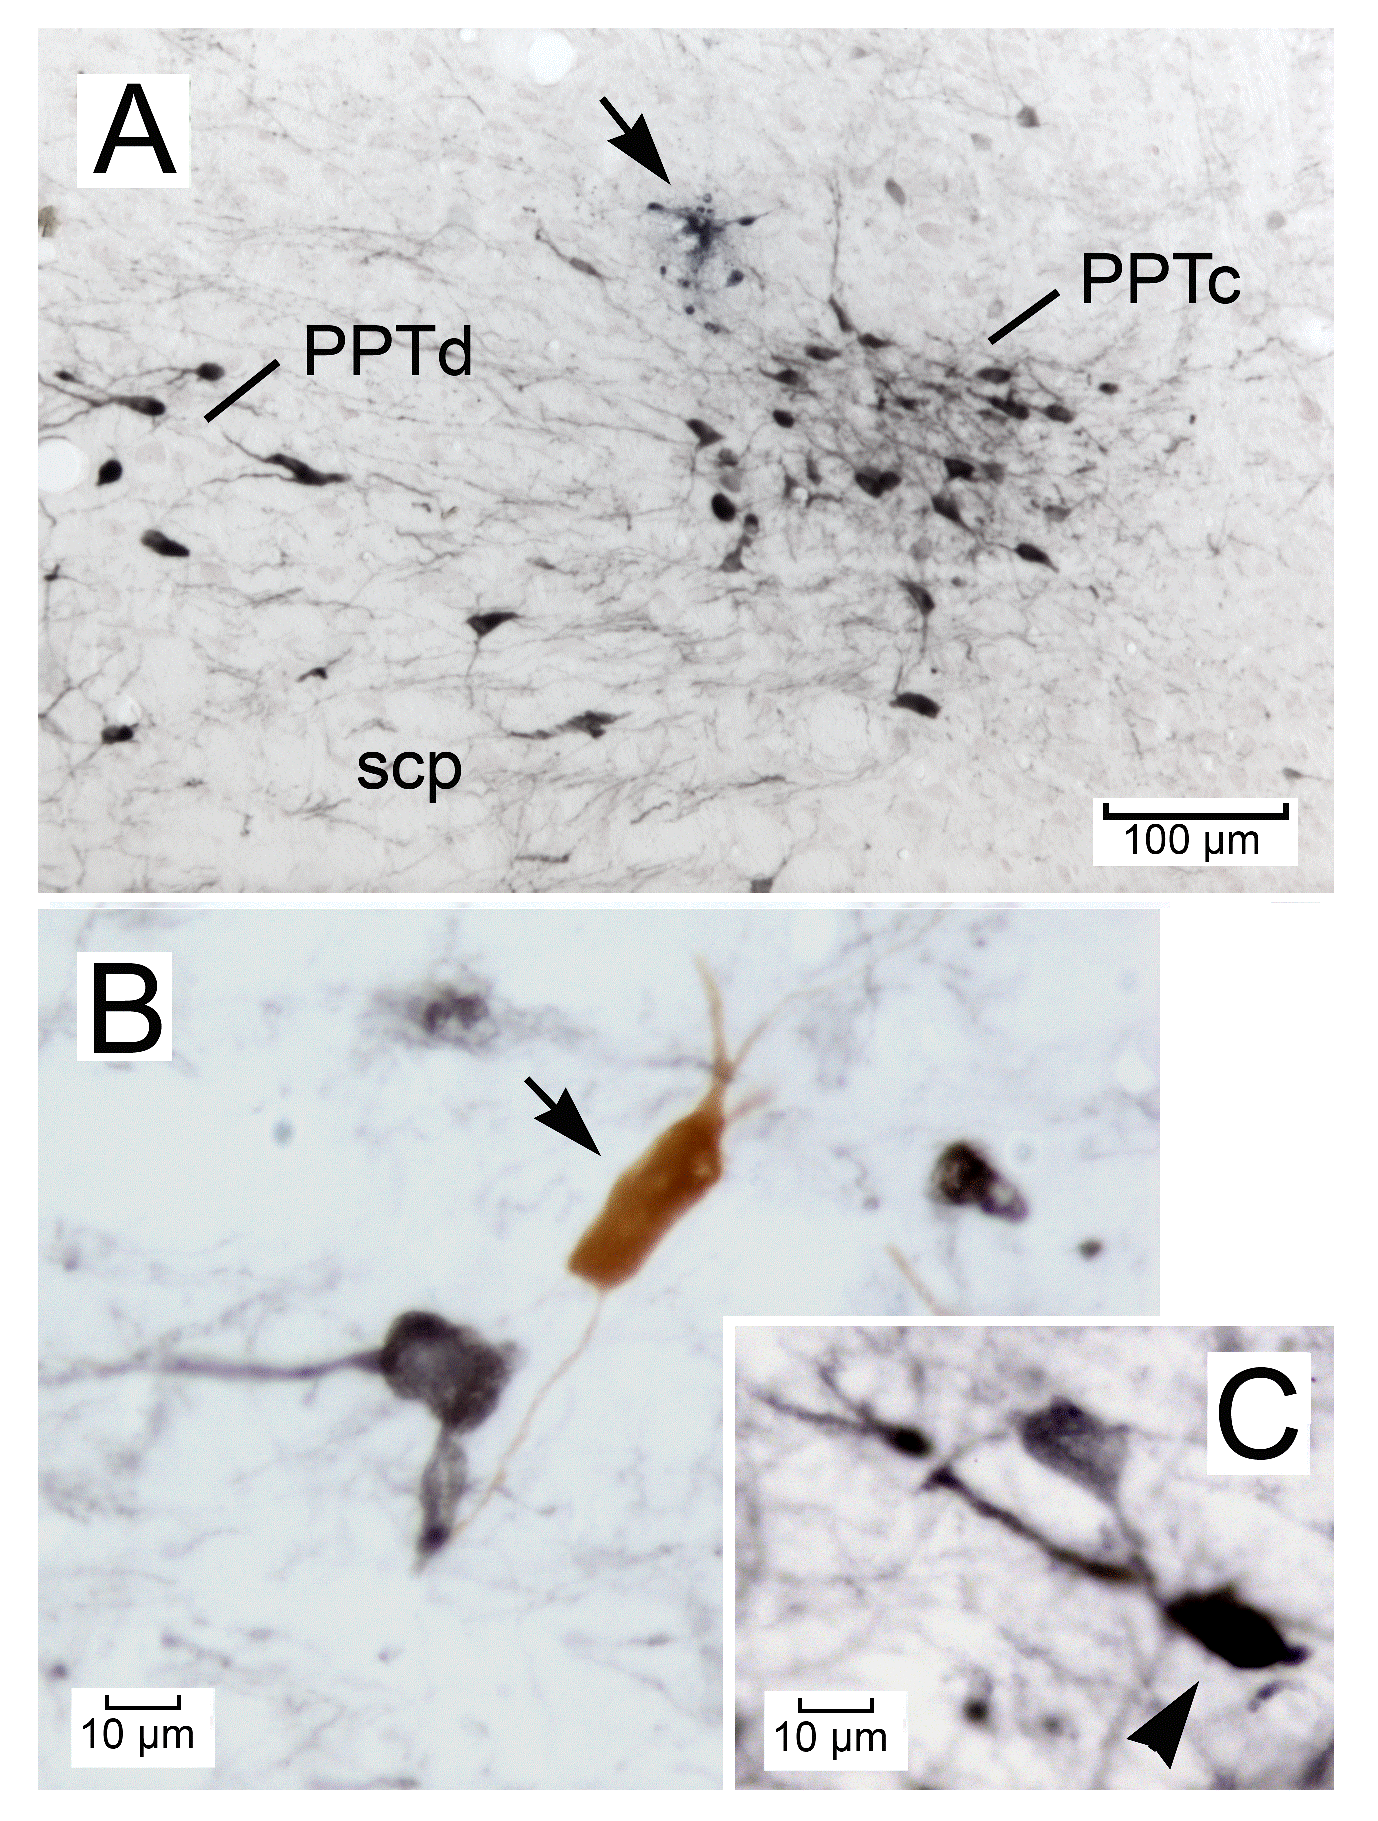
Figure 1. Photomicrographs showing frontal sections of the mouse pedunculopontine tegmental nucleus (PPT) containing choline acetyltransferase (ChAT)-immunoreactive (ir) cholinergic neurons (black). (A) A unit recording site marked with Direct Blue 15 (arrow). Note that the PPT is divided into the pars compacta (PPTc) and pars dissipata (PPTd). The section was processed for ChAT immunohistochemistry (black) and counterstained with Neutral red (red). (B) A ChAT-ir cholinergic neuron (black) and a biphasic PPT neuron labeled only with Nb (brown, arrow). (C) A triphasic PPT neuron stained with both Nb and ChAT (arrowhead).
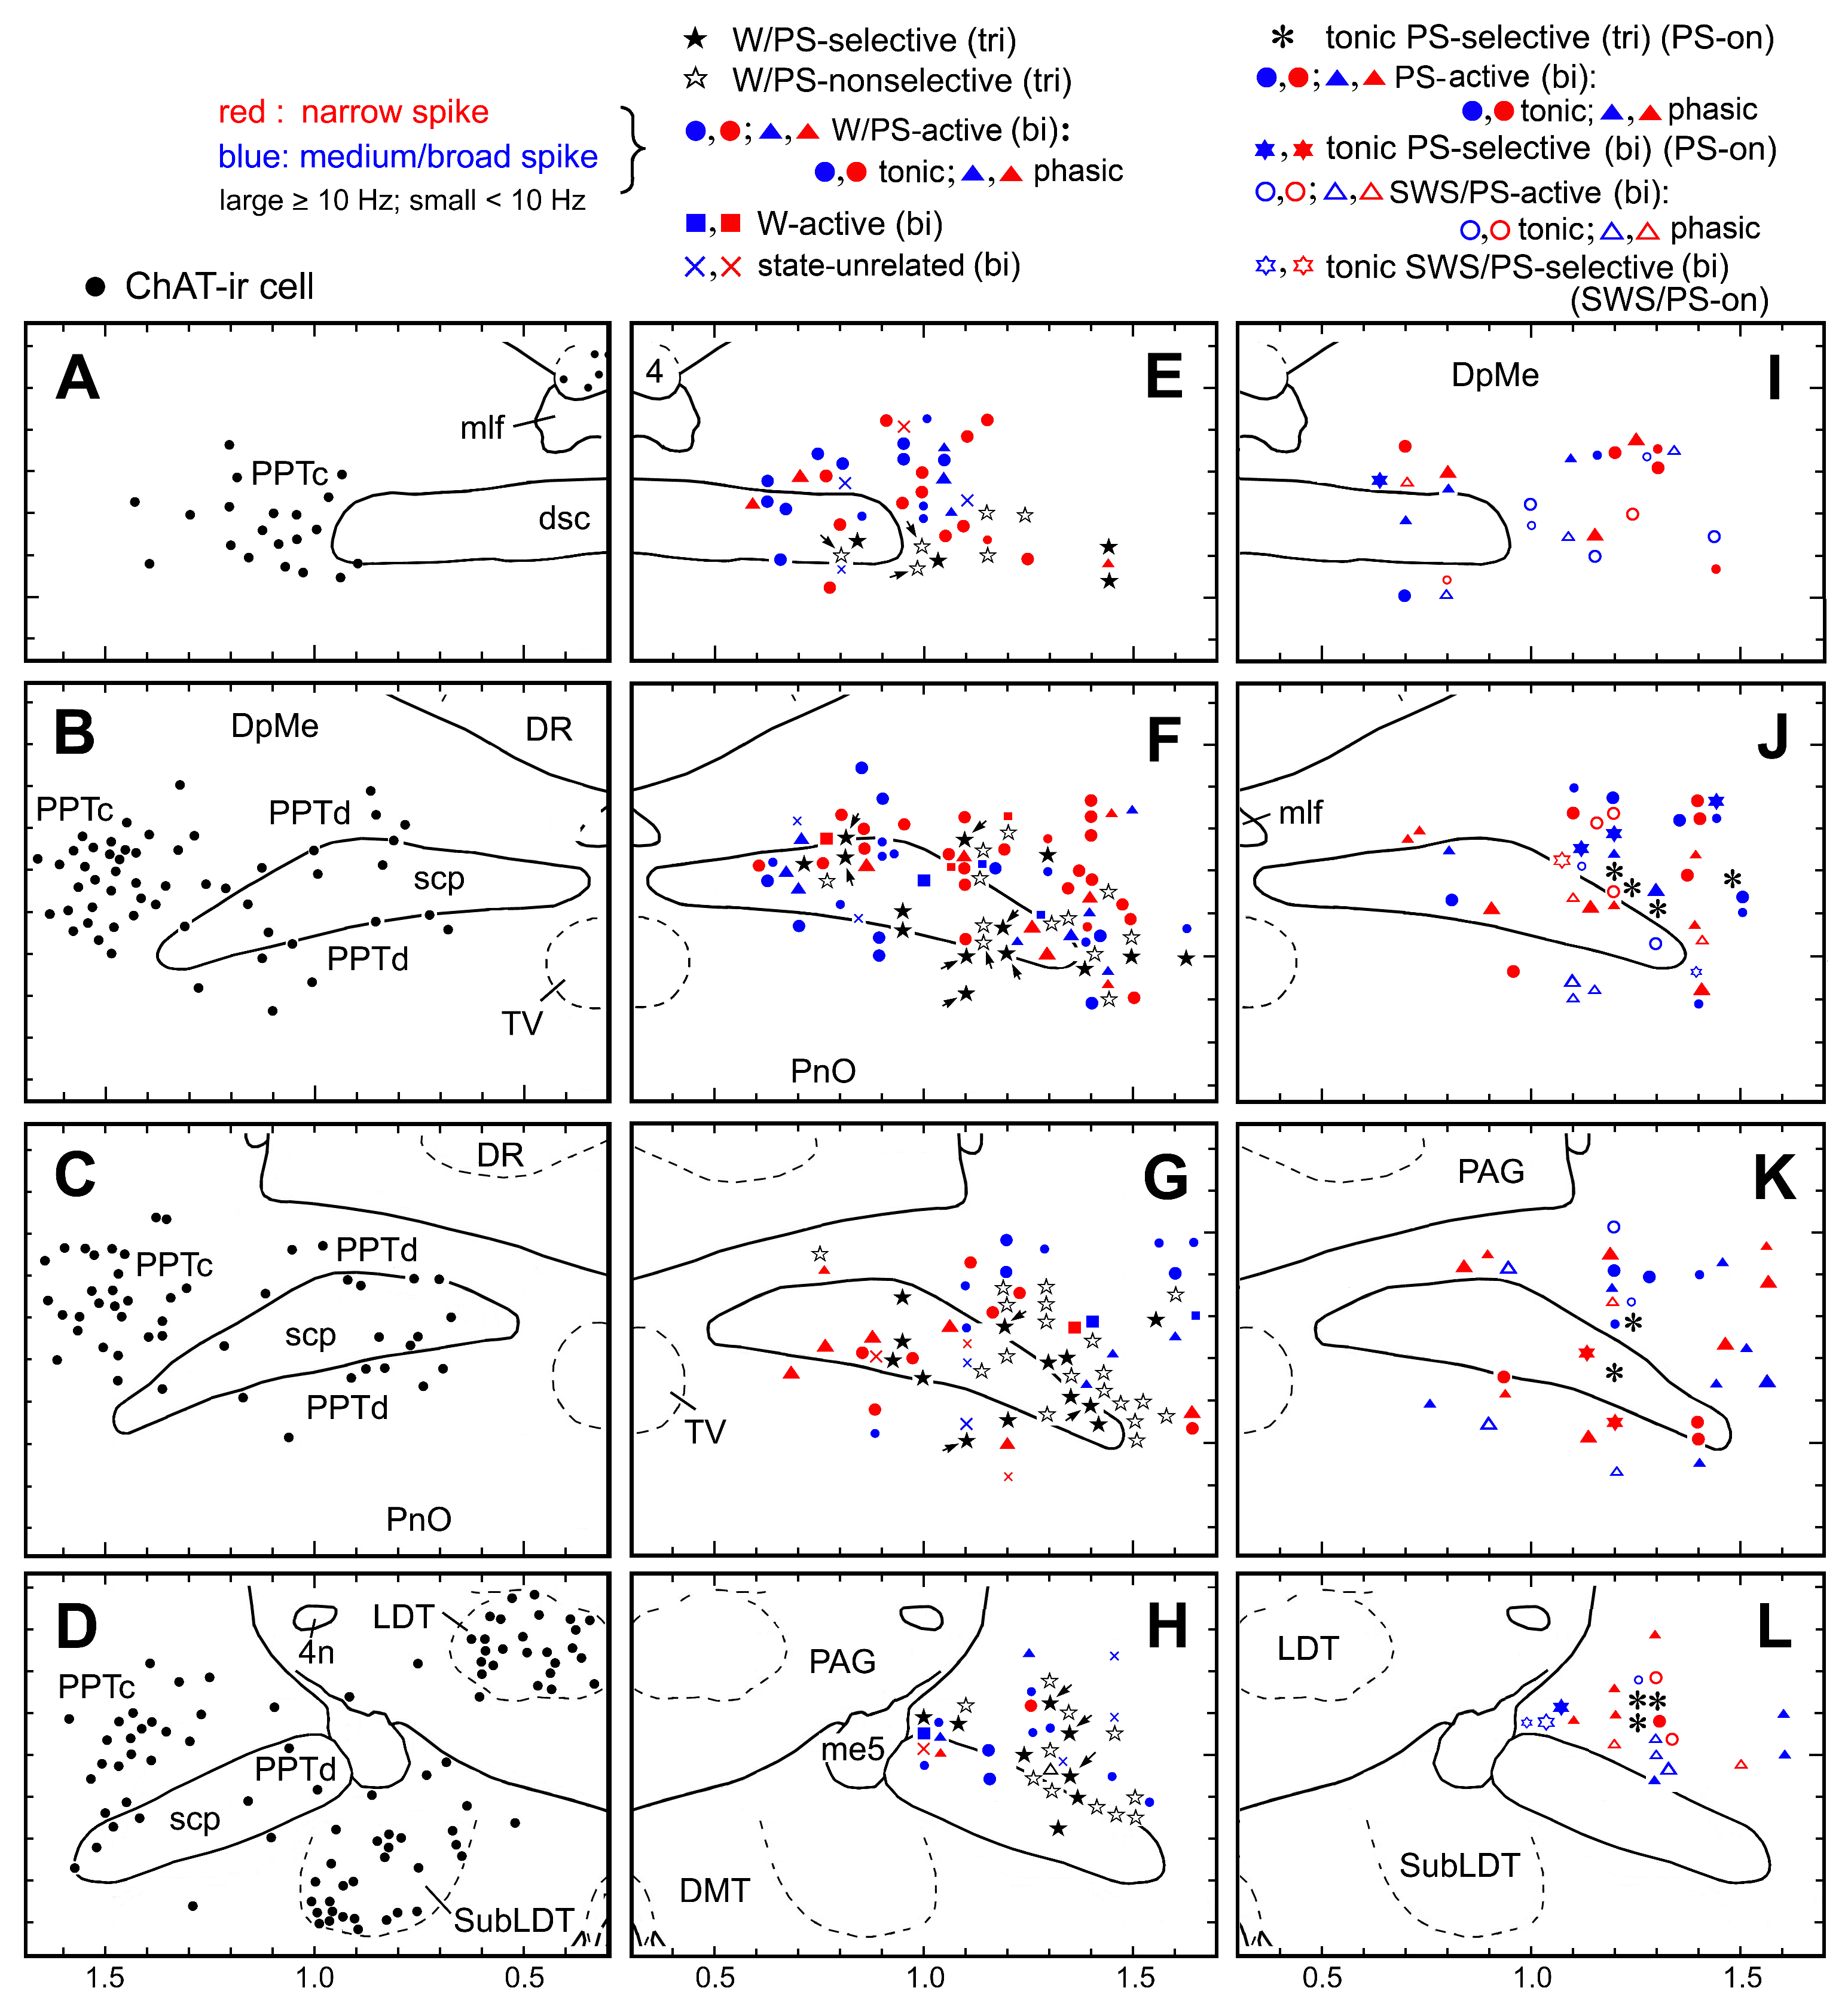
Figure 2. Camera lucida drawings of coronal brain sections (four different planes arranged in rostral to caudal order). (A-D) Distribution of ChAT-ir cholinergic neurons (filled circles). (E-H) Distribution of triphasic (tri) W/PS-active neurons (filled and nonfilled stars) and biphasic (bi) W/PS-active (filled circles [tonically discharging] and triangles [phasically discharging]), W-active (filled squares), and state-unrelated (crosses) neurons. Filled and nonfilled stars indicate, respectively, triphasic W/PS-selective and W/PS-nonselective neurons. The arrows indicate triphasic W/PS-active neurons discharging in association with a phasic cortical EEG potential. (I-L) PS-active and SWS/PS-active neurons. Asterisks indicate triphasic PS-on neurons, discharging tonically and selectively just prior to, and during, PS. Filled circles and triangles indicate biphasic PS-active neurons discharging, respectively, tonically or phasically during PS. Filled stars indicate biphasic PS-on neurons discharging tonically and selectively just prior to, and during, PS. Nonfilled circles and triangles indicate SWS/PS-active neurons discharging, respectively, tonically or phasically during PS. Nonfilled stars indicate biphasic SWS/PS-on neurons discharging tonically and selectively at high rates during both SWS and PS. In E-L, neurons showing a triphasic broad action potential are shown in black, while those showing a biphasic narrow or medium-to-broad action potential are shown, respectively, in red or blue. Large and small symbols indicate, respectively, rapidly firing (≥ 10 Hz, fast) or slowly firing (< 10 Hz, slow) neurons. 4, trochlear nucleus; 4n, trochlear nerve; DMT, dorsomedial tegmental area; DR, dorsal raphe nucleus; DpMe, deep mesencephalic nucleus; dsc, decussation of the superior cerebellar peduncule; LDT, laterodorsal tegmental nucleus; me5, mesencephalic trigeminal tract; mlf, medial longitudinal fasciculus; PAG, periaqueductal gray; PnO, oral pontine reticular nucleus; PPTc and PPTd, pedunculopontine tegmental nucleus, pars compacta and dissipata, respectively; scp, superior cerebellar peduncle; SubLDT, sublaterodorsal tegmental nucleus; TV, ventral tegmental nucleus.
Nomenclature used for dorsolateral tegmental structures
In the mouse dorsolateral mesopontine tegmentum, a dense collection of ChAT-ir cholinergic neurons is located dorsolateral to the superior cerebellar peduncule (scp), while others are scattered in, and around, the scp (Figures 1A and 2A-D). These dense or scattered neuron groups, respectively, correspond approximately to the pars compacta or dissipata of the PPT described in the rat [18,27,28], and will be referred to as, respectively, the PPTc and PPTd in the present study (Figure 2A-D). The PPT is defined here as a region surrounding the PPTc and PPTd, and distinguished from a cluster of cholinergic neurons referred to as the SubLDT [13,18,29], which is located beneath the periaqueductal gray (PAG) and LDT (Figure 2D). The areas containing cholinergic neurons located medial and ventral to the scp and those located lateral and dorsal to the scp are referred to by Boucetta et al. [29] as, respectively, the medial and lateral PPT, which correspond approximately to the pedunculopontine tegmental nucleus (PPTg) and the subpeduncular tegmental nucleus (SPTg) in the mouse atlas of Paxinos and Franklin [30] [Figures 3 and 4].
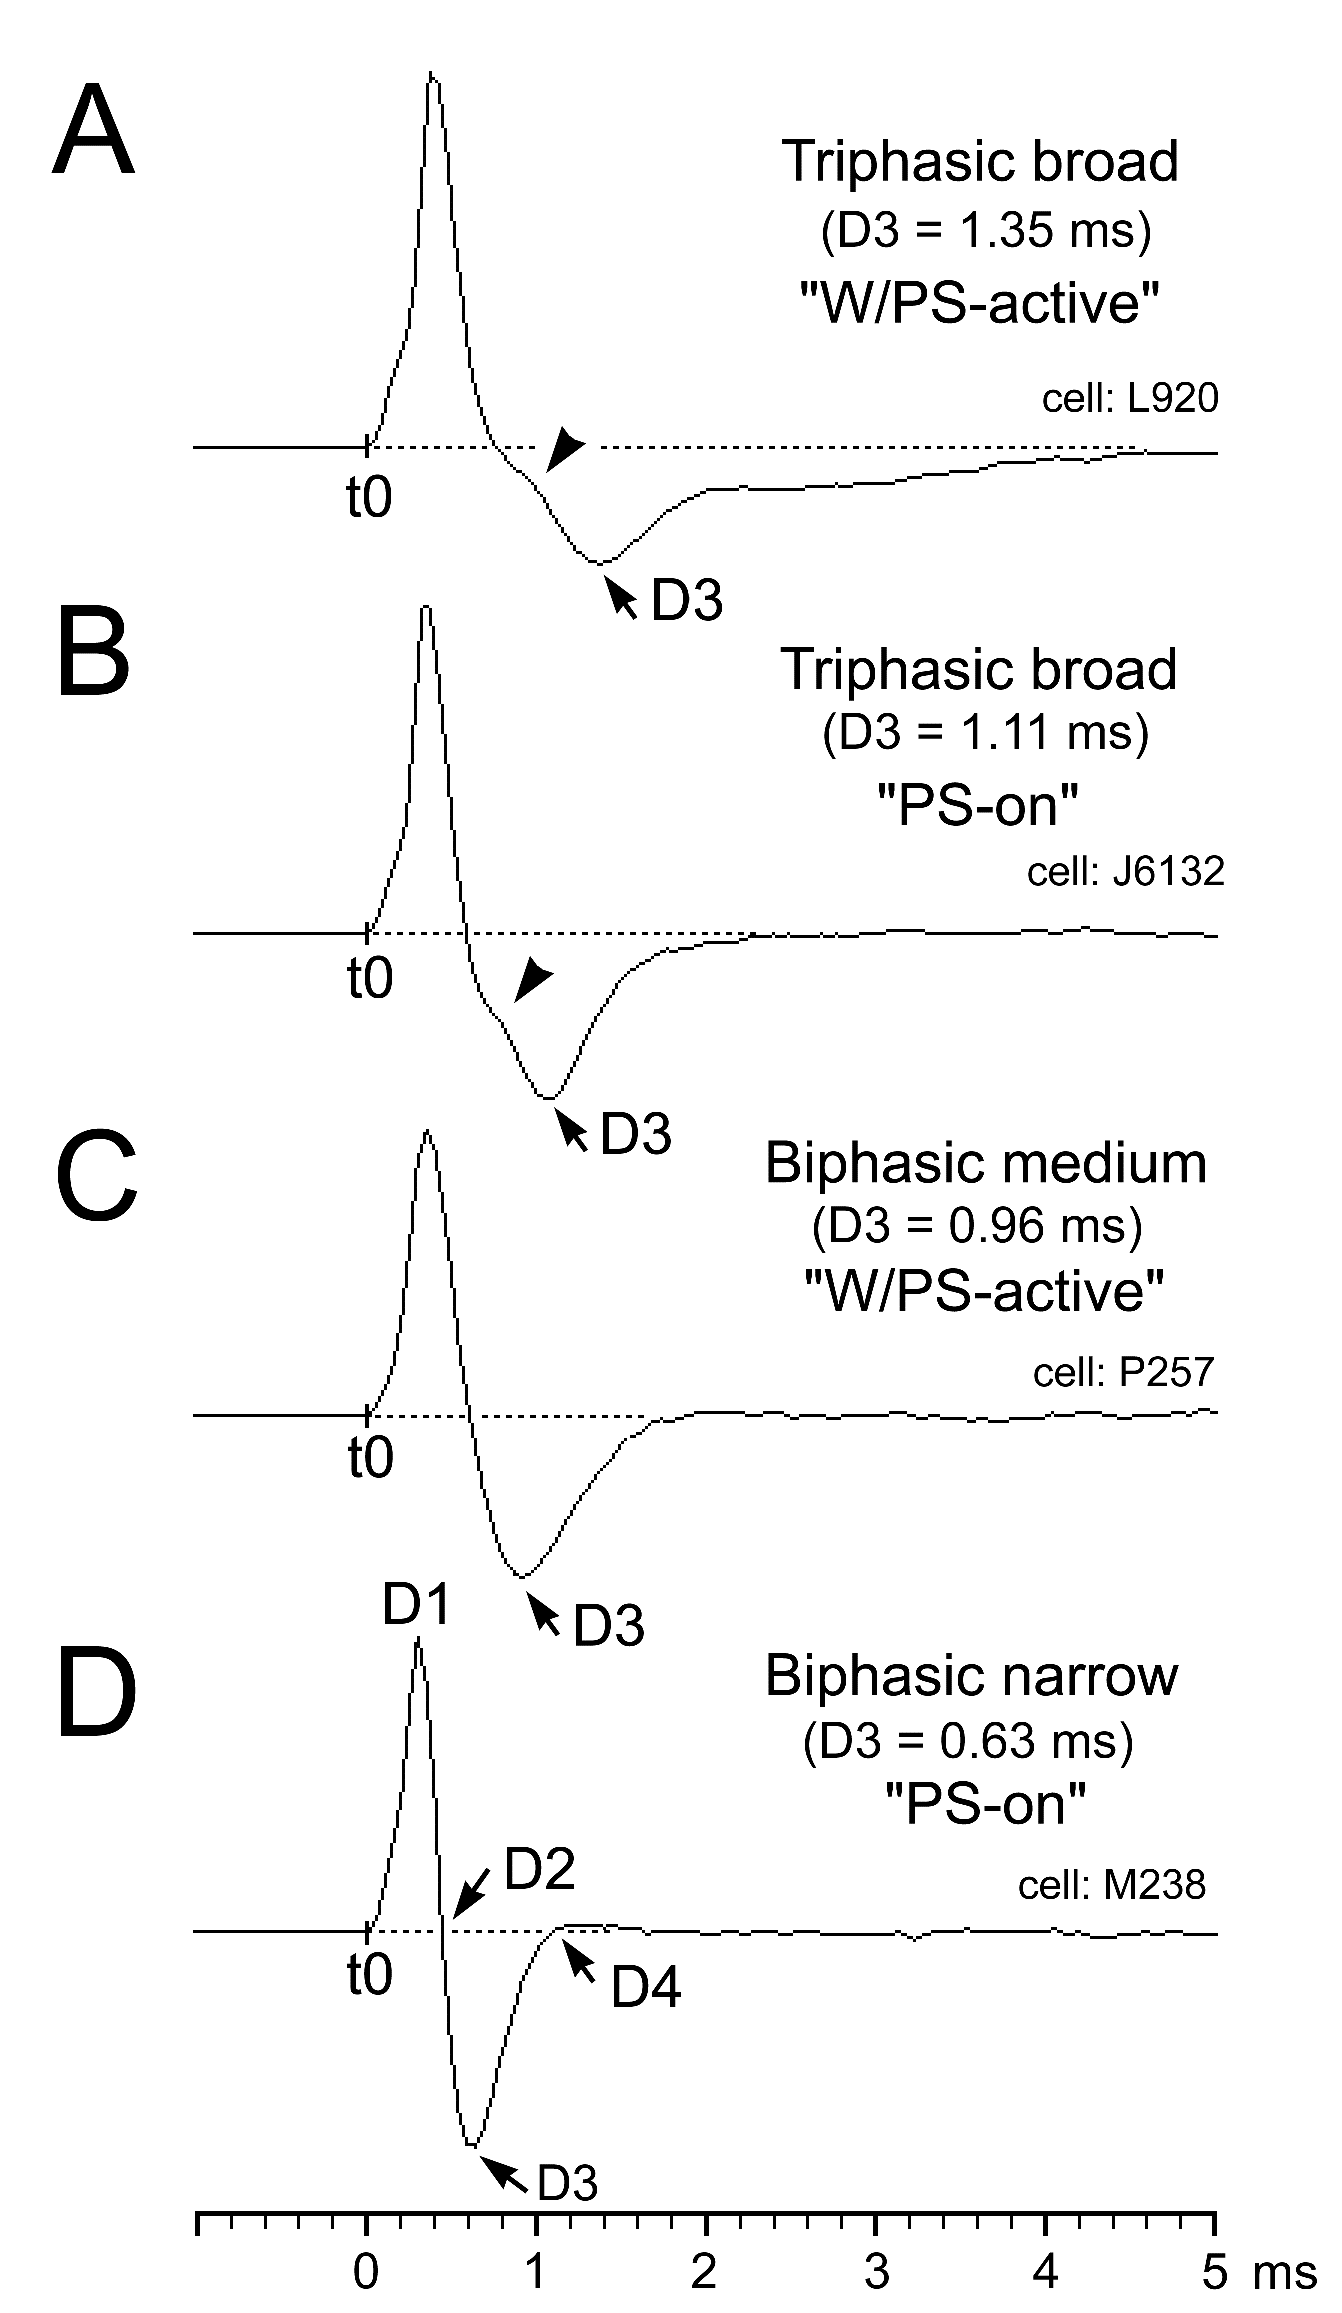
Figure 3. Triphasic and biphasic action potentials seen in PPT neurons recorded using a low frequency cutoff filter at 100 Hz. (A and B) A presumed cholinergic triphasic W/PS-active neuron discharging at a higher rate during both W and PS than during SWS (A) and a presumed cholinergic triphasic PS-on neuron discharging tonically and selectively just prior to, and during, PS (B). (C and D) A presumed non-cholinergic W/PS-active neuron displaying a biphasic action potential with a medium duration (D3 = 0.96 ms) (C) and a presumed non-cholinergic PS-on neuron showing a biphasic action potential with a narrow duration (D3 = 0.63 ms) (D). Note that the triphasic broad action potential is characterized by a shoulder during the descending phase of the spike potential, a unique characteristic of the triphasic neurons. D1-D4, duration of the averaged action potential measured from onset (t0) to the positive peak (D1), the first zero crossing (D2), the negative peak (D3), and the second zero crossing (D4).
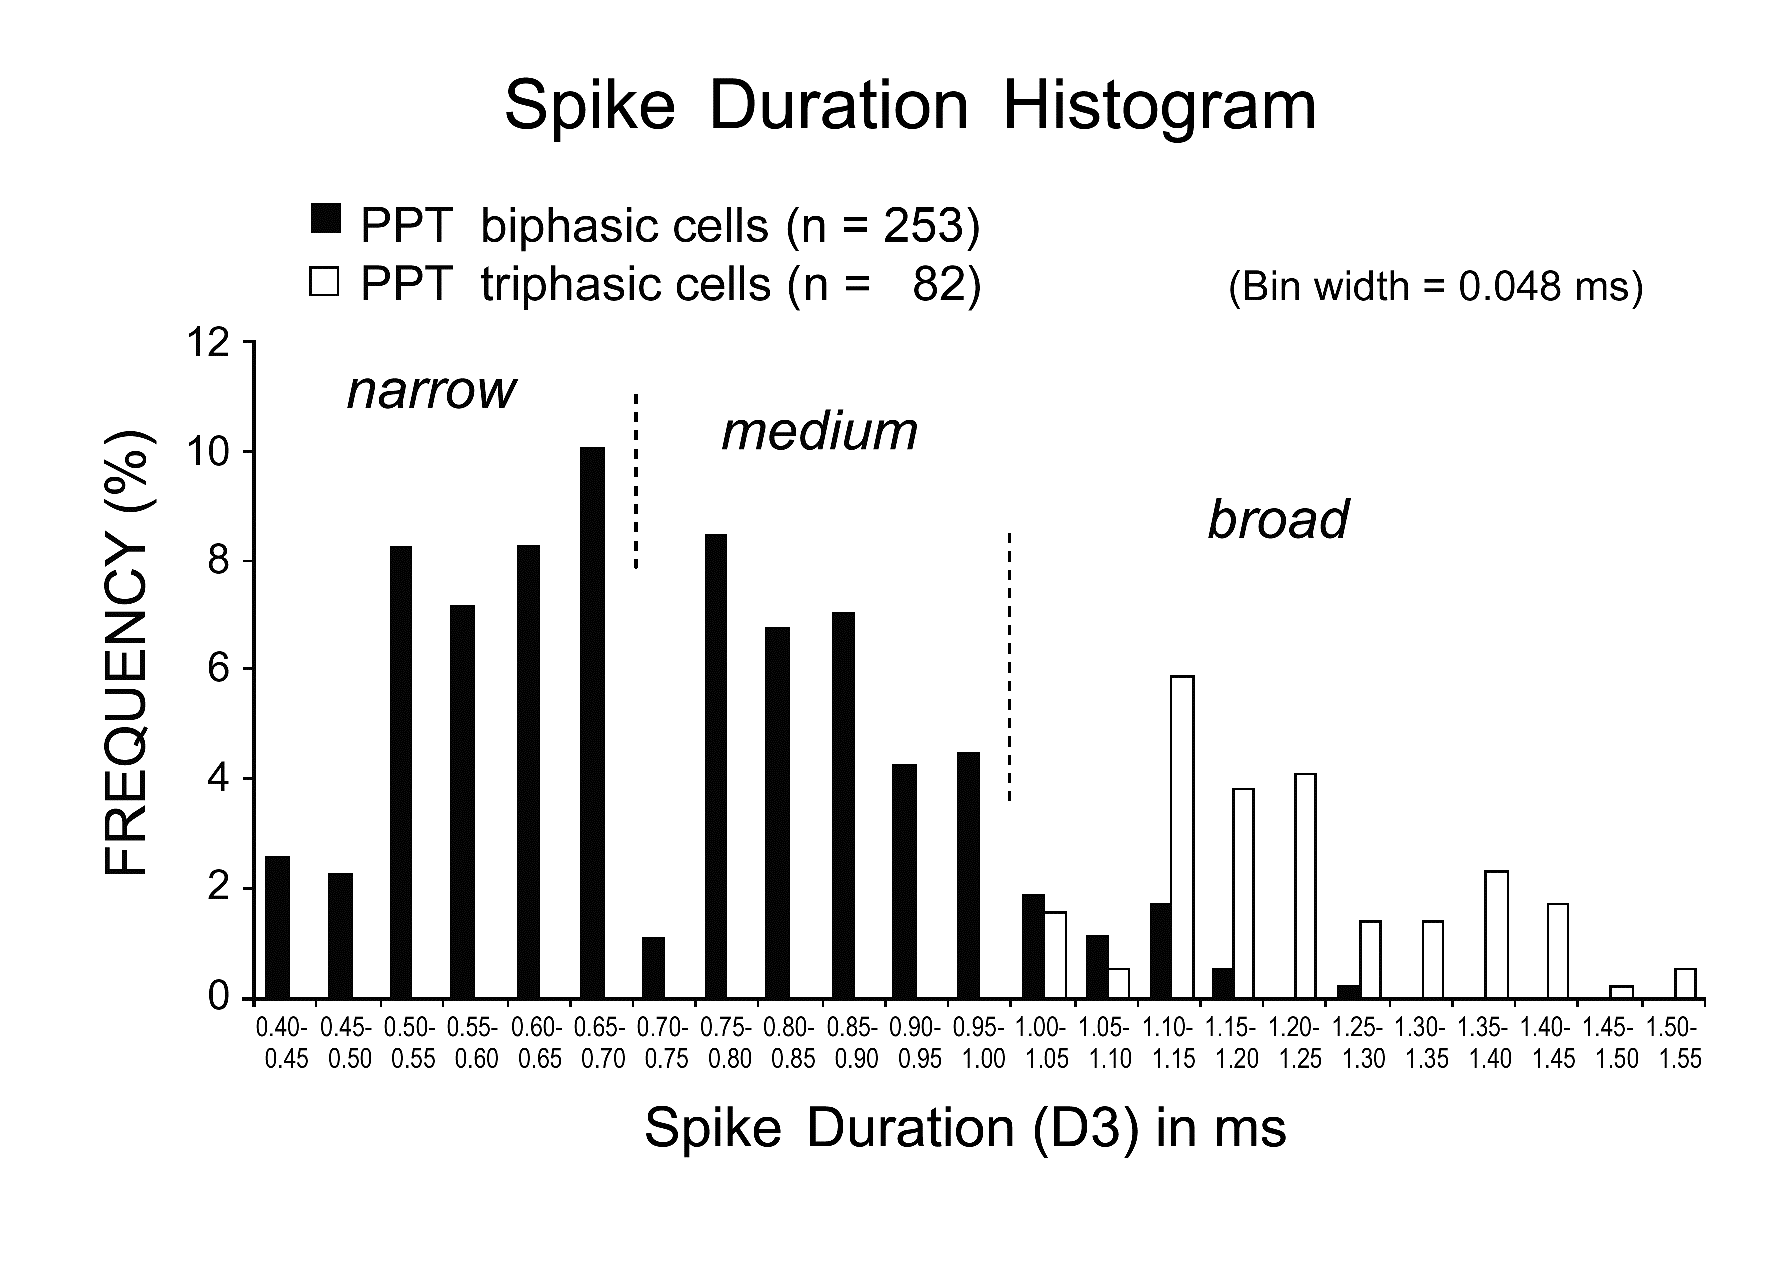
Figure 4. Histogram showing the distribution of spike duration D3 for biphasic (black) and triphasic (white) PPT neurons. Note that all the triphasic PPT neurons have a long duration (D3 > 1.0 ms) action potential, while the biphasic PPT neurons have either a short duration, narrow action potential (D3 < 0.7 ms) or a medium (D3 between 0.7 and 1.0 ms)-to-broad (D3 ≥ 1.0 ms) action potential. All neuronal activity was recorded using a low frequency cutoff at 100 Hz and digitized at a sampling rate of 20.8 kHz.
General characteristics of PPT neurons
A total of 335 neurons were recorded in the PPT during the complete sleep-wake cycle (Table 1). On the basis of differences in firing patterns during the sleep-wake cycle, the PPT neurons were divided into the four groups of (i) W-active neurons (n = 10; 3.0%) discharging maximally during W, (ii) W/PS-active neurons (n = 195; 58.2%) exhibiting a higher discharge rate during W and PS than during SWS, (iii) state-unrelated neurons (n = 14; 4.2%) showing state-indifferent unit activity, and (iv) sleep-active neurons (n = 116; 34.6%) discharging maximally during sleep. None of the sleep-active neurons discharged maximally during SWS (SWS-active neurons), but discharged at high rates either during PS (PS-active neurons) (n = 79; 23.6%) or during both SWS and PS (SWS/PS-active neurons) (n = 37; 11.0%). All PS-active neurons showed a PS firing rate/SWS (S2) firing rate ratio > 2. The W/PS-active, PS-active, and SWS/PS-active neurons displayed either intermittent, phasic discharge or sustained, tonic discharge during PS, and will be referred to as, respectively, “phasic” and “tonic” neurons. Regardless of firing patterns as single isolated spikes, clusters, or bursts (see below), the phasic neurons ceased firing during PS >2-3 sec even during a steady state of PS with sustained rhythmic theta waves, while the tonic neurons fired throughout the PS episode without interruption. Sixteen of the 79 PS-active neurons discharged tonically and selectively just prior to, and during, PS, and these “tonic PS-selective” neurons will be referred to as “PS-on” neurons, while four of the 37 SWS/PS-active neurons discharged at high rates selectively and tonically during both SWS and PS, and these “tonic SWS/PS-selective” neurons will be referred to as “SWS/PS-on” neurons.
Table 1. Number (percentage) of the state-related and state-unrelated neurons recorded in the PPT.
Cell type |
Number (percentage) of recorded neurons |
I. W-active (biphasic) |
10 (3.0%) |
II. W/PS-active |
195 (58.2%) |
A. triphasic |
73 (21.8%) |
B. biphasic |
122 (36.4%) |
B1. phasic |
33 (9.9%) |
B2. tonic |
89 (26.6%) |
III. Unrelated (biphasic) |
14 (4.2%) |
IV. Sleep-active |
116 (34.6%) |
1. SWS-active |
0 (0.0%) |
2. PS-active |
79 (23.6%) |
A. triphasic |
9 (2.7%) |
A.1. PS-on |
9 (2.7%) |
B. biphasic |
70 (20.9%) |
B1. phasic
B2. tonic
B2. 1. PS-on |
35 (10.4%)
35 (10.4%)
7 (2.1%) |
3. SWS/PS-active |
37 (11.0%) |
A. triphasic |
0 (0.0%) |
B. biphasic |
37 (11.0%) |
B1. phasic
B2. tonic
B2. 1. SWS/PS-on |
17 (5.1%)
20 (6.0%)
4 (1.2%) |
Total |
335 |
PPT neurons displayed either a triphasic broad action potential with a shoulder on its descending phase (n = 92; 27.5%) (Figure 3A and B) or a biphasic action potential of variable duration (n = 243; 72.5%) (Figure 3C and D). Figure 4 is a histogram showing the frequency of the spike duration measured from the onset to the negative peak (D3) for all the triphasic and biphasic PPT neurons. As shown in this figure, all triphasic PPT neurons had a long duration (D3 > 1.0 ms) action potential, while the biphasic PPT neurons had either a short duration (D3 < 0.7 ms) or a medium duration (D3 between 0.7 and 1.0 ms)-to-long duration (D3 ≥ 1.0 ms) action potential. The triphasic PPT neurons were either W/PS-active (n = 73) or PS-on (n = 9) neurons, while the biphasic PPT neurons were W-active (n = 10), W/PS-active (n = 122), PS-active (n = 70), SWS/PS-active (n = 37), or state-unrelated (n = 14) neurons. The number and percentage of triphasic or biphasic state-related and state-unrelated neurons recorded in the PPT are shown in Table 1, while the location of the recorded neurons is shown in Figure 2. The mean spontaneous discharge rates during the sleep-wake cycle for the W-active, W/PS-active, and state-unrelated neurons are shown in Figure 5, while those for the sleep-active neurons are shown in Figure 10. The possible cholinergic nature or non-cholinergic nature of, respectively, triphasic or biphasic PPT neurons will be described below.
Juxtacellular Nb labeling and ChAT immunostaining
Using four mice under ketamine/xylazine anesthesia (see above), 13 neurons were successfully labeled with Nb and were found to be located in the PPT. Of these, 10 were ChAT-immunonegative (Figure 1B, arrow) and 3 were ChAT-immunopositive (Figure 1C, arrowhead). The Nb-labeled ChAT-immunonegative neurons were all characterized by a biphasic action potential of variable duration (0.84 ± 0.13 ms, mean ± SD for D3 values), while all double-labeled neurons were characterized by a triphasic broad action potential (1.43 ± 0.12 ms).
In the present paper, I will mainly describe the characteristics of (i) triphasic, presumed cholinergic W/PS-active and PS-on neurons and (ii) biphasic, presumed non-cholinergic PS-on neurons in relation to the induction and maintenance of PS and the tonic and phasic cortical activation occurring during PS.
Characteristics of PPT W-active neurons
Of the 10 W-active neurons (indicated by red- or blue-filled squares in Figure 2E-H), 5 exhibited slow spontaneous discharges (< 10 Hz; indicated by small squares) and 5 fast spontaneous discharges (≥ 10 Hz; indicated by large squares). Both types discharged at the highest rate during AW and at progressively slower rates during QW and subsequent SWS and PS (Figure 5A). Three slow and two fast W-active neurons displayed a W-selective discharge profile, remaining virtually silent during both SWS and PS. Both the slow and fast W-active neurons discharged as single isolated spikes, clusters (peak instantaneous mean frequency [IMF] < 100 Hz), or bursts (peak IMF ≥ 100 Hz) and were located mainly in the middle PPT.
Characteristics of PPT W/PS-active neurons
The PPT W/PS-active neurons displayed either a triphasic broad action potential (n = 73) (indicated by filled or nonfilled black stars in Figure 2E-H; see below) or a biphasic action potential of variable duration (n = 122) (indicated by red- or blue-filled or nonfilled circles or triangles in Figure 2E-H).
Discharge rate and pattern of the triphasic W/PS-active neurons: All the triphasic, presumed cholinergic W/PS-active neurons exhibited slow (< 10 Hz) spontaneous discharges, discharging either throughout the sleep-wake states (n = 39) or selectively during activation of the cortical EEG occurring during W and just prior to, and during, PS (n = 34). They are hereafter referred to as, respectively, “W/PS-nonselective” and “W/PS-selective” neurons (Figure 5B). The location of these two types of neurons is indicated in Figure 2E-H by, respectively, nonfilled and filled black stars, while their representative spike activities during the sleep-wake cycle are given, respectively, in Figures 6 and 7.
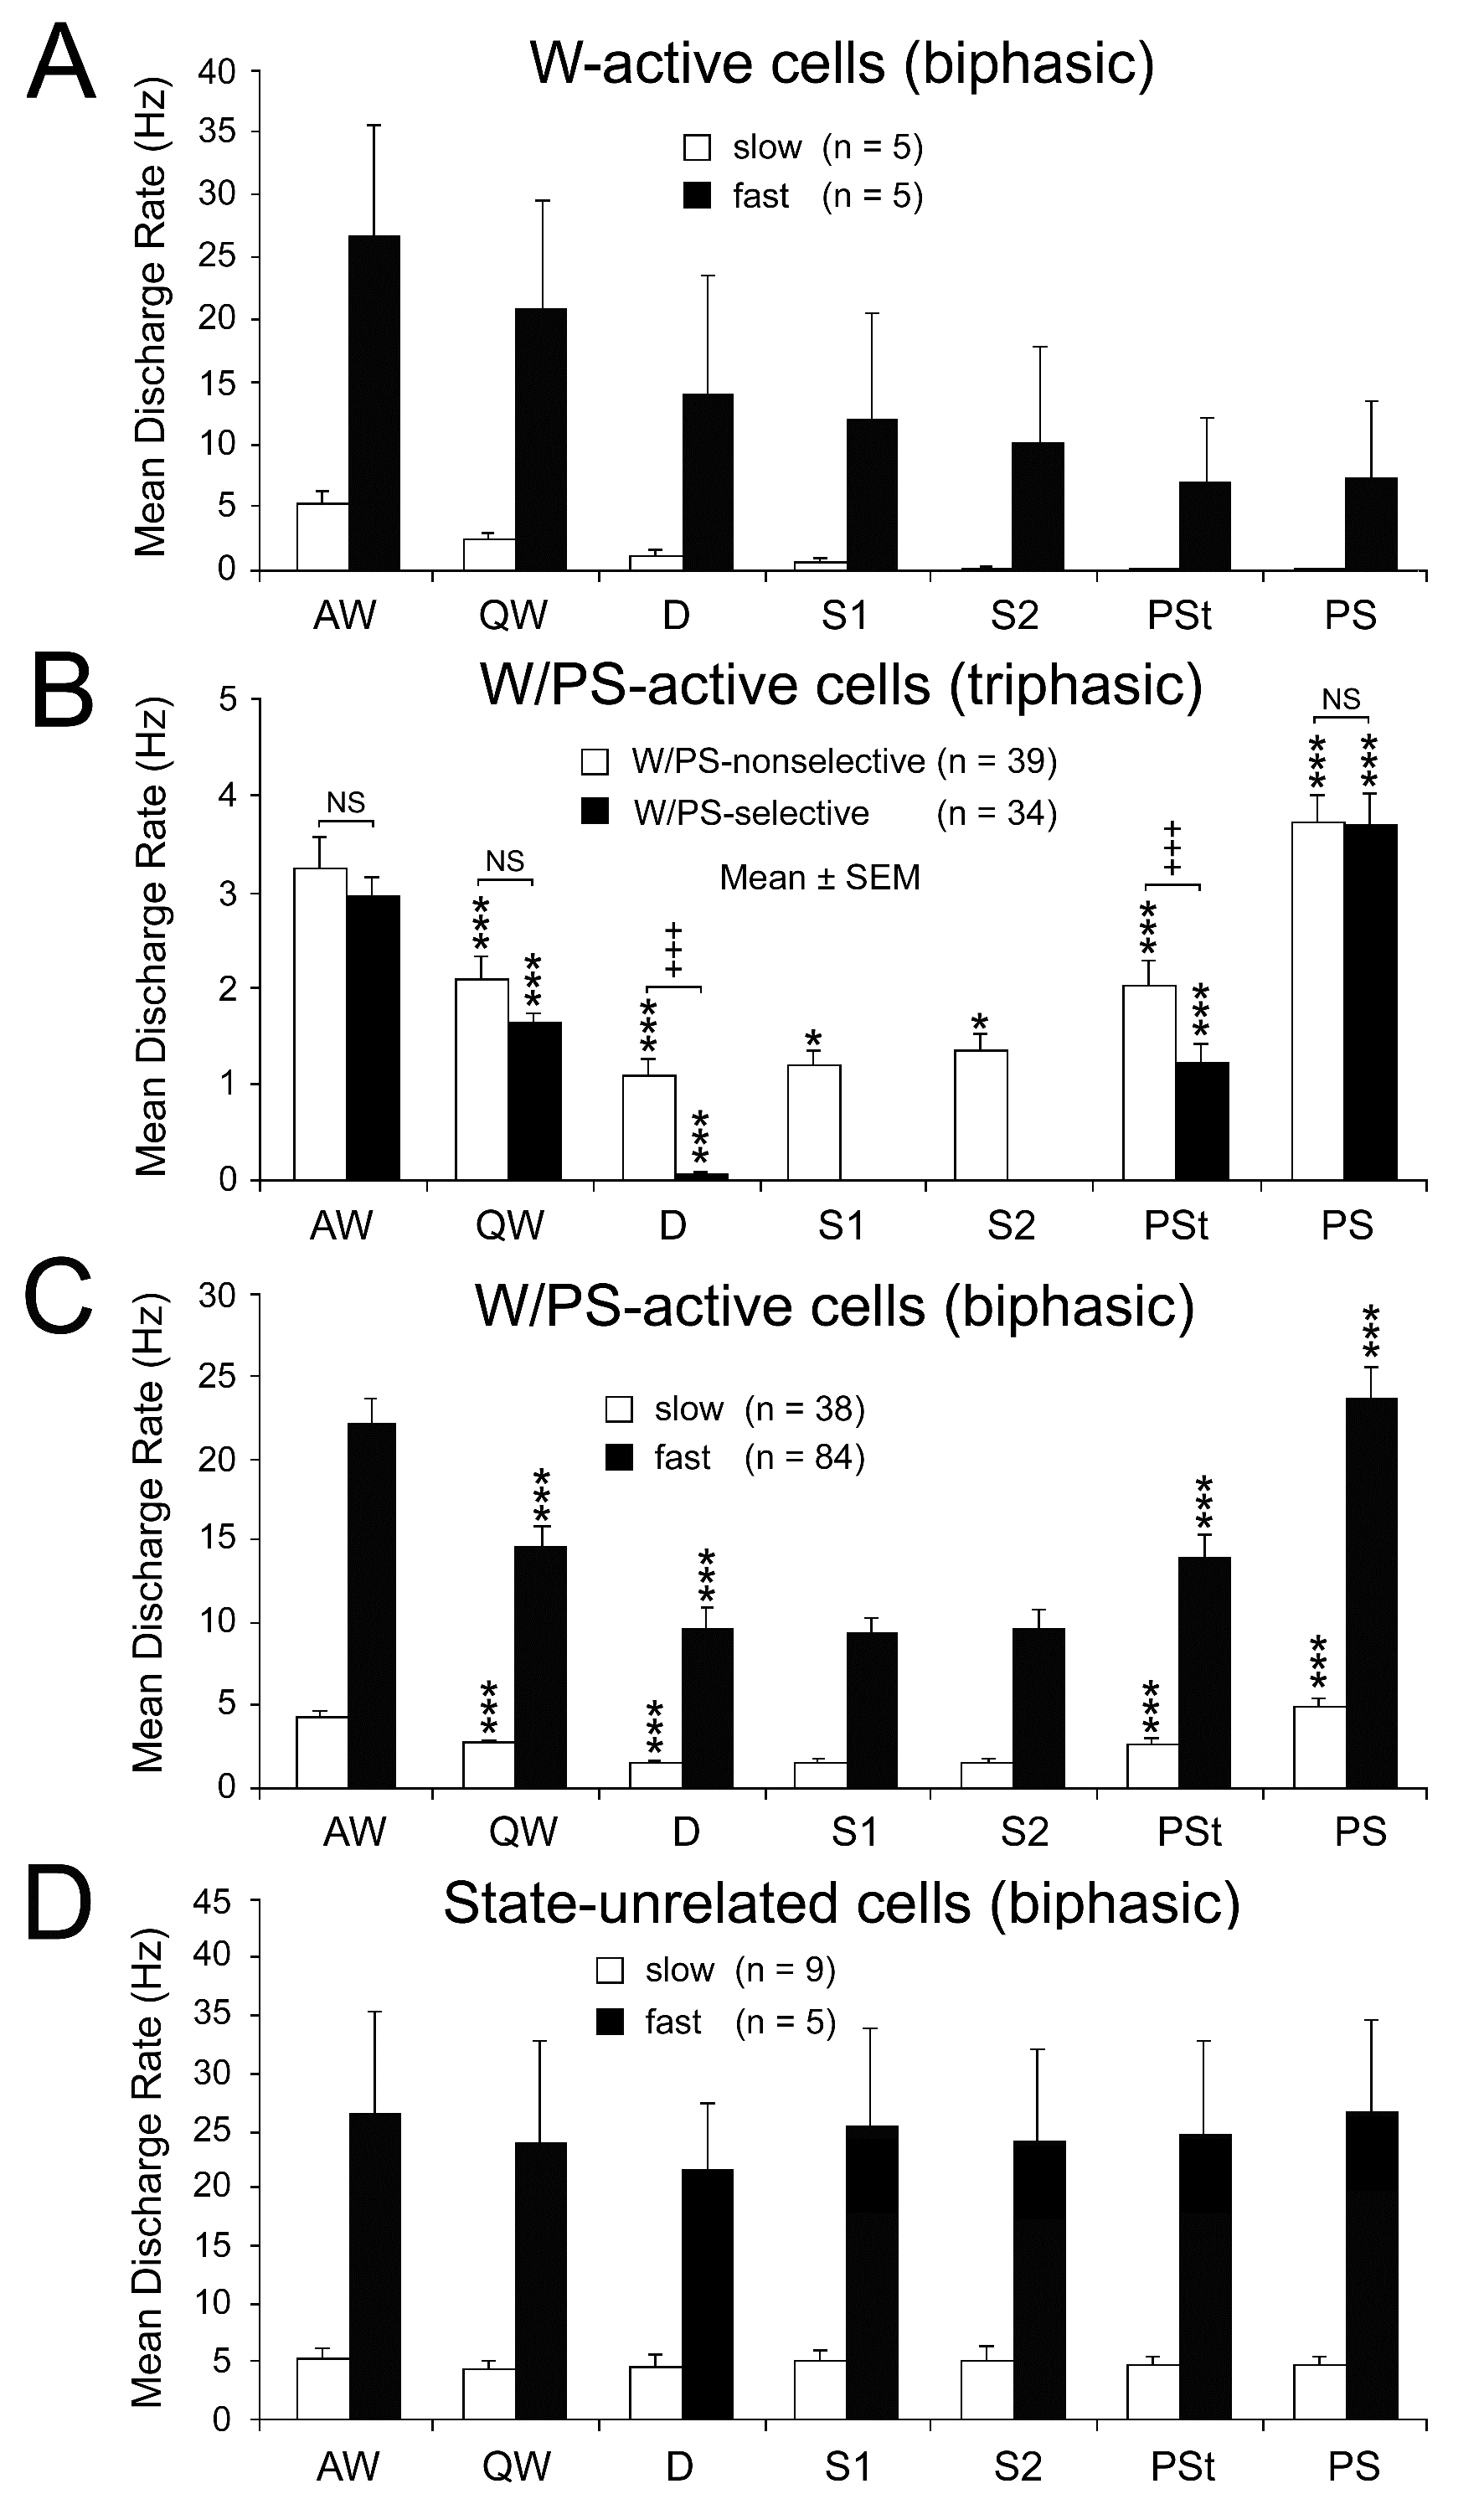
Figure 5. Mean spontaneous discharge rates of biphasic W-active (A), triphasic W/PS-active (B), biphasic W/PS-active (C), and biphasic state-unrelated (D) neurons recorded in the PPT during the sleep-wake cycle. The biphasic neurons were subdivided into two groups (slow and fast) on the basis of their low (< 10 Hz) or high (≥10 Hz) spontaneous firing rate during W. The triphasic neurons were subdivided into two groups on the basis of their nonselective (white) or selective (black) discharge during EEG activation occurring during W and PS. The difference in discharge rate across the sleep-wake states was highly statistically significant (P<0.0001, Friedman) for the 4 W/PS-active neuron groups, but not for the slow state-unrelated neuron group (P < 0.76, Friedman); statistical analysis was not carried out on neuron groups with a small number (n) of cells (< 6). A significant difference in discharge rate between two successive states is indicated by asterisks (*P<0.05; **P<0.01, *** P<0.001, Wilcoxon). In (B), a significant difference in discharge rate in each state between W/PS-selective and W/PS-nonselective neurons is indicated by crosses (+++P<0.001, Mann-Whitney).
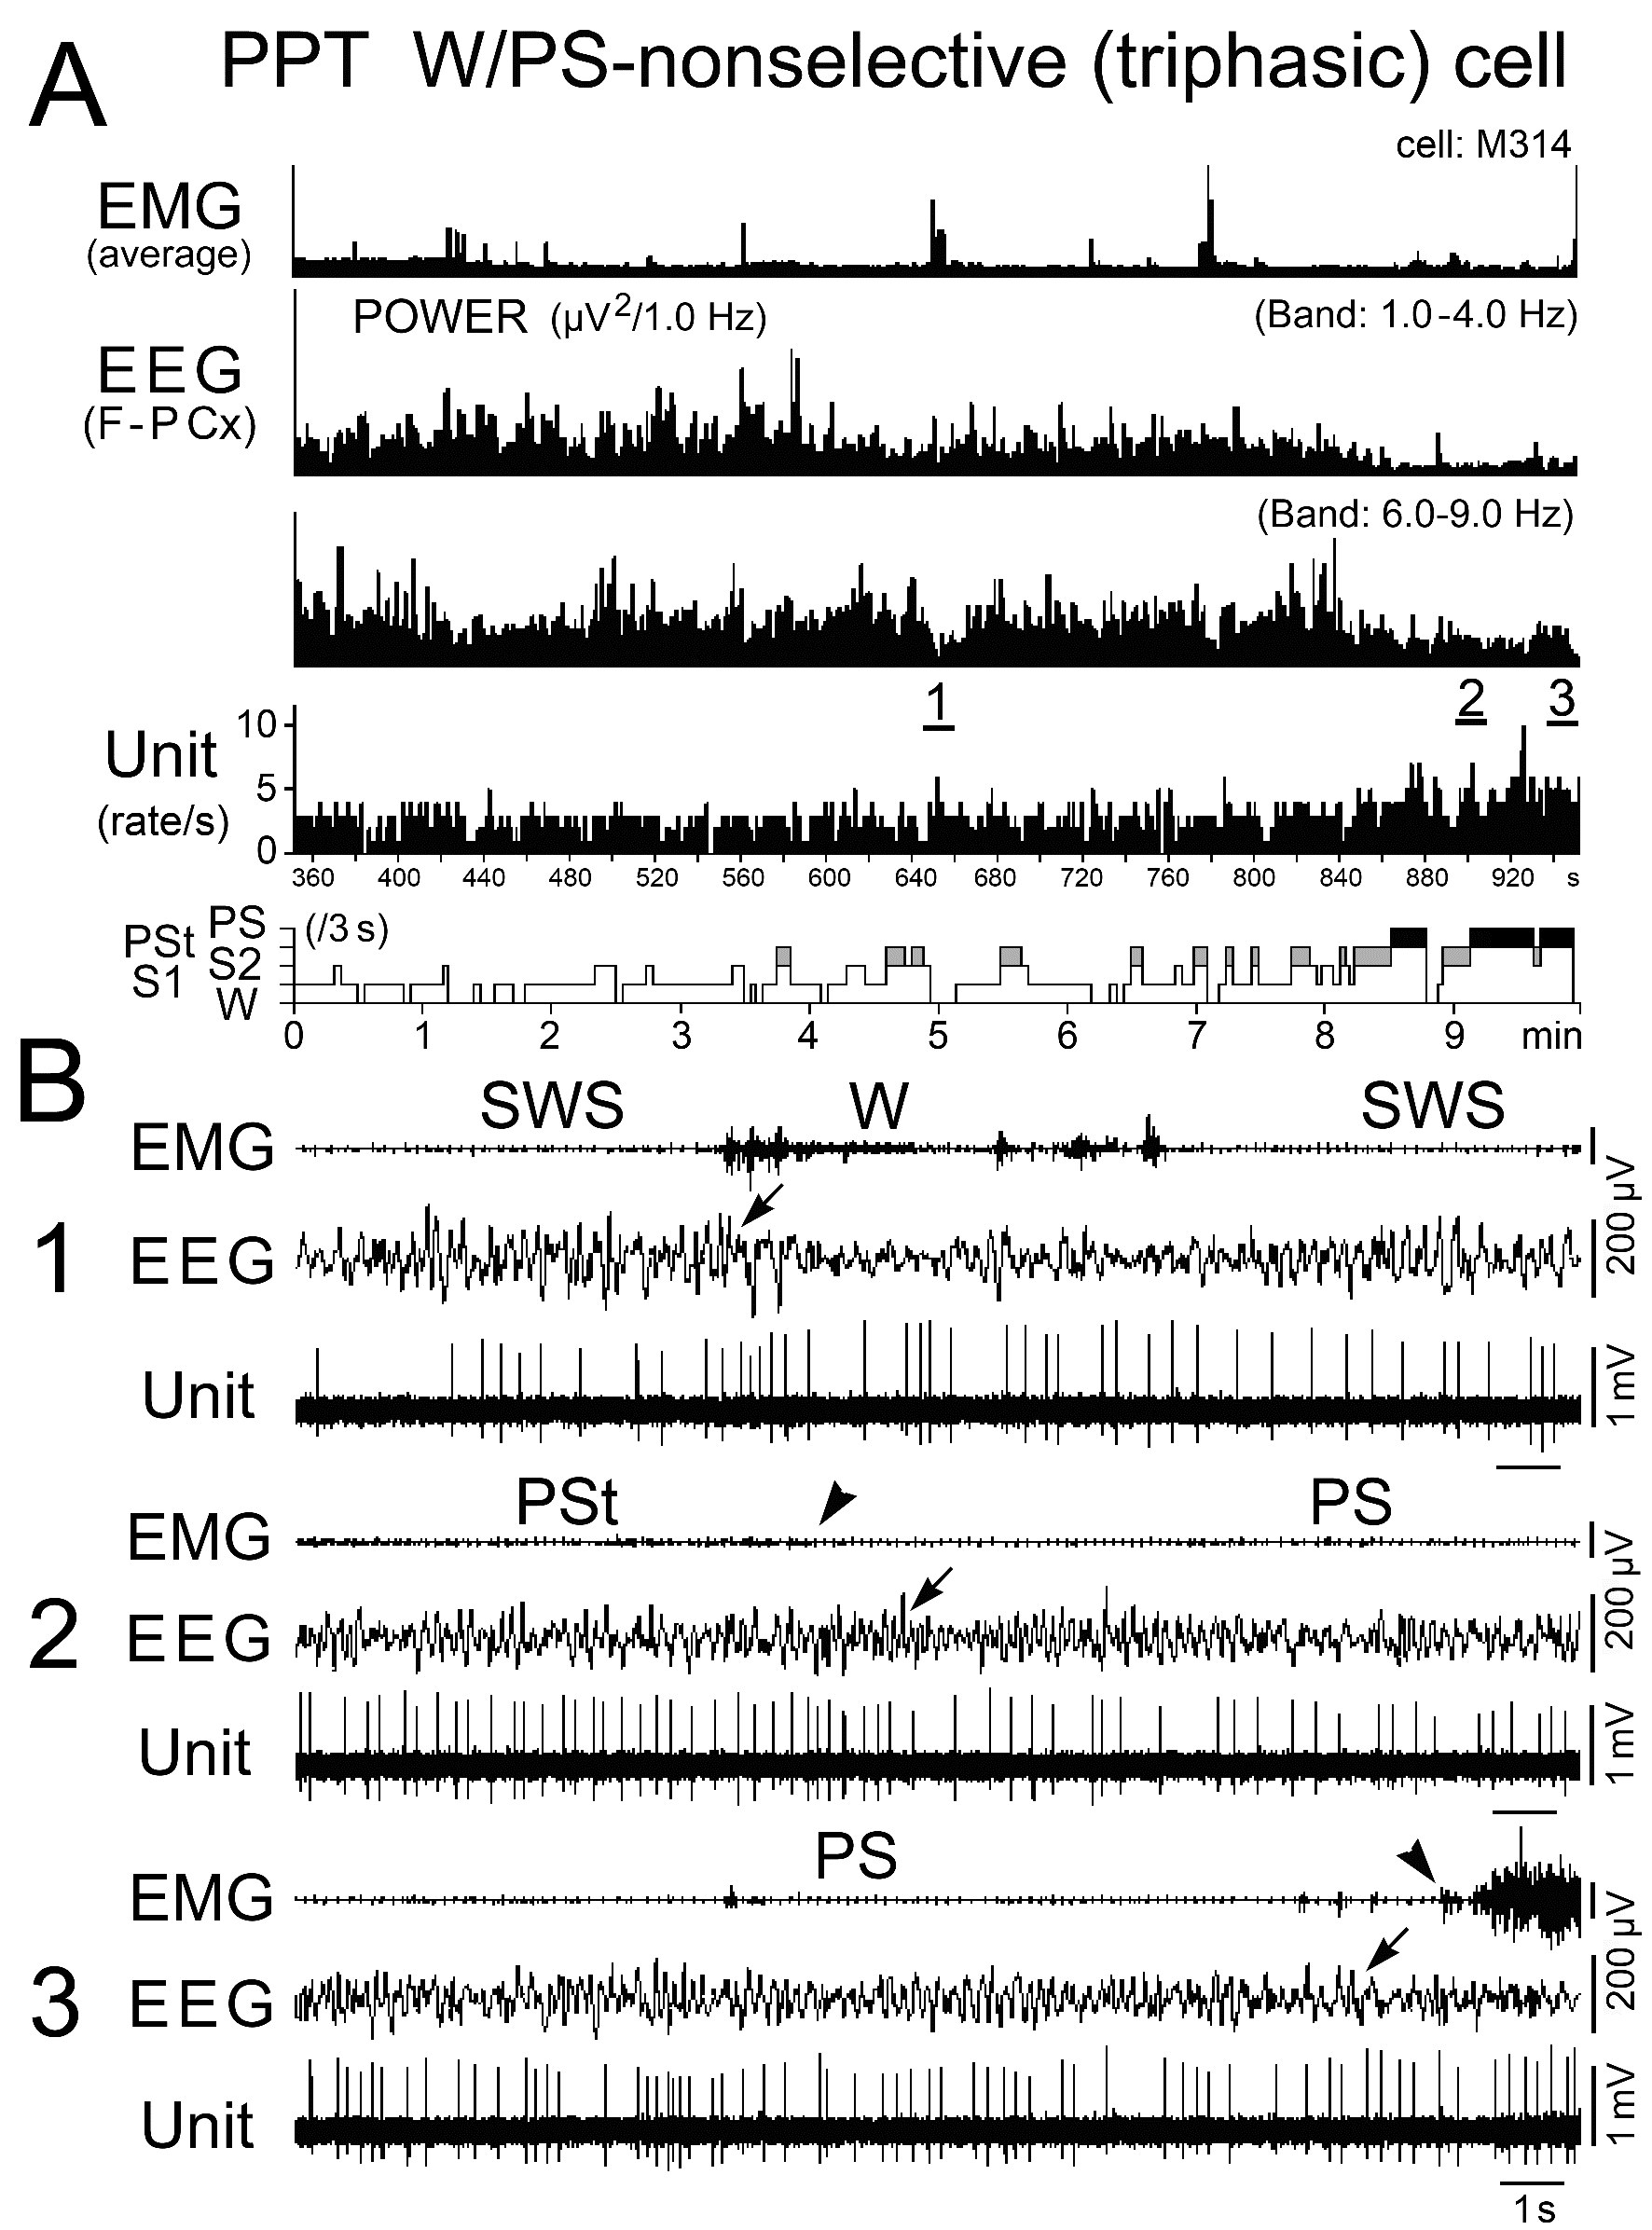
Figure 6. Activity of a representative triphasic W/PS-nonselective neuron recorded in the PPT during the sleep-wake cycle. The three traces in (B) are from the periods indicated by the bars labeled "1", "2", and "3" in (A). The arrows on the EEG traces in (B) indicate the state transition, respectively, from SWS to W (1), PSt to PS (2), and PS to W (3). The arrowheads on the EMG traces in (B) indicate, respectively, disappearance (2) and recovery (3) of EMG activity. In (A), the behavioral states (W, S1, S2, PSt, and PS) were identified using 3-s bins, as in the following figures. Note that the neuron discharged as single isolated spikes throughout the behavioral states.
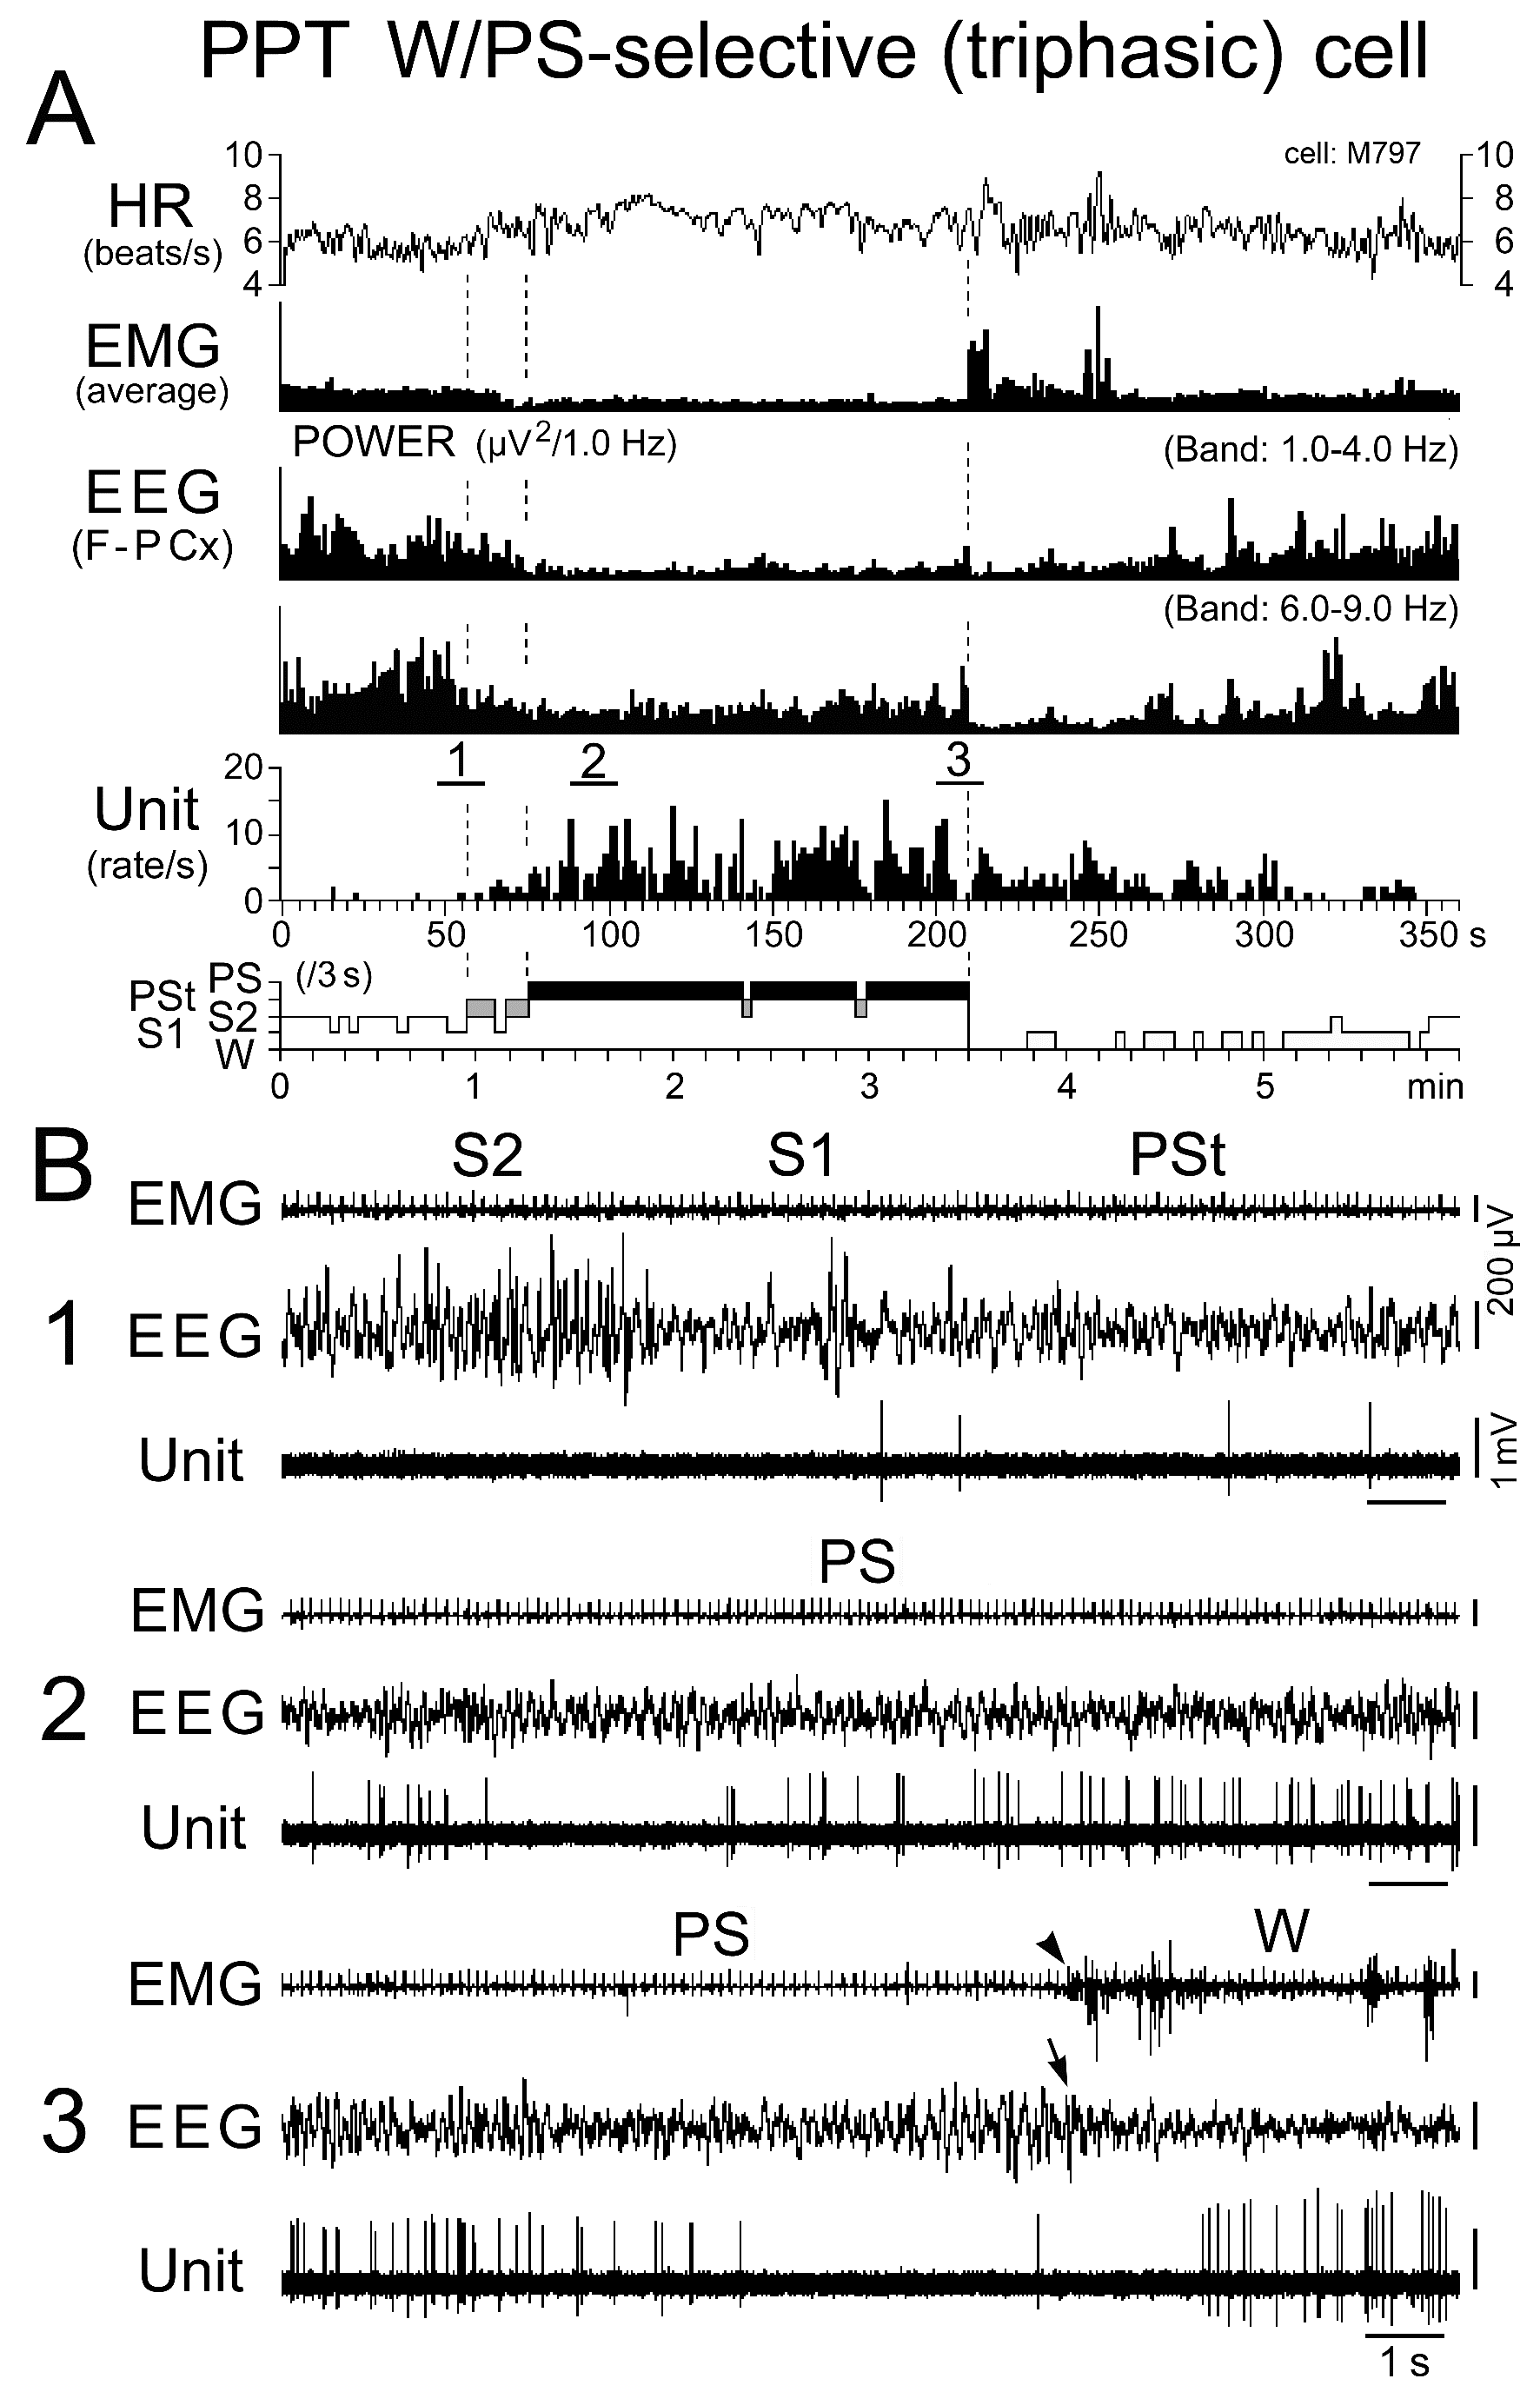
Figure 7. Activity of a representative triphasic W/PS-selective neuron recorded in the PPT during the sleep-wake cycle. The three traces in (B) are from the periods indicated by the bars labeled "1", "2", and "3" in (A). The arrow indicates the state transition from PS to W, characterized by the interruption of rhythmic theta waves, while the arrowhead indicates the recovery of EMG activity at the same transition. Note the cessation of discharge prior to, and during, the onset of W at the transition from PS. Note that the neuron discharged as single isolated spikes, clusters, or bursts during PS. The dotted lines in (A) indicate the state transitions from SWS to PST, PSt to PS, and PS to W.
As shown in Figure 5B, the W/PS-nonselective and W/PS-selective neurons discharged at high rates during AW, but the former group showed a significantly decreased discharge rate during QW and subsequent D, while the latter group ceased firing before the onset of D. The W/PS-selective neurons remained completely silent during SWS, but displayed a significant increase in discharge rate with the appearance of PSt, then a further significant increase throughout PS. In contrast, the W/PS-nonselective neurons discharged at progressively increased discharge rates during SWS and showed a further significant increase in discharge rate during PSt and subsequent PS (Figures 5B and 6). For the W/PS-selective neurons, a significant difference in the mean firing rate was seen between the waking states (AW and QW) and PS, the firing rate increasing in the order QW<AW<PS (P < 0.05; Wilcoxon) (Figure 5B), while the W/PS-nonselective neurons showed no significant difference between AW and PS (P < 0.28; Wilcoxon). There was no significant difference between W/PS-selective and W/PS-nonselective neurons in mean firing rate in AW, QW, and PS (P > 0.32; Wilcoxon), but there was a highly statistically significant difference in mean firing rate during D and PSt (P < 0.001; Wilcoxon) (Figure 5B).
Nine of the 39 W/PS-nonselective neurons discharged exclusively as single isolated spikes (Figure 6), whereas the other 30 discharged either as single isolated spikes or clusters of two to three spikes (peak IMF < 100 Hz; n = 11) or as single isolated spikes, clusters, or bursts of three to five spikes (peak IMF between 100 Hz and 200 Hz; n = 19). The 34 W/PS-selective neurons never discharged exclusively as single isolated spikes, but discharged either as single isolated spikes or clusters (n = 9) or as single isolated spikes, clusters, or bursts (n = 25), as seen with the W/PS-nonselective neurons. The bursting discharges seen in both the W/PS-nonselective and W/PS-selective neurons were particularly prominent during PS, during waking periods when they were accompanied by abrupt body movements, or in response to arousing stimuli (hand clapping or a puff of air) given in QW (Figure 7B). Although the spontaneous single isolated spikes were not associated with any obvious phasic change in the cortical EEG, the spontaneous burst discharge seen during PS was accompanied by a small phasic change in the EEG (Figure 8A), particularly in four W/PS-nonselective and 13 W/PS-selective neurons, all of which exhibited a high frequency burst discharge (peak IMF > 150 Hz) during PS (indicated by arrows in Figure 2E-H). Figure 8B and C show spike-triggered averaging of the cortical EEG, triggered by either the first spike in a burst (indicated by “a” in Figure 8A) or by a single-spike discharge (indicated by “b” in Figure 8A). The bursting discharges occurring during PS were associated with a phasic negative EEG potential (Figure 8B), whereas the single isolated spikes were not (Figure 8C).
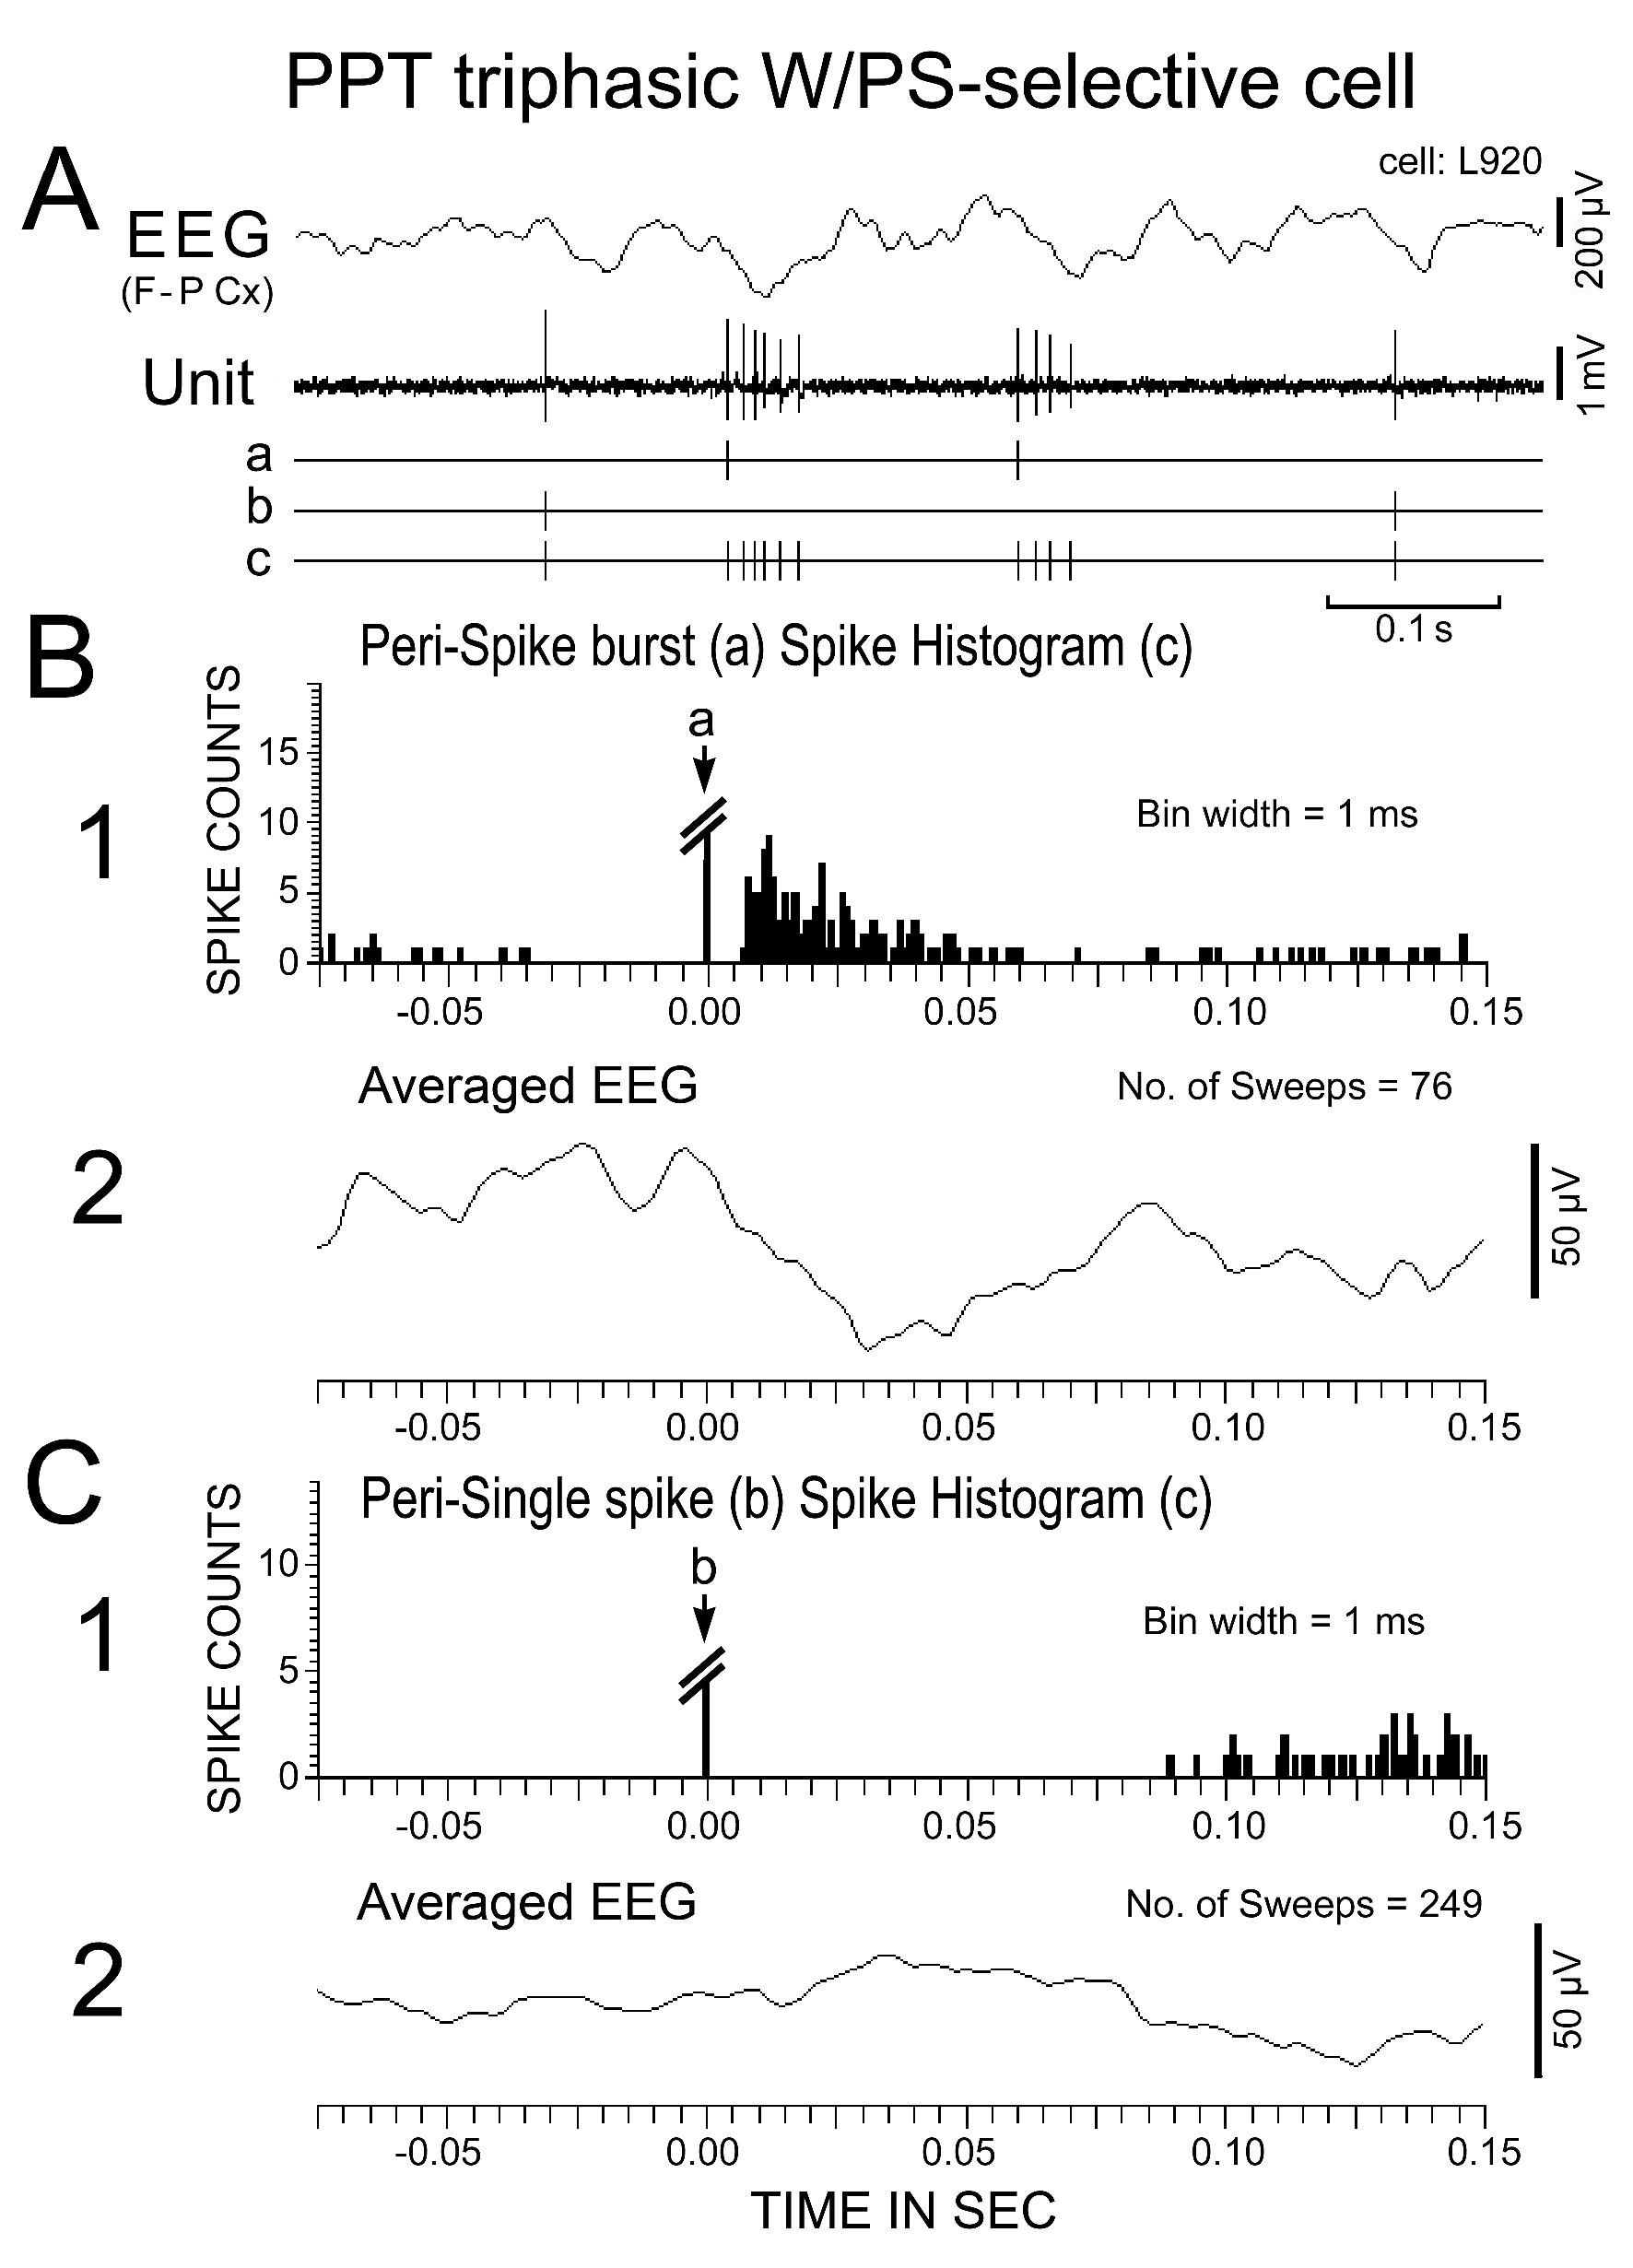
Figure 8. Activity of a triphasic W/PS-selective neuron recorded in the PPT during PS. (A) The spontaneous spike discharges (Unit, shown in “c”) were divided into two classes on the basis of a single isolated discharge (shown in "b") or burst discharges (the first spike within the burst being indicated in "a"). (B and C) Spike-triggered averaging of spike discharges (1) and of the cortical EEG (2) triggered by either the first spike within a burst (B) or a single isolated spike (C) occurring during PS. Note that bursting discharges were associated with a phasic negative EEG potential, whereas single isolated spikes were not.
As seen in Figures 6 and 7, no triphasic W/PS-active neurons discharged strictly in phase with theta waves seen on the cortical EEG during PS. However, when subjected to auto-correlation analysis of spike trains, all triphasic W/PS-active neurons that exhibited burst discharges (peak IMF ≥ 100 Hz) were found to display theta frequency oscillations during PS (Figure 9B-2), while those not exhibiting burst discharges did not (Figure 9B1).
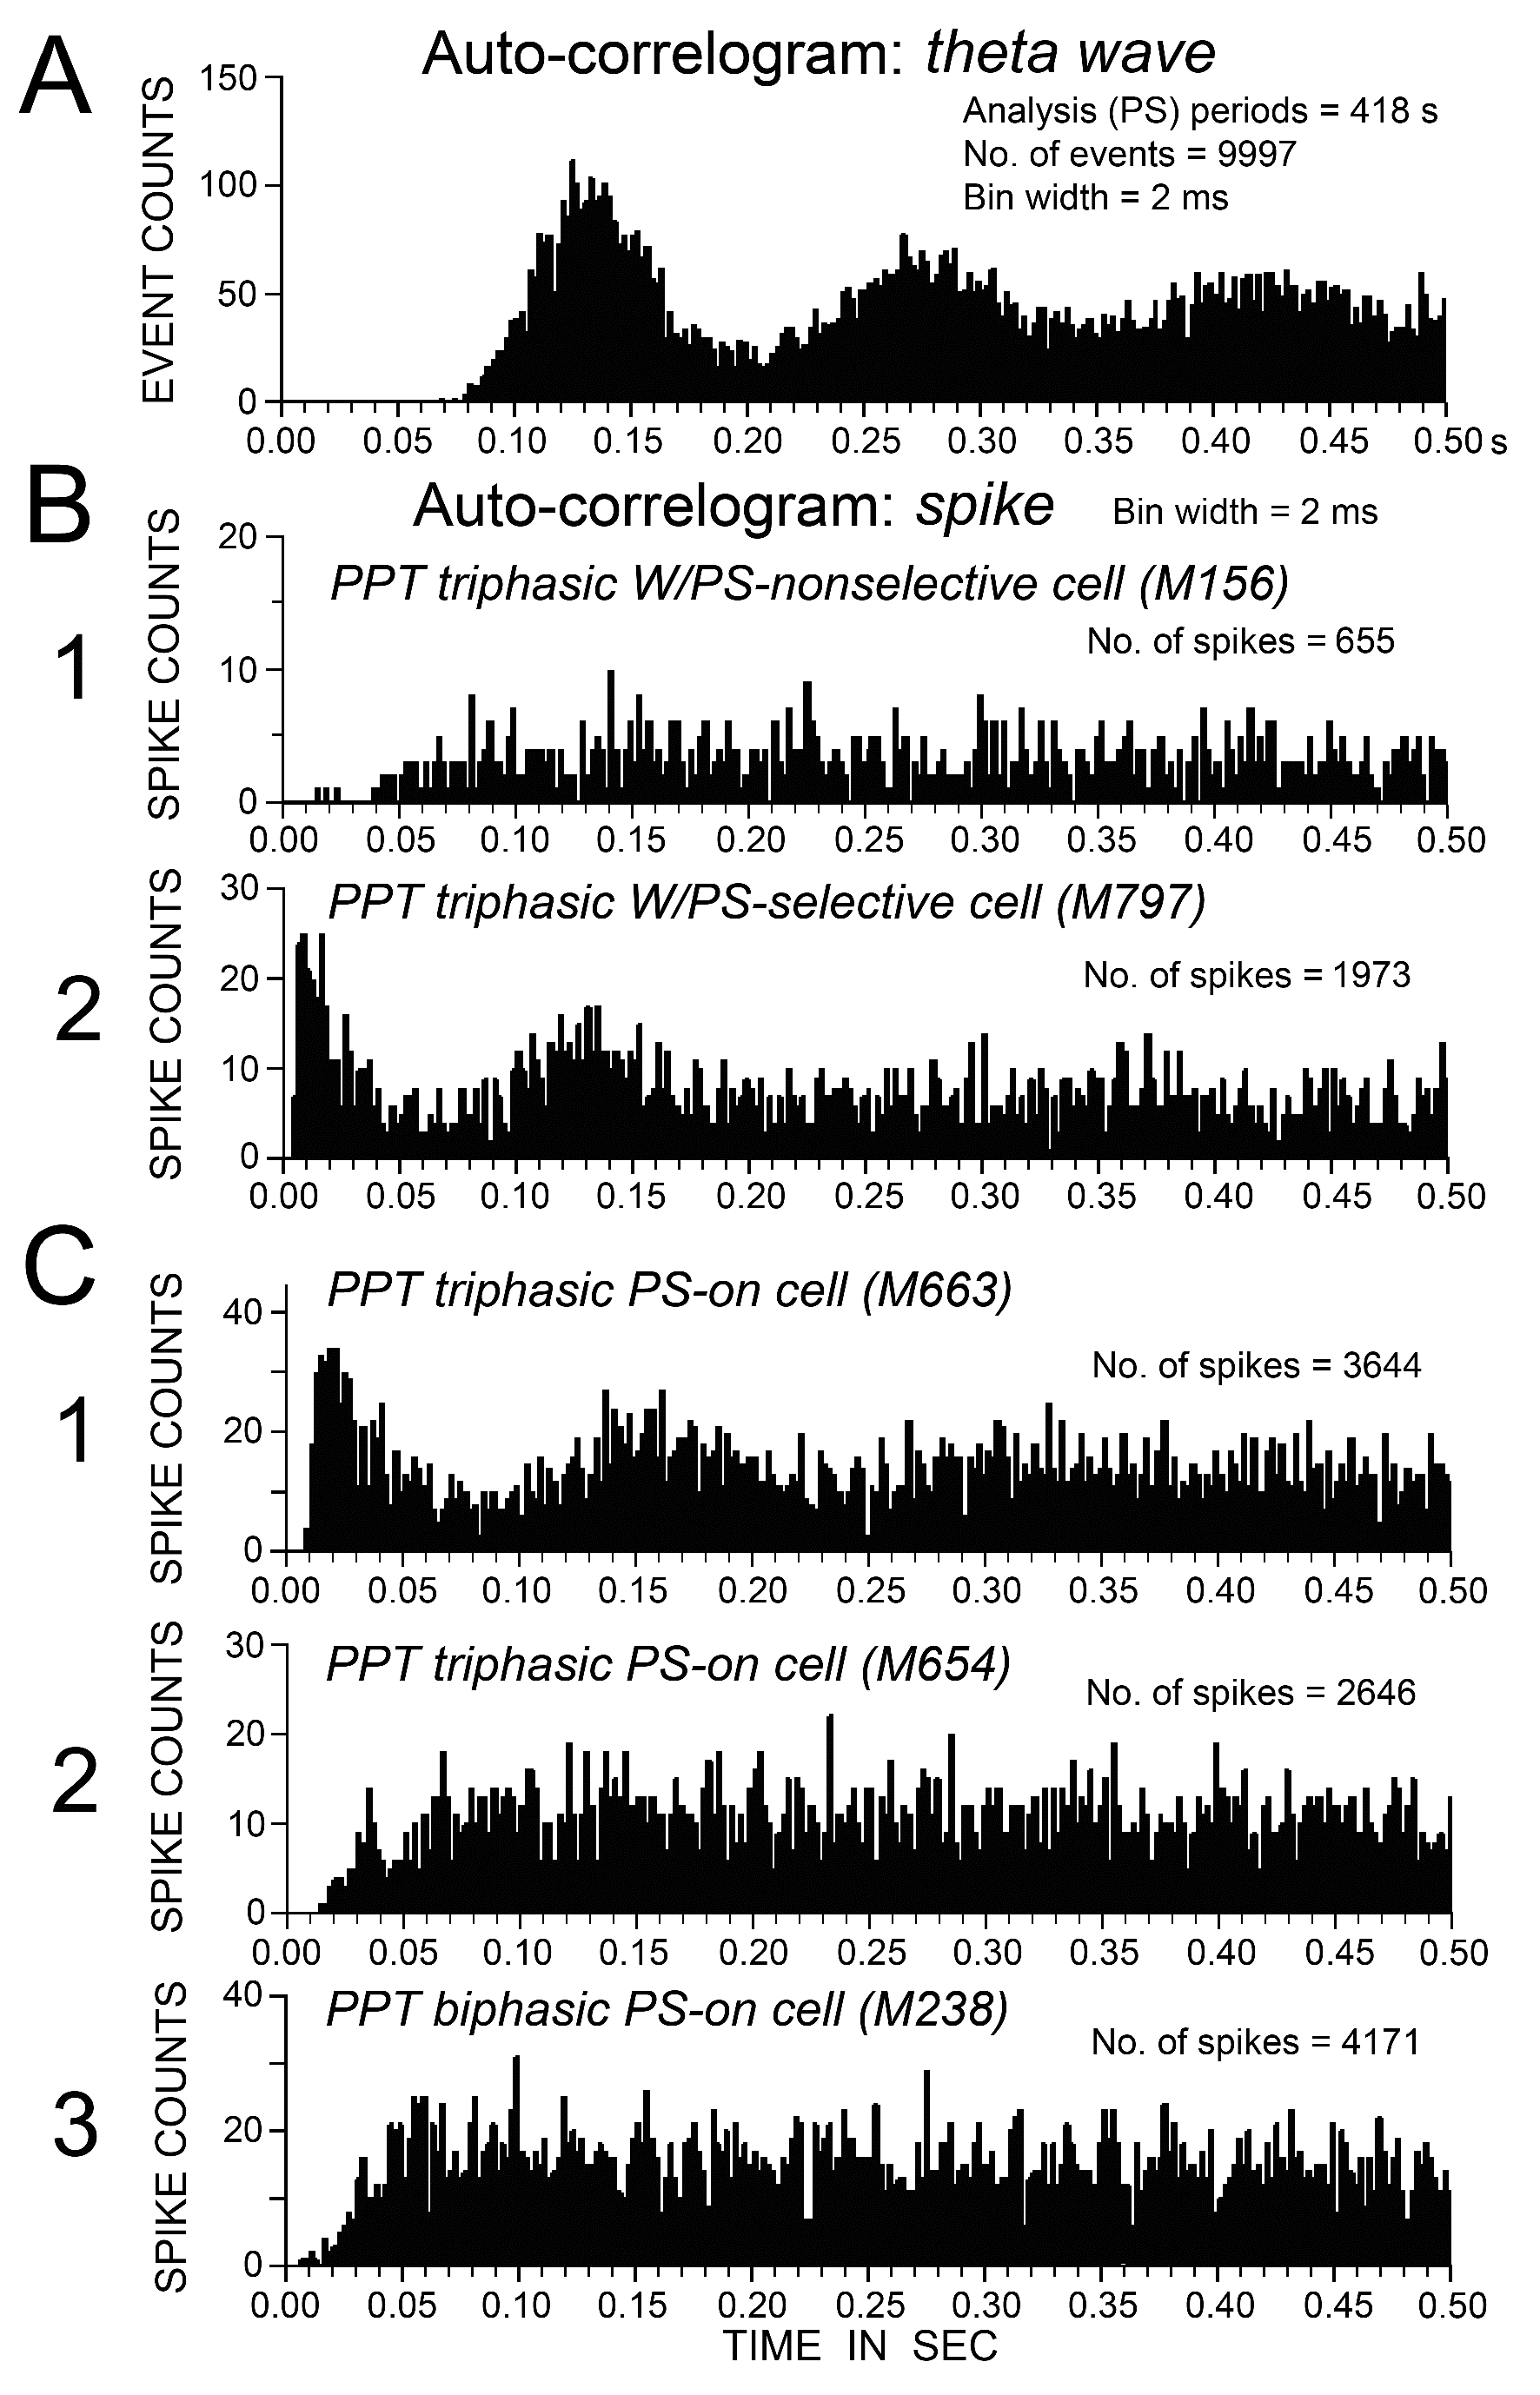
Figure 9. Auto-correlation histograms of theta waves on the cortical EEG (A) and spike trains of five representative PPT neurons (B and C) observed during PS. (B) Auto-correlograms of a triphasic W/PS-nonselective neuron (1) and a W/PS-selective (2) neuron. (C) Auto-correlograms of 2 triphasic PS-on neurons (1, 2) and a biphasic PS-on neuron (3). Note the presence of a peak within the theta frequency range in the auto-correlograms (B2 and C1), and the absence of a peak indicative of theta frequency oscillations in B1 and C2, 3.
Discharge rate and pattern of the biphasic W/PS-active neurons: Both the slow (n = 38) and fast (n = 84) biphasic, presumed non-cholinergic W/PS-active neurons discharged at high rates during AW and at progressively lower rates during QW and subsequent SWS, and displayed a significant increase in discharge rate during PS compared to during SWS (Figure 5C). None of the W/PS-active neurons showed W/PS-selective discharge. Neither the slow nor the fast W/PS-active neurons showed any significant difference in mean discharge rate between AW and PS (P > 0.46; Wilcoxon). The majority of both the slow (24/38; 63.2%) and fast (65/84; 77.4%) W/PS-active neurons displayed a tonic pattern of discharge during both W and PS, while the remainder discharged tonically during W, but phasically during PS. The majority (45/65; 69.2%) of the fast and tonic W/PS-active neurons had a narrow action potential (indicated by red filled circles in Figure 2E-H). The biphasic W/PS-active neurons did not exhibit high frequency burst discharges that were synchronized with rhythmic theta waves or marked by theta frequency oscillations in the auto-correlation during PS.
Characteristics of the PPT PS-active neurons
As shown in Figure 10A, 79 PPT PS-active neurons displayed a gradual increase in discharge rate on going from W to SWS and a further increase on going from SWS to PS. Of the 79 PS-active neurons, 9 (11.4%) displayed a long duration, triphasic action potential and a slow spontaneous firing rate, while the remaining 70 (88.6%) displayed a biphasic action potential and fired either slowly (n = 35; slow) or rapidly (n = 35; fast) (Figure 10A). All 9 triphasic PS-active neurons were PS-on neurons, as described in detail below, while the biphasic PS-active neurons displayed either intermittent (n = 35) or sustained (n = 35) spontaneous discharge patterns during PS, and were classified as, respectively, phasic or tonic PS-active neurons. Twenty-five of the 35 slow biphasic PS-active neurons and 10 of the 35 fast biphasic PS-active neurons were phasic PS-active neurons, the remainder (n = 35) being tonic PS-active neurons. Of the 35 tonic PS-active neurons, 7 were judged to be PS-on neurons, as described below.
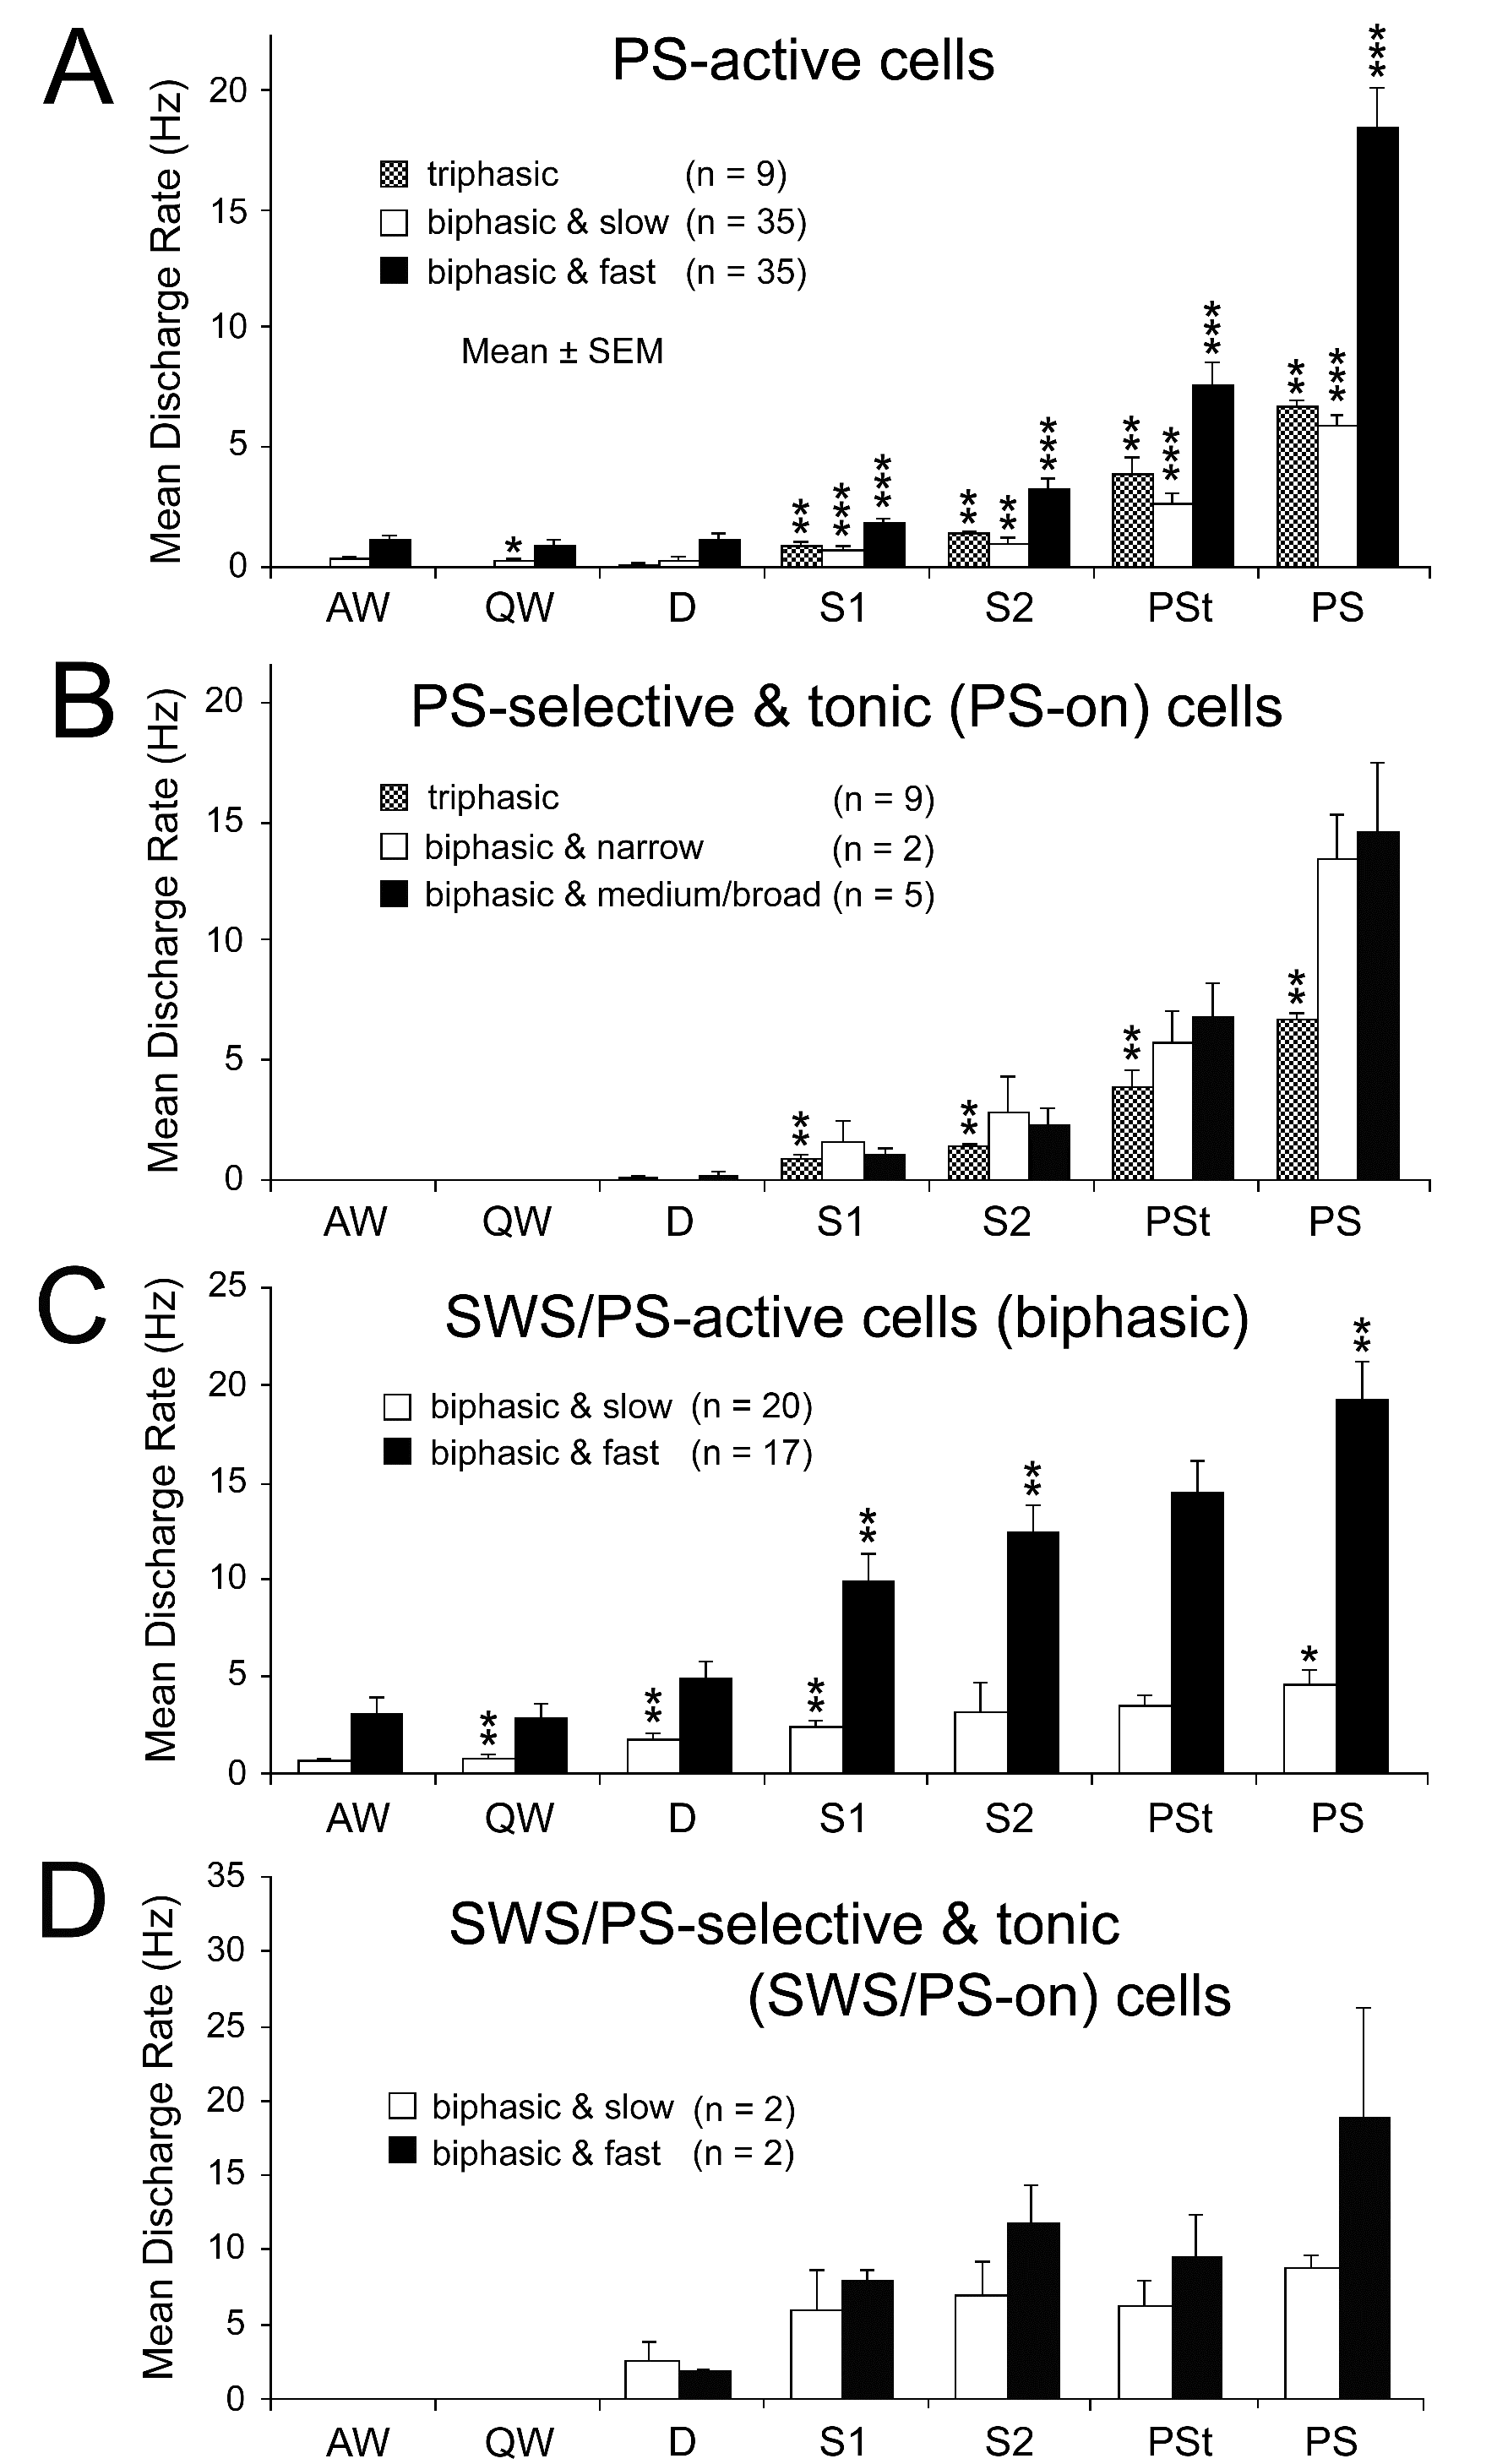
Figure 10. Mean spontaneous discharge rates of PS-active (A and B) and SWS/PS-active (C and D) neurons recorded in the PPT during the sleep-wake cycle. (A) The PS-active neurons were divided into three groups (triphasic, biphasic slow, and biphasic fast) on the basis of their triphasic or biphasic action potential and their low (< 10 Hz) or high (≥10 Hz) spontaneous firing rate. Note that all the triphasic neurons displayed a low spontaneous firing rate. (B) The PS-on neurons were divided into three groups (triphasic, biphasic narrow, and biphasic medium/broad) on the basis of their triphasic or biphasic action potential and their spike duration. Note that all the triphasic PS-on neurons had a broad action potential, while all the biphasic PS-on neurons had either a narrow or medium-to-broad action potential. (C) The SWS/PS-active neurons were divided into two groups (slow and fast) on the basis of their low (< 10 Hz) or high (≥10 Hz) spontaneous firing rate. Note that all SWS/PS-active neurons had a biphasic action potential. (D) The SWS/PS-on neurons were divided into slow and fast groups. The difference in discharge rate across the sleep-wake states was highly statistically significant (P<0.0001, Friedman) for the PS-active and SWS/PS-active neuron groups. A significant difference in discharge rate between two successive states is indicated by asterisks (*P<0.05; **P<0.01, *** P<0.001, Wilcoxon). Statistical analysis was not carried out on neuron groups with a small number (n) of cells (< 6).
Triphasic and biphasic PPT PS-on neurons: Neither the triphasic nor the biphasic PS-on neurons fired during W, but both fired at low rates during both S1 and S2 and displayed a significant increase in discharge rate with the appearance of PSt, in parallel with the beginning of a progressive increase in HR and a progressive decrease in neck muscle tone (Figures 11, 12, and 14). They maintained sustained tonic discharge throughout a PS episode and stopped firing before the end of PS, characterized by both the interruption of rhythmic theta activity and a marked fall in HR (Figures 11 and 12). All PS-on neurons showed tonic discharge during PS in close relation to the changes in theta waves and HR, with the discharge rate increasing or decreasing in parallel with the increase or decrease in frequency of theta waves and HR. Five of the 9 triphasic PS-on neurons discharged either as single isolated spikes or clusters (IMF < 50Hz; Figure 11), while the remaining 4 also discharged as bursts (IMF > 120 Hz; Figure 12) accompanied by an increased frequency of theta waves and HR. As shown in Figure 12, one of the 9 triphasic PS-on neurons fired as single isolated spikes during SWS and subsequent PSt, but fired in bursts with high frequency rhythmic discharges during the PS episode characterized by high frequency rhythmic theta activity. All of the biphasic PS-on neurons discharged as single isolated spikes, clusters, or bursts (IMF < 180 Hz). Although the triphasic bursting PS-on neurons did not discharge strictly in phase with rhythmic theta waves (Figure 13), the spike activity showed theta frequency oscillations during PS, as seen in the auto-correlation of spike trains (Figure 9C-1). Neither the non-bursting triphasic PS-on neurons (Figure 9C-2) nor the biphasic PS-on neurons (Figure 9C-3) showed any theta frequency oscillations during PS.
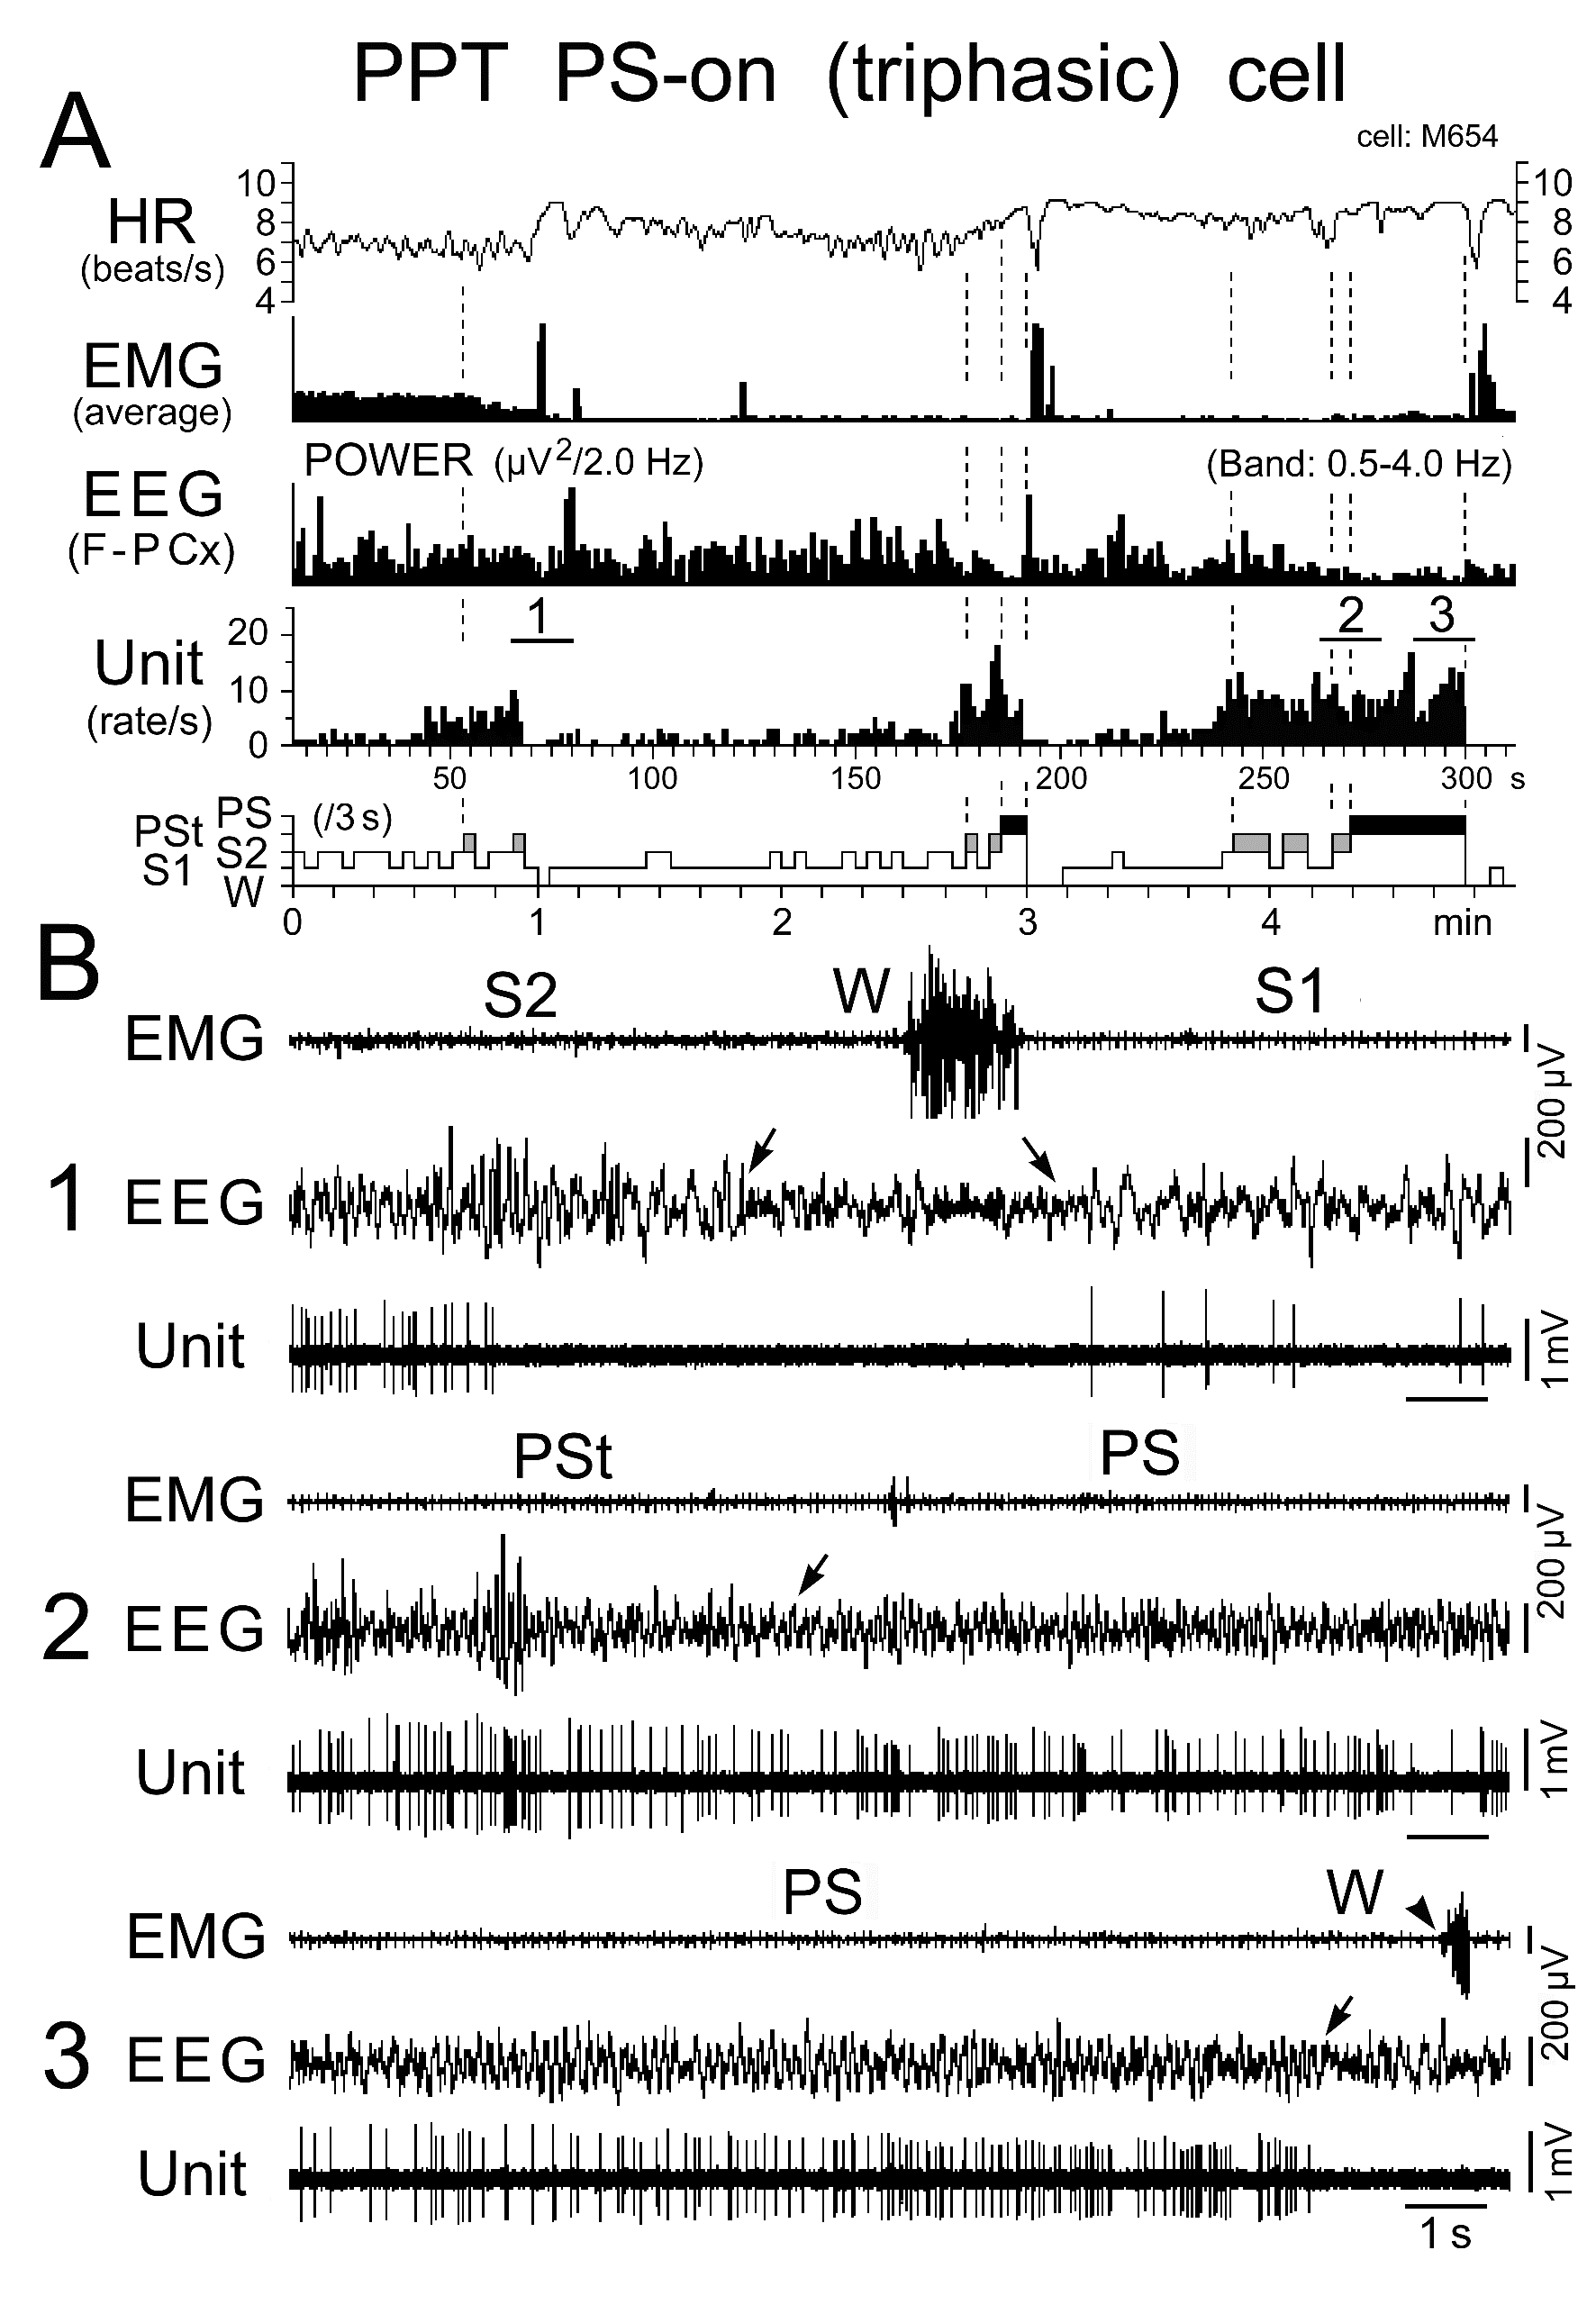
Figure 11. Activity of a representative triphasic PS-on neuron recorded in the PPT during the sleep-wake cycle. The three traces in (B) are from the periods indicated by the bars labeled "1", "2", and "3" in (A). The arrows indicate state transitions, while the arrowhead indicates the return of EMG activity at the PS to W transition. Note the cessation of discharge either long before the onset of W at the transition from SWS (B1) or just before the onset of W at the transition from PS (B3). Note that the neuron discharged either as single isolated spikes or clusters, but not as bursts. The dotted lines in (A) indicate the state transitions from SWS to PST, PSt to PS, and PS to W.
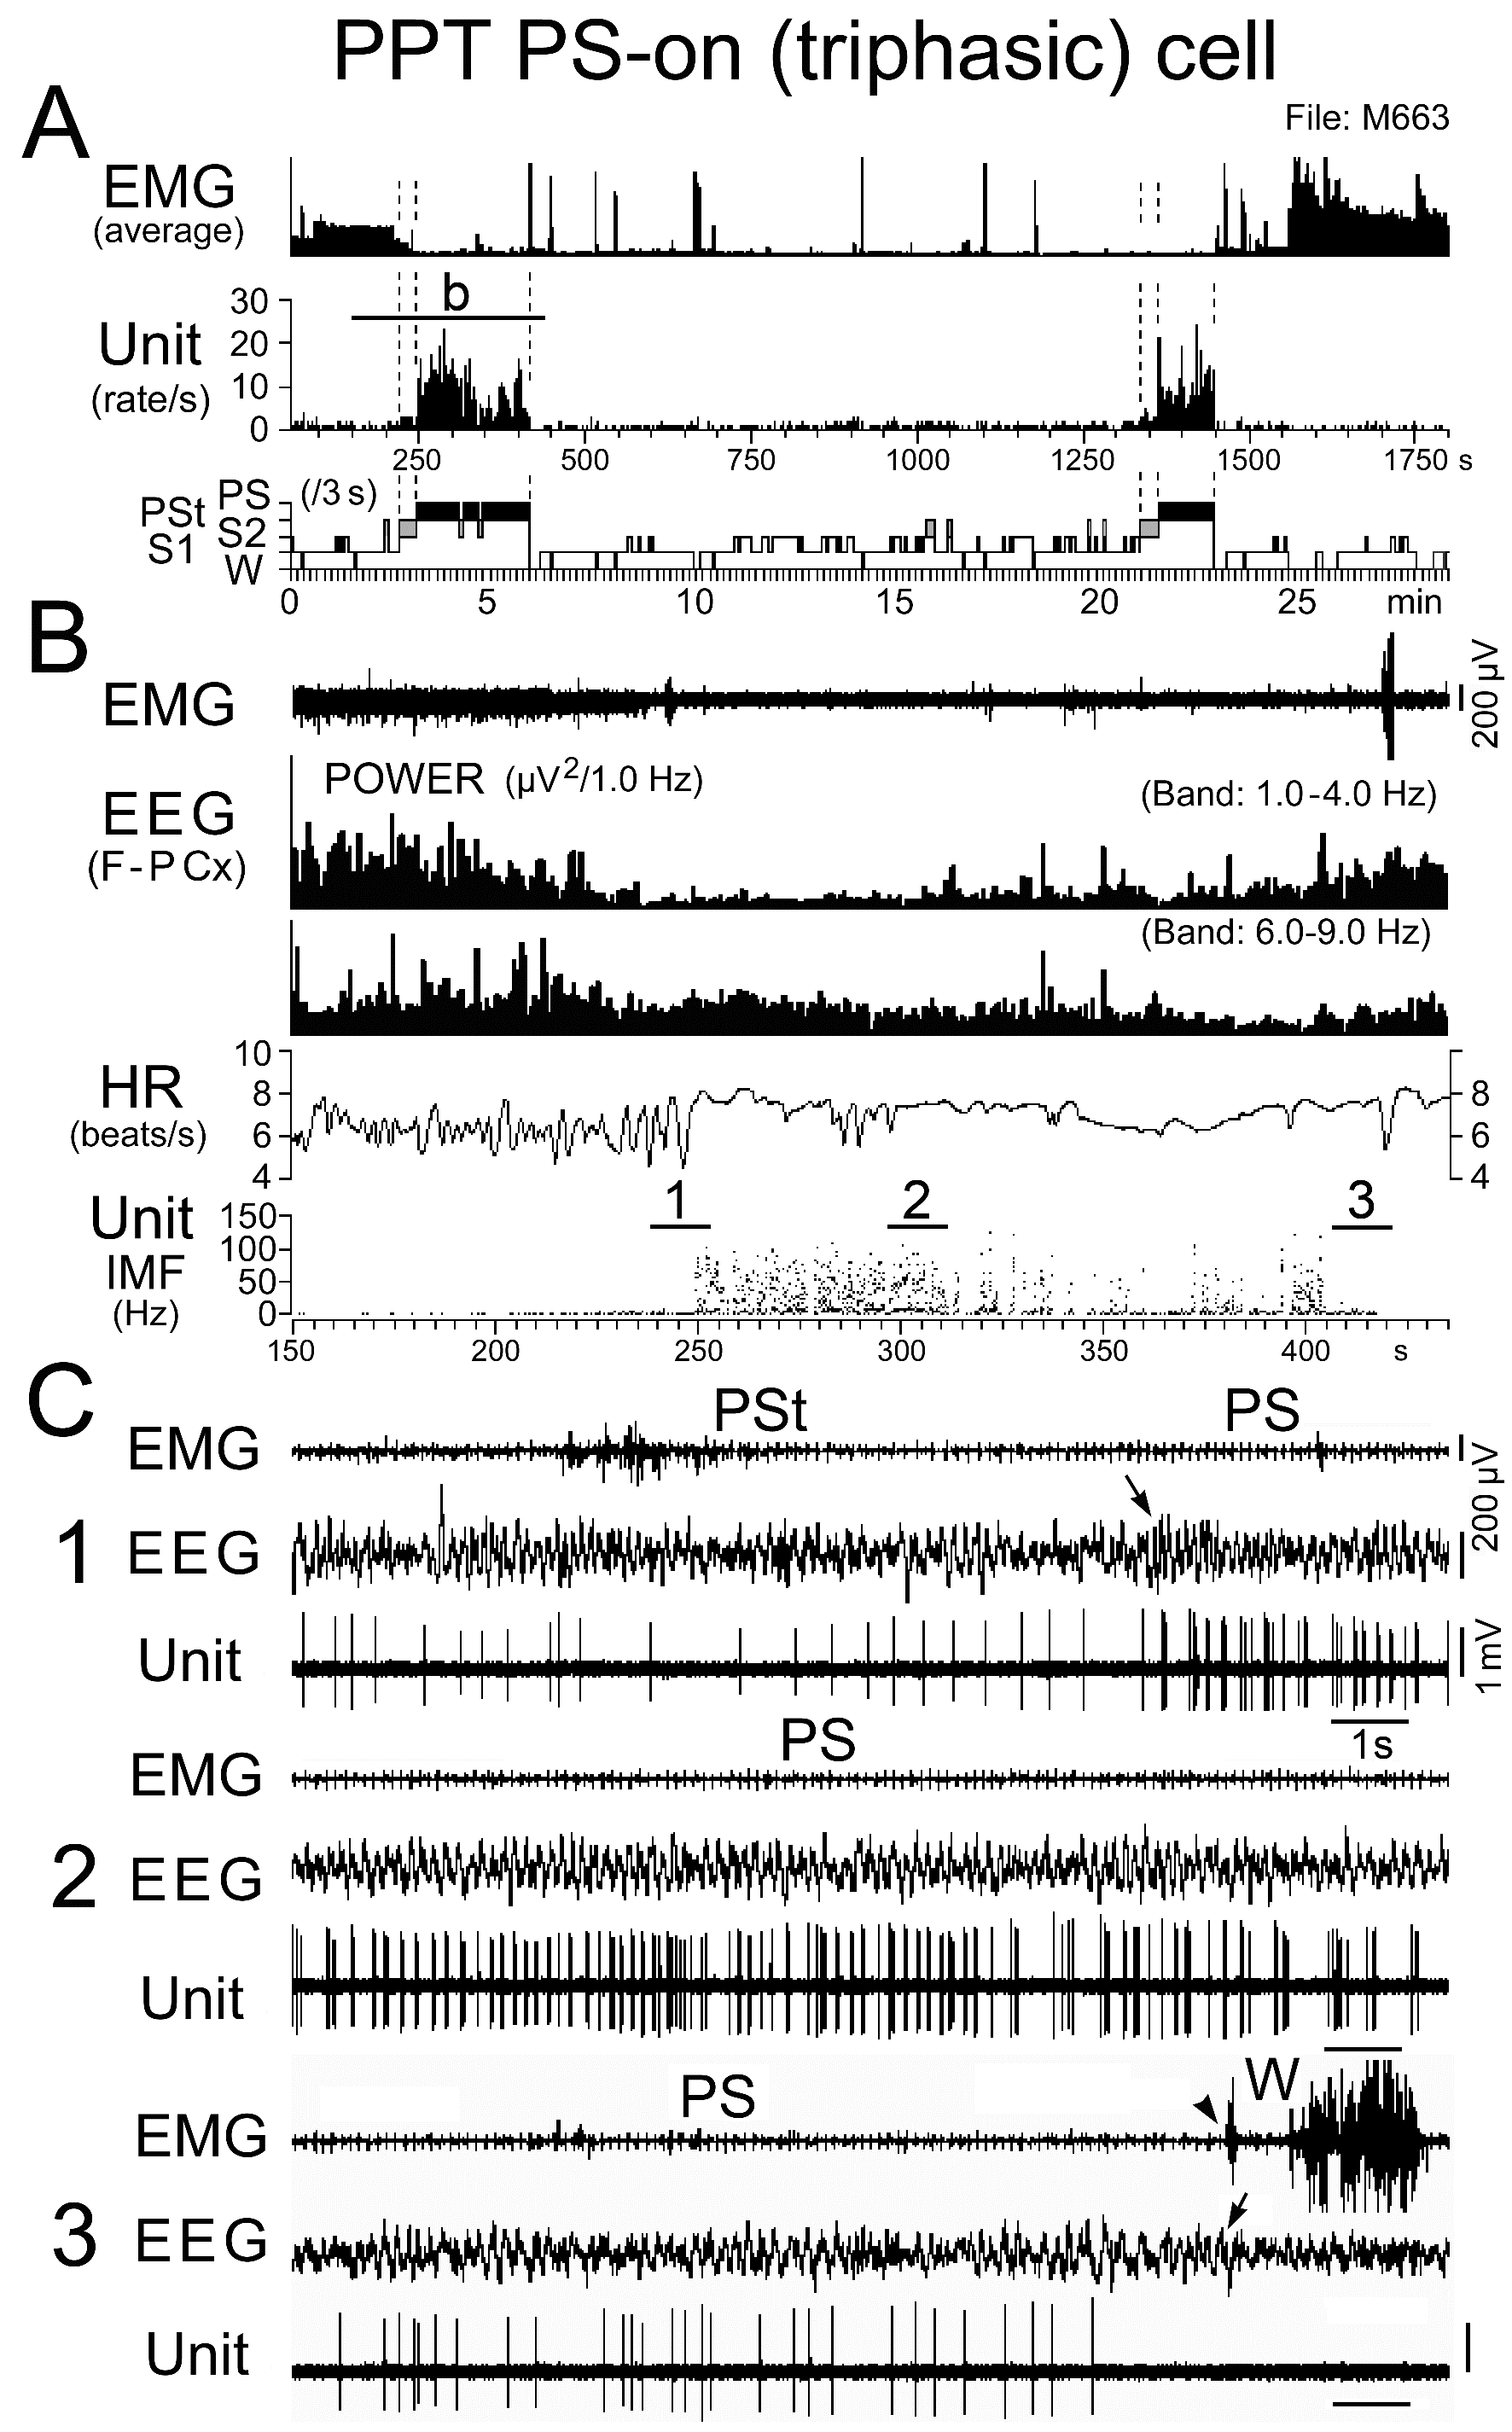
Figure 12. Activity of a representative triphasic PS-on neuron discharging as bursts during PS. The traces in (B) are from the period indicated by the bar labeled “b” in (A), while the three traces in (C) are from the periods indicated by the bars labeled "1", "2", and "3" in (B). The arrows indicate state transitions, while the arrowhead indicates the recovery of EMG activity at the PS to W transition. Note that this PS-on neuron discharged as rhythmic high frequency bursts during the PS episode with high frequency theta waves, but otherwise discharged as single isolated spikes, and that a cessation or marked decrease in spontaneous firing rate was accompanied by disruption of rhythmic theta activity. The dotted lines in (A) indicate the onset of PSt and PS and the end of PS.
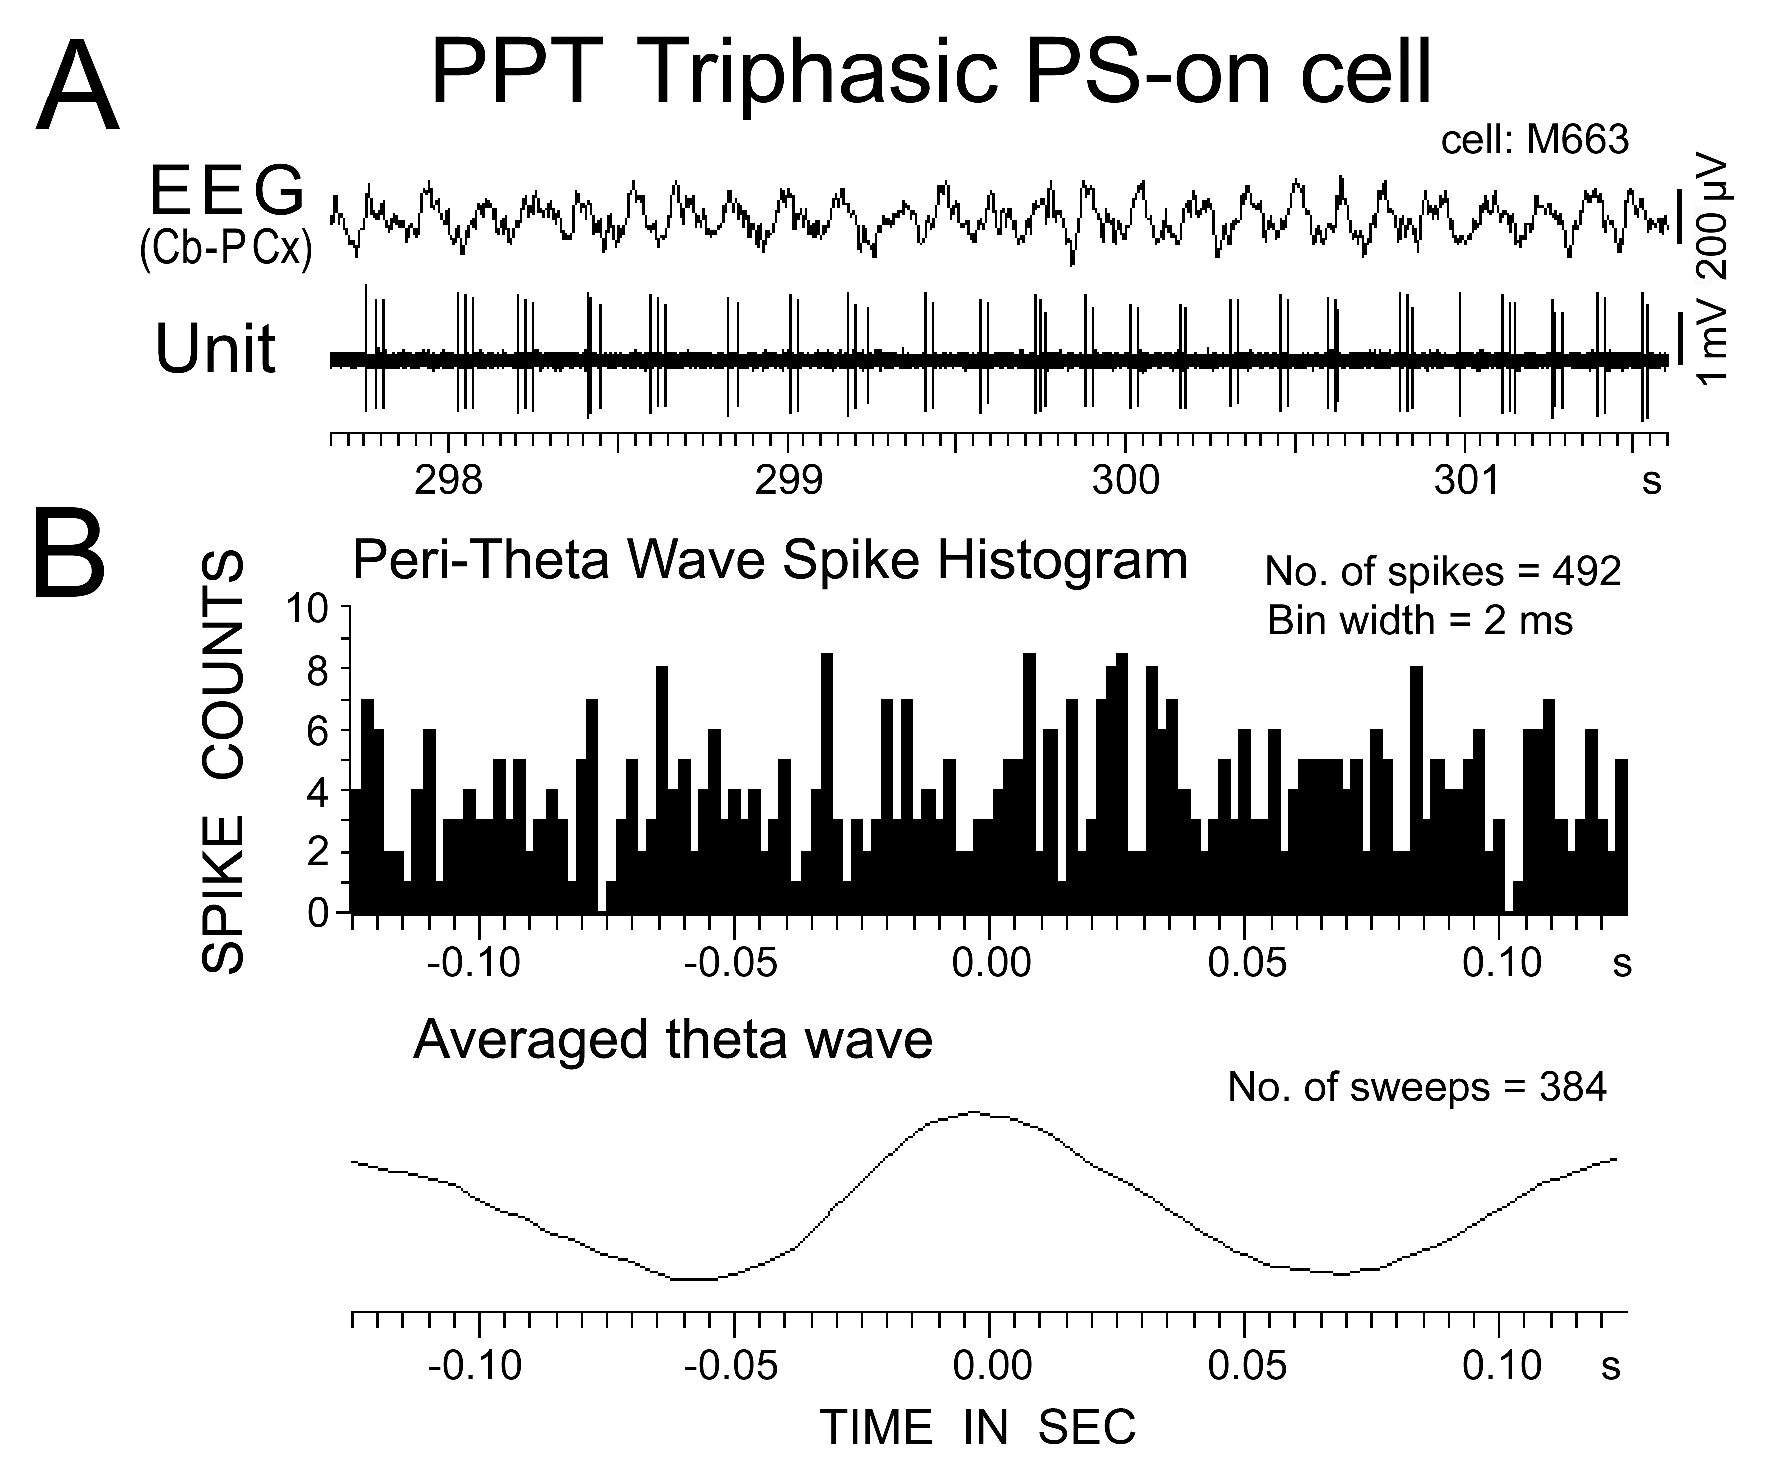
Figure 13. Activity of a PPT triphasic PS-on neuron in relation to theta waves recorded on the cortical EEG during PS. The peri-theta wave spike histogram and associated averaged theta wave are shown in (B). 0 indicates the peak of the theta waves, as seen in the averaged theta wave. Note the absence of a robust correlation between the spike discharges and theta waves.
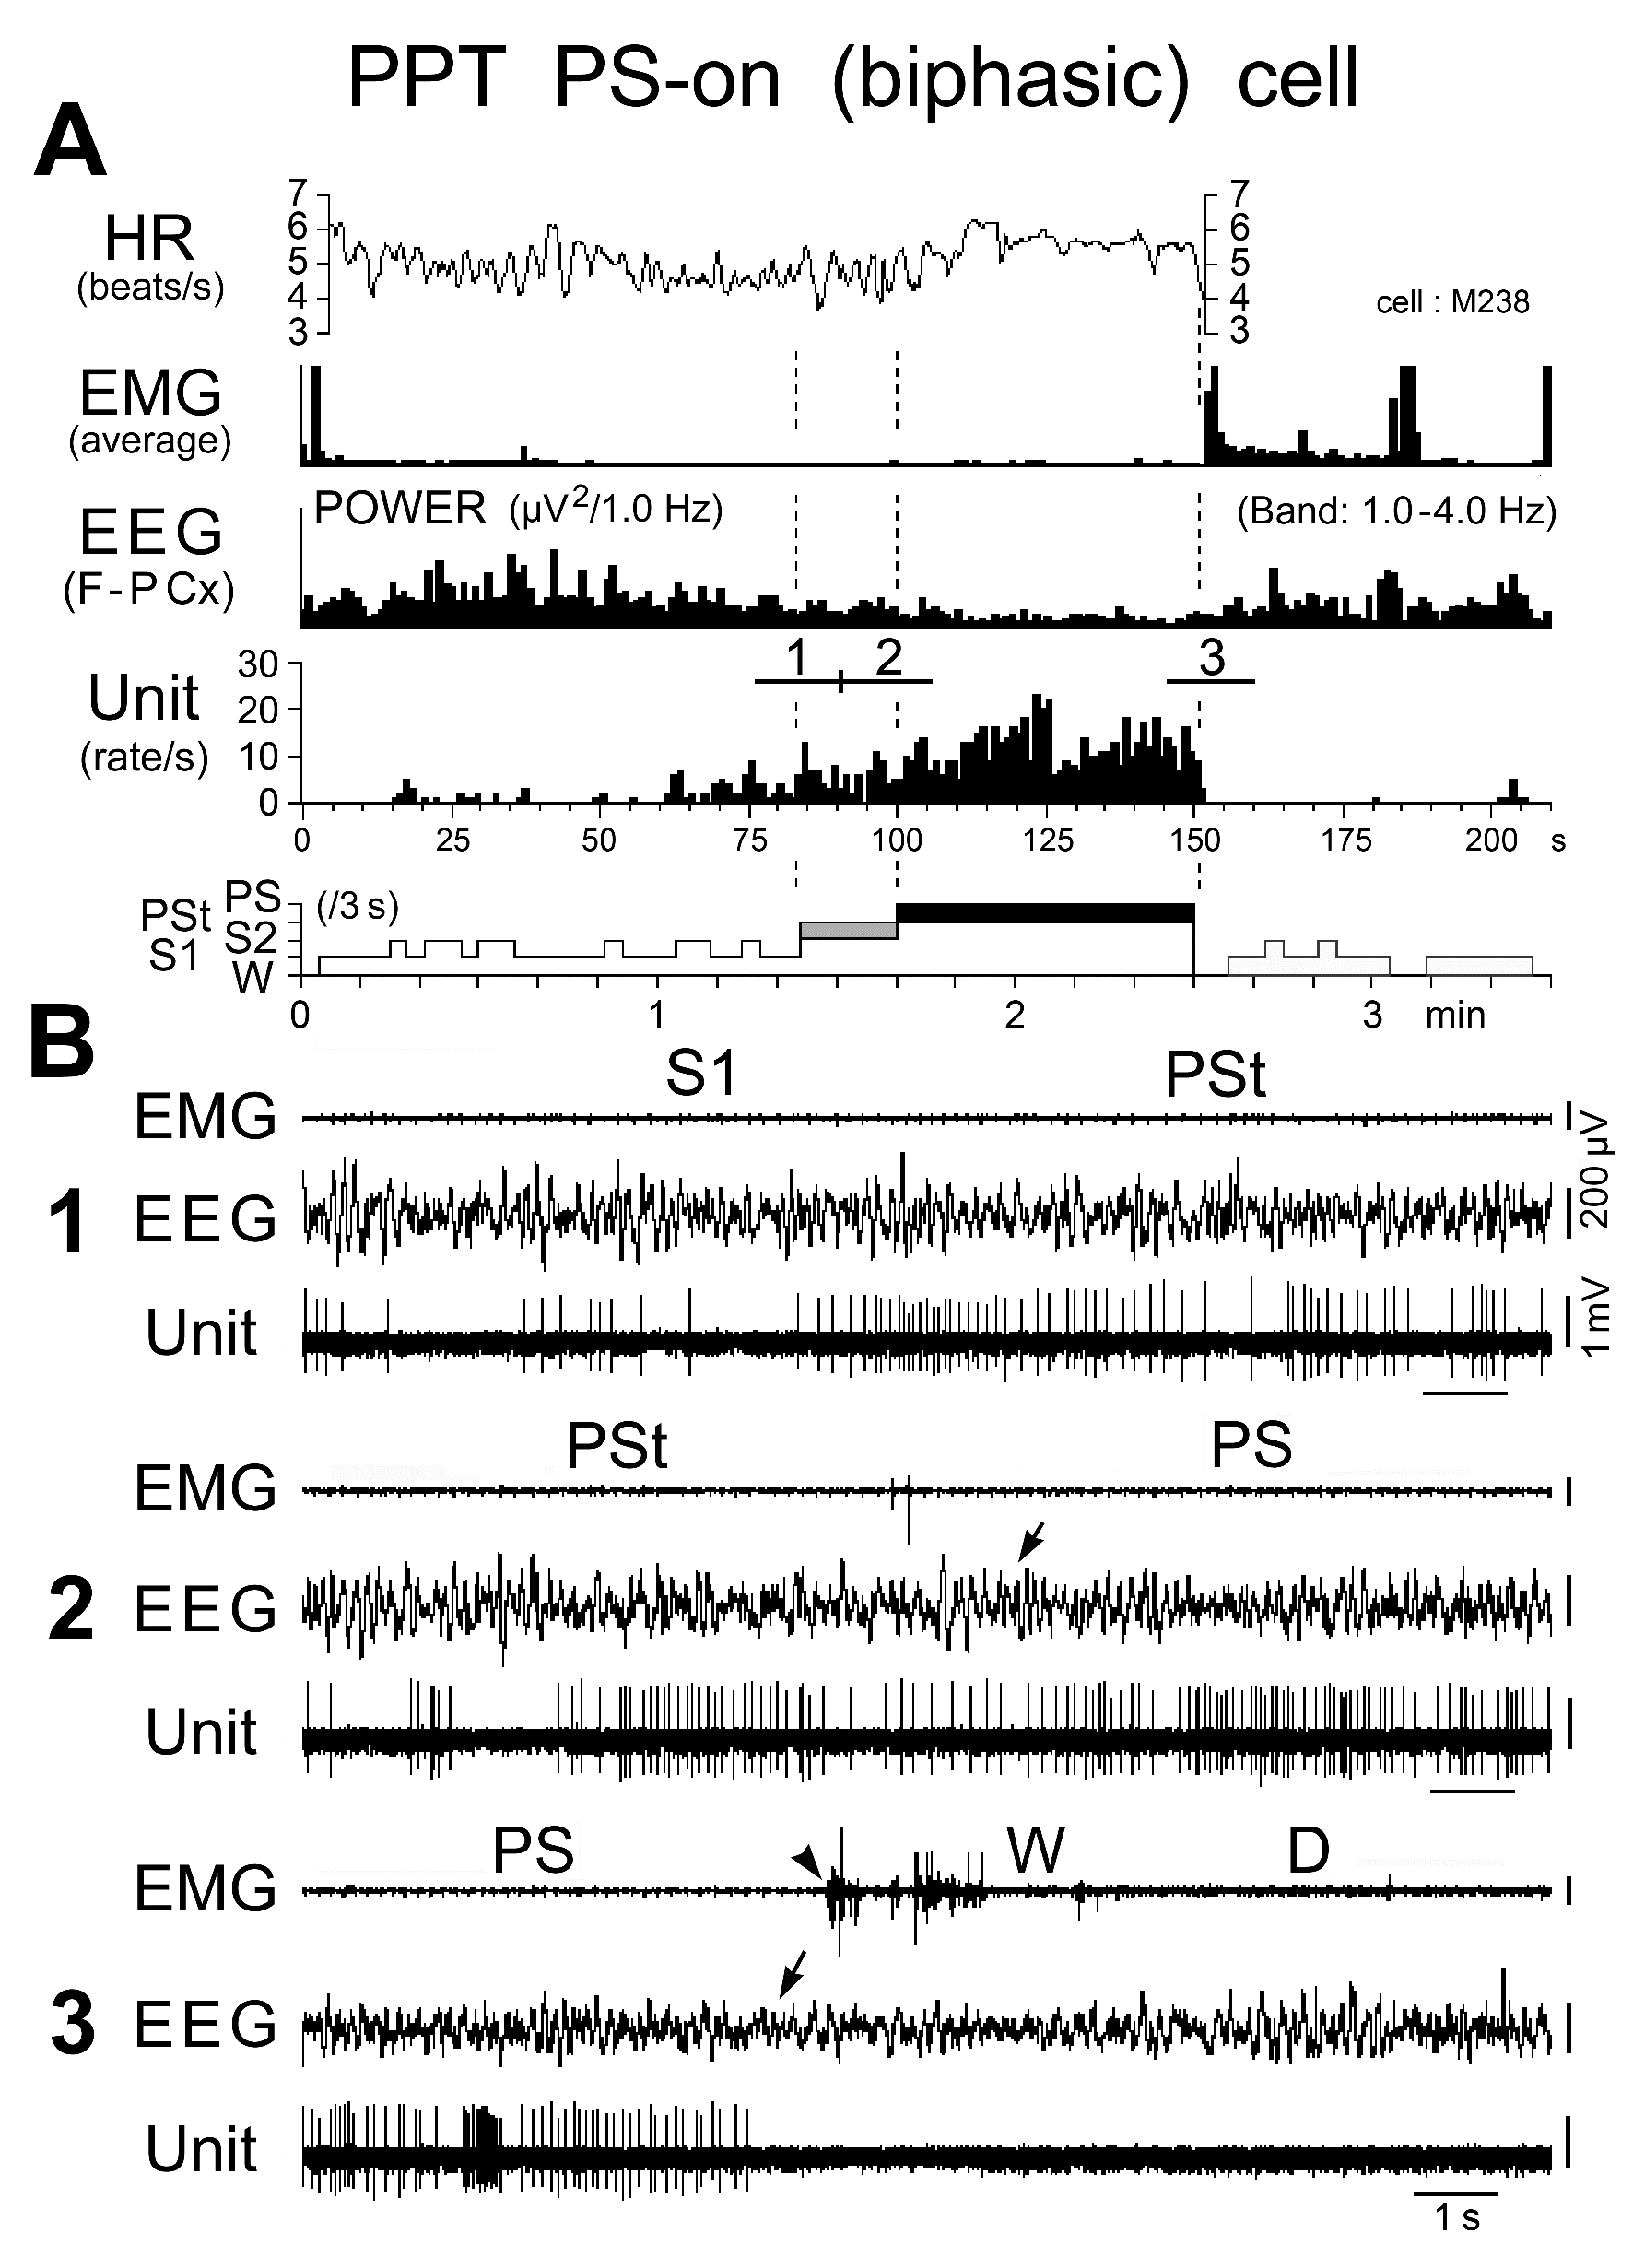
Figure 14. Activity of a biphasic PPT PS-on neuron during the sleep-wake cycle. The three traces in (B) are from the periods indicated by the bars labeled "1", "2", and "3" in (A). The dotted lines in (A) indicate the state transitions from SWS to PSt, PSt to PS, and PS to W. The arrows on the EEG indicate the state transitions, while the arrowhead on the EMG indicates the return of EMG activity at the transition from PS to W. Note that the PS-on neuron discharged tonically at high rates in parallel with a progressive increase in HR and a progressive decrease in EEG delta power. The neuron maintained sustained tonic discharge throughout the PS episode, characterized by low EEG delta power, sustained theta wave activity, elevated HR, and low muscle tone, and stopped firing before the end of PS, characterized by the interruption of rhythmic theta activity and a marked fall in HR, which was followed by recurrence of EMG activity.
Characteristics of the PPT SWS/PS-active neurons
Of the 116 sleep-active neurons, 37 (11.0%) were classified as SWS/PS-active. All of the SWS/PS-active neurons displayed a biphasic action potential of variable duration and either a slow (n = 20) or a fast (n = 17) firing rate (Figure 2I-L, nonfilled circles, triangles, or stars). The biphasic SWS/PS-active neurons discharged as single isolated spikes, clusters, or bursts, and exhibited either intermittent, phasic (n = 17) or sustained, tonic (n = 20) spontaneous discharge patterns during PS. As shown in Figure 10C, both the slow and fast SWS/PS-active neurons displayed a gradual and significant increase in spontaneous discharge rate on going from W to S2 and a further significant increase on going from S2 to PS, but no significant change on going from S2 to PSt. Only 2 of the 20 slow and 2 of the 17 fast SWS/PS-active neurons were judged to be SWS/PS-on neurons, characterized by no discharge activity during W and a high rate of tonic discharge during both SWS and PS (Figure 2J and L, nonfilled stars, and Figure 10D).
Trends in spike activity of the PPT triphasic W/PS-selective and triphasic and biphasic PS-on neurons during sleep-wake state transitions
Trends in spike activity during spontaneous sleep-wake transitions were examined in detail in the triphasic W/PS-selective neurons and both the triphasic and biphasic PS-on neurons. For smoothing purposes, the three-point moving-average technique was used. Figure 15 illustrates the trends in spike activity on going from W to SWS (A), SWS to W (B), PS to W (C), or PSt to PS (D), as estimated using 0.1 s bins from 5 s before to 5 s after all the state transitions. The start point (indicated by 0 and dotted lines in Figure 15) of the analysis was the onset of EEG activation (desynchronization) or deactivation (synchronization) (Figure 15A and B) or the end or onset of continuous rhythmic theta activity (Figure 15C and D). Spontaneous transitions from SWS to W either with or without sudden EMG activation were combined for the analysis. In order to determine when spontaneous discharge activity changed significantly at the state transitions, the statistical significance of the difference was examined between the reference discharge rate over the 1.0-s period from 5 to 4 s before the onset of each state transition (Figure 15, indicated by “ref”) and the discharge rate of (i) the triphasic W/PS-selective neurons going from W to SWS (Figure 15A), (ii) the triphasic and biphasic PS-on neurons going from SWS to W (Figure 15B), (iii) the W/PS-selective and PS-on neurons going from PS to W (Figure 15C), and (iv) the W/PS-selective and PS-on neurons going from PSt to PS (Figure 15D). As shown in Figure 15A, at the transition from W to SWS, the W/PS-selective neurons showed a significant decrease in firing rate > 0.7 s prior to the onset of EEG synchronization, while both the triphasic and biphasic PS-on neurons showed a gradual increase in firing rate after onset of EEG synchronization, with a latency > 1.1 s. As shown in Figure 15B, at the SWS to W transition, the triphasic W/PS-selective neurons displayed a gradual increase in discharge rate > 2.0 s prior to the onset of W (EEG activation), while the triphasic PS-on neurons and biphasic PS-on neurons ceased firing, respectively, > 0.3 s and > 0.1 s before onset of W. As shown in Figure 15C, at the transition from PS to W and in contrast to the transition from SWS to W, the W/PS-selective neurons showed a significant decrease in firing rate > 1.0 s prior to the end of PS, discharged at the lowest rate during the transition, and showed a significant increase in discharge rate approximately 1.0 s after the onset of W (Figure 7B3). At this transition, the biphasic PS-on neurons, then the triphasic PS-on neurons, ceased firing completely just before the end of PS. As shown in Figure 15D, at the transition from PSt to PS, a gradual increase in discharge rate was seen in all W/PS-selective and PS-on neurons, the W/PS-selective neurons being the first to display a significant increase.
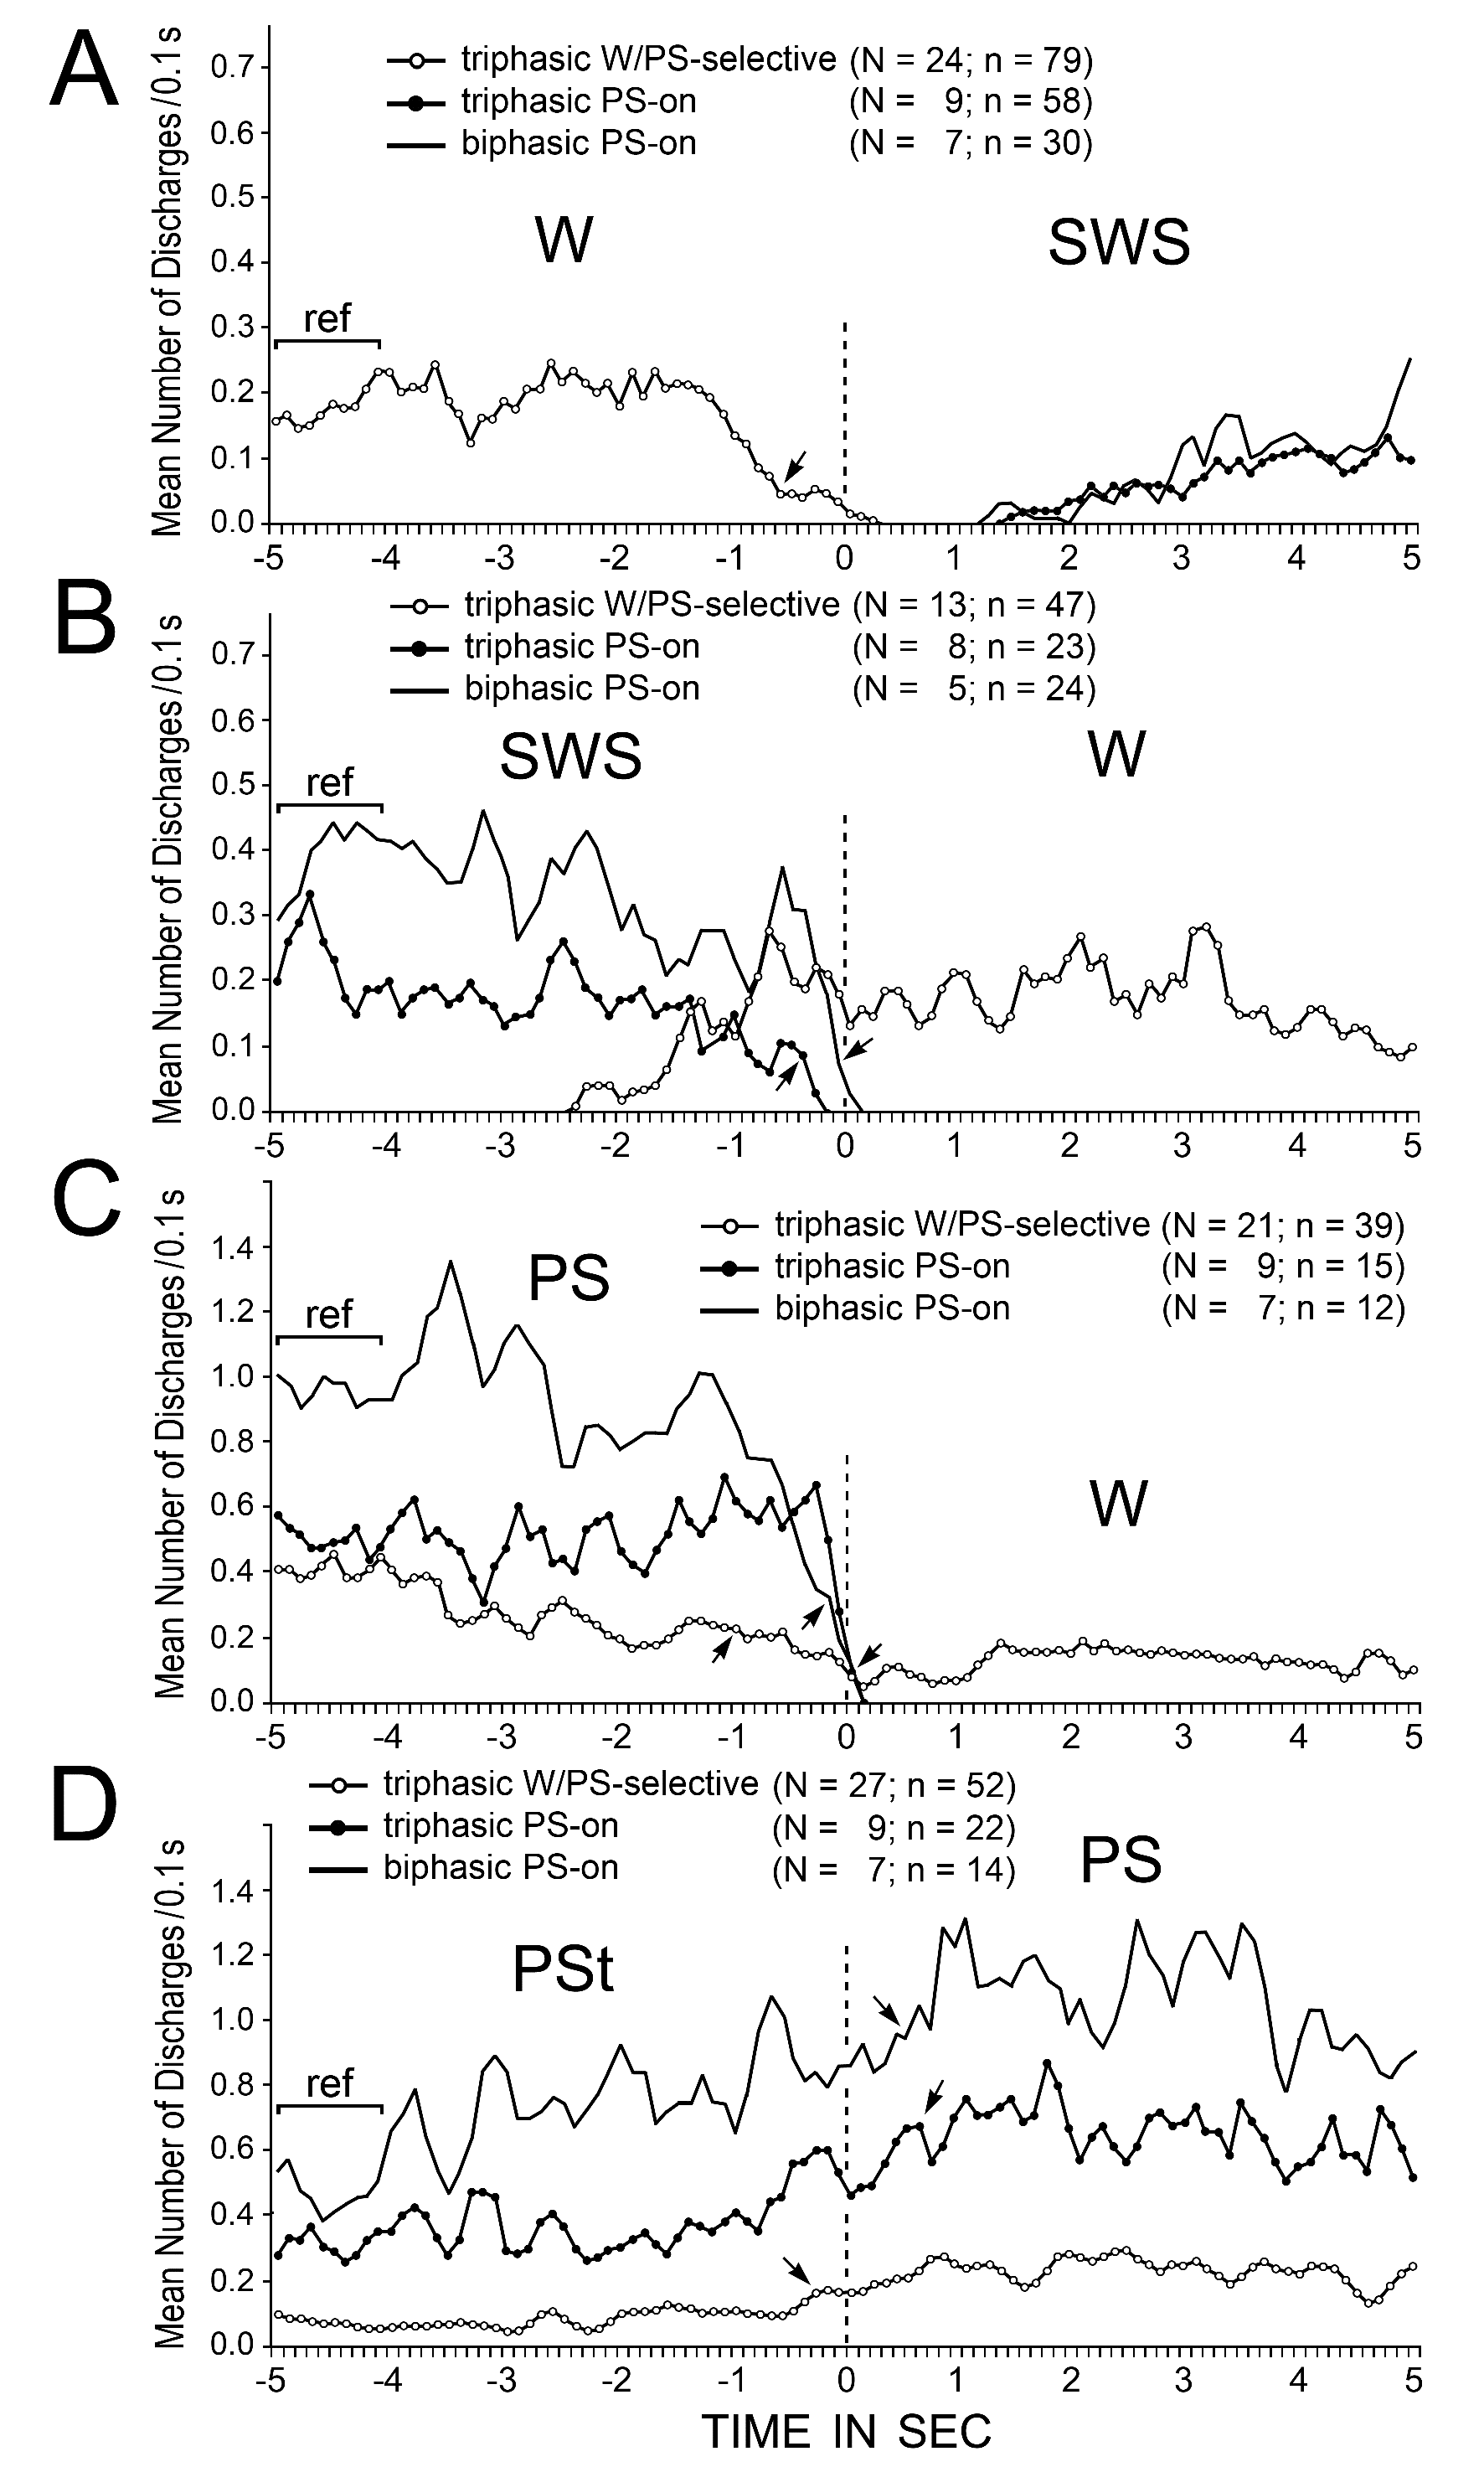
Figure 15. Trends in the discharge rates of triphasic W/PS-selective, triphasic PS-on, and biphasic PS-on neurons recorded in the PPT at the spontaneous transitions from W to SWS (A), SWS to W (B), PS to W (C), and PSt to PS (D). W/PS-selective, triphasic PS-on, and biphasic PS-on neurons are shown, respectively, by lines with white dots, lines with black dots, and lines with no dots. The pooled mean frequency was obtained using 0.1-s bins, and smoothed using the three-points moving average technique. The numbers of neurons (N) and transitions (n) used for this analysis are shown for each group. 0 and dotted lines indicate onset of SWS (A), W (B and C), or PS (D). The statistical significance of the difference between (i) the reference discharge rate obtained over the 1.0-s period of W (A), SWS (B), PS (C), or PSt (D) from 5 to 4 sec before the onset of the state transition and (ii) the discharge rate going from W to SWS (A), SWS to W (B), PS to W (C), or PSt to PS (D) was examined; the arrows indicate the first point at which a statistically significant decrease in firing rate compared to the reference point was seen at all subsequent points (Mann-Whitney).
Neurochemical phenotypes of mouse PPT neurons
Previous anatomical studies in the rat have demonstrated that the LDT, SubLDT, and PPT all contain distinct populations of cholinergic, glutamatergic, and GABAergic neurons [18,29]. As shown in this and my previous studies in mice [13,14], all the LDT, SubLDT, and PPT neurons could be divided into three groups on the basis of differences in spike form and duration: 1) those having a triphasic, broad action potential, 2) those having a biphasic, narrow action potential, and 3) those having a biphasic, medium-to-broad action potential (see Figs. 3 and 4). Using a juxtacellular recording and Nb labeling technique in anesthetized, head-fixed mice, I showed, in this study, that the PPT neurons displaying a triphasic, broad action potential were ChAT-ir, whereas those displaying a biphasic action potential with variable duration were not, indicating that they are, respectively, cholinergic and non-cholinergic, in agreement with the findings in my previous study on mouse LDT and SubLDT neurons [13]. I also previously reported that in mice, all reticular thalamic neurons have a narrow action potential, while all anterior thalamic relay neurons have a medium-to-broad action potential [14]. Since the reticular thalamic nucleus and adjacent anterior thalamic nuclei in rodents consist, respectively, of GABAergic and glutamatergic neurons [31,33], it seems very likely that the LDT, SubLDT, and PPT neurons characterized by a biphasic short duration action potential are GABAergic, while those characterized by a biphasic medium-to-long duration action potential are glutamatergic. In line with this assumption, using juxtacellular labeling methods in rats, Boucetta et al. [19] recently reported that all identified GABAergic cells had a narrow action potential. Taken together, these findings strongly suggest the possibility of identifying cholinergic, GABAergic, or glutamatergic PPT neurons based on the waveform and duration of the action potential, but only if an adequate low-frequency cutoff and sampling rate are used [14]. The triphasic and biphasic PPT neurons will hereafter be referred to as, respectively, “cholinergic” and “non-cholinergic” PPT neurons.
Boucetta et al. [19] reported that the 6 identified cholinergic neurons recorded in the LDT, SubLDT, and PPT, displayed an exclusively W/PS-active discharge profile, while the 9 GABAergic and 18 possibly glutamatergic neurons displayed W/PS-active, PS-active, or W-active discharge profiles. The W/PS-active and PS-active discharge profiles of GABAergic and possibly glutamatergic neurons have also been reported in the rat basal forebrain [33]. In the present study involving a large number (n = 335) of single unit recordings, the mouse PPT was found to contain three types of cholinergic neurons, i.e. W/PS-nonselective, W/PS-selective, and PS-on neurons. In addition, both the presumed GABAergic or glutamatergic PPT neurons were found to display W-active, W/PS-active, SWS/PS-active, PS-active, or state-indifferent discharge profiles, as seen previously with mouse LDT and SubLDT biphasic neurons [13,14]. These findings indicate that all the cholinergic, GABAergic, and glutamatergic PPT neuronal populations are composed of a heterogeneous group of neurons, each of which may play different roles in behavioral state control and the sleep-wake switch. Findings on the role of PPT neurons in behavioral states obtained by selective genetic activation of cholinergic, GABAergic, or glutamatergic mesopontine tegmental neurons should therefore be interpreted with caution, as discussed below.
Roles of cholinergic PPT neurons in the control of the arousal and sleep-wake switch
Previous single-unit recording studies in non-anesthetized cats and rats reported that activity of mesopontine cholinergic neurons is linked to arousal and cortical activation occurring during W and PS via their ascending projections to the thalamus and/or hypothalamus [34-38]. In the cat, those showing slow tonic, single-spike discharge during both W and PS (referred to as “type I-S”) [34] and those showing single-spike activity during W, but burst activity in conjunction with PGO waves during PS (referred to as either “PGO-on” or “PGO-burst” neurons;[39-41]) have been reported to be mainly possibly cholinergic neurons. Both type I-S and PGO-on neurons have a broad action potential, exhibit slow repetitive firing during W, have thalamic or hypothalamic projections with a slow conduction velocity, and are inhibited by carbachol, a potent cholinergic agonist, presumably via M2 muscarinic inhibitory autoreceptors [34,35,37,42-45]. The W/PS-active discharge of the presumed cholinergic neurons is supported by previous microdialysis studies in the cat or rat thalamus showing significantly increased acetylcholine release during both W and PS compared to during SWS [46,47]. In addition, it is well established in the cat that the activation of cholinergic thalamic afferents produces activation (desynchronization) of the cortical EEG by suppressing slow (< 1.0 Hz) cortical waves, delta waves, and spindle wave oscillations [48-50].
The characteristics of the mouse PPT W/PS-active neurons described in the present study are similar to those of cat PPT W/PS-active neurons, referred to as either Type I-S or PGO-on neurons, as described above. Indeed, the mouse PPT W/PS-active neurons discharged either as single isolated spikes during both W and PS or as single isolated spikes during W and as bursts in association with a phasic cortical EEG potential during PS, as also seen with mouse LDT and SubLDT cholinergic neurons [13]. The phasic EEG potentials seen during PS in mice may be equivalent to the feline cortical PGO waves [1,41,51] and the cholinergic PPT, LDT, and SubLDT neurons discharging in bursts during PS in association with a phasic cortical EEG potential may be equivalent to the feline PGO-on neurons recorded in the peribrachial region of the dorsal mesopontine tegmentum [37,39-41,52]. The PGO waves seen in the cat dorsal lateral geniculate nucleus result from rapid nicotinic cholinergic depolarization of relay cells [53]. This nicotinic cholinergic depolarization is absent in the rat dorsal lateral geniculate nucleus [54], explaining the absence of PGO waves in the rat thalamus [55]. It remains unknown whether the nicotinic receptors responsible for the generation of PGO waves are present in the mouse thalamus. It should also be noted that the majority of cholinergic W/PS-active PPT neurons discharged as clusters or bursts accompanied by abrupt EMG activation that either occurred spontaneously during W or were elicited by sensory stimuli, as also seen in the mouse with both W/PS-active cholinergic LDT and SubLDT neurons [13] and waking-selective noradrenergic locus coeruleus neurons [23], orexin/hypocretin hypothalamic neurons [56], and a population of serotonergic dorsal raphe neurons [57]. These findings indicate that the activity of cholinergic PPT W/PS-active neurons plays an important role in the transmission of phasic somatosensory information and phasic processes of arousal and/or EEG activation. The activity of the cholinergic PPT neurons, in particular W/PS-selective neurons that discharge selectively during both W and PS, may also play an important role in the tonic processes of arousal and the sleep-wake switch. As previously seen with W-specific noradrenergic locus coeruleus neurons in rats [58], cats [59], monkeys [60], and mice [13,23] and cholinergic W/PS-selective SubLDT neurons in mice [13], the mouse W/PS-selective PPT neuronal discharge anticipated the oncoming waking or sleep state at the state transitions. At the transition from W to SWS, the PPT W/PS-selective neurons showed a significant decrease in firing rate as early as 0.7 s before the end of W and ceased firing before the onset of SWS, as seen with mouse W-specific noradrenergic locus coeruleus neurons [13,23] and histaminergic tuberomammillary neurons [25,61] and W/PS-selective cholinergic SubLDT neurons [13]. At the transition from SWS to W, they began to fire as early as 2.5 s prior to the onset of W (Figure 15A and B), as seen with W-specific locus coeruleus neurons [13,23] and W/PS-selective SubLDT neurons [13].
Roles of PPT neurons in the generation of rhythmic theta waves
Although four non-cholinergic PS-on neurons located in the medial peri-SubLDT region were previously reported to discharge in bursts with high-frequency (peak IMF > 300 Hz) rhythmic discharges in synchronization with rhythmic theta waves (theta-burst neurons; [14]), none of the PPT PS-on neurons in the present study displayed rhythmic bursting activity in strict association with rhythmic theta waves. However, the spike activity of a group of the cholinergic PPT PS-on and W/PS-active neurons that discharged in bursts (peak IMF ≥ 100 Hz) during PS exhibited theta frequency oscillations during PS, suggesting that they may play a role in the generation of the rhythmic theta waves. This theta frequency oscillation of spike trains was not seen in the non-cholinergic PPT PS-on neurons, but was seen in the cholinergic SubLDT W/PS-selective neurons (my unpublished observation). In addition to the 4 non-cholinergic peri-SubLDT PS-on neurons in my previous study [14], 7 non-cholinergic W/PS-active neurons located medial to the SubLDT were found to fire in bursts with high-frequency (peak IMF < 800 Hz) rhythmic discharges synchronizing with rhythmic theta waves; these theta-burst neurons were all characterized by a biphasic narrow (D3 < 0.7 ms) action potential, and located in the dorsomedial tegmental area (DMT), medial to the SubLDT and dorsal to the oral pontine reticular nucleus (PnO) [13]. Although the origin of the ascending brainstem hippocampal synchronizing pathway was originally localized to the PnO using electrical stimulation techniques in anesthetized rats [62-64], a more recent mapping study using carbachol microinjection revealed that injection into the PPT is also effective in eliciting theta activity in anesthetized rats [65-67]. Fenik and Kubin [68] also reported that, in urethane-anesthetized rats, carbachol induces a PS-like state characterized by increased theta activity in the hippocampus, but, in this case, the most effective injection site was the SubLDT. In this regard, it is important to mention that, in the rat, no PnO neurons were found to discharge rhythmically in bursts in conjunction with rhythmic theta waves [69-71], indicating that PnO neurons are not involved in the generation and determination of the frequency of hippocampal theta rhythm. Instead, the above-mentioned non-cholinergic, possibly GABAergic DMT theta-burst neurons may be responsible for these processes in the brainstem mechanisms of theta wave generation, while a group of cholinergic PPT and SubLDT W/PS-active neurons may have intrinsic membrane properties required for the production of theta frequency oscillations and serve as a primary source of cholinergic input to DMT theta-burst neurons. Future studies are needed to test this hypothesis.
It should be noted that microinjection of carbachol near a unit recording site in unanesthetized cats induces: i) a complete suppression of slow tonic, single-spike activity, but not burst activity, of presumed cholinergic PPT W/PS-active neurons [37,42,43] and ii) a steady increase in firing rate of presumed non-cholinergic PPT W/PS-active neurons [42]. It remains to be determined whether this is also the case for mouse PPT cholinergic and non-cholinergic W/PS-active neurons. Finally, it is worth mentioning that, after injection of carbachol into or near the peri-LCα in awake cats, long-lasting, rhythmic theta waves are observed in the hippocampal EEG and slow delta, but not fast desynchronized, waves are seen on the cortical EEG [72], suggesting two different brainstem mechanisms responsible for the control of hippocampal or neocortical activity. It is worth speculating that the mesopontine cholinergic neurons discharging with or without theta frequency oscillations may be responsible for, respectively, the induction of synchronized theta waves or induction of a desynchronized fast EEG. Non-cholinergic, tonically discharging PPT W/PS-active neurons that do not show theta frequency oscillations are likely to be involved in the mechanisms of tonic arousal and EEG desynchronization.
Roles of PPT cholinergic neurons in the generation of PS
As discussed above, rhythmic theta waves, a major or even the most important phenomenon seen in PS in rodents, are likely to be activated via cholinergic mechanisms. In the cat, the importance of cholinergic mechanisms in PS generation in general is well known. For example, local injection of carbachol into the peri-LCα [72] or anterodorsal pontine tegmentum [73] in the awake cat induces, with a short latency (<5 min), a sleep state that is polygraphically and behaviorally indistinguishable from naturally occurring PS. Injection of carbachol into the cat pontine structure either ventral or caudal to the peri-LCα induces either (i) a "PS-like state" that resembles PS, but lacks certain electrophysiological signs of PS or (ii) a "dissociated state (or PS-like waking state)" [72]. In contrast, carbachol injection into the cat PPT induces a state of active wake characterized by hallucination with contralateral circling [72], and, at a higher dose, repetitive hissing and growling [74]. Carbachol-induced W can be followed by a long-lasting enhancement of PS, particularly when carbachol is injected into the caudolateral PPT [75].
In contrast to the above observations in the cat, carbachol is ineffective in inducing PS with a short latency in non-anesthetized rats [15,76-80]. This discrepancy may be mainly due to the differences in cytochemistry, cytoarchitecture, and size of mesopontine tegmental structures between the cat and rat. For example, in the cat, the peri-LCα is divided into the rostral and caudal parts, which are, respectively, rich or poor in cholinergic neurons and poor or rich in PS-on neurons. Carbachol is only effective in inducing PS when injected into the caudal peri-LCα. Although little is known about the single-unit activity of rat SubLDT neurons, in the mouse SubLDT, which is equivalent to the cat peri-LCα, PS-on and cholinergic W/PS-active neurons are intermingled, as are cholinergic and non-cholinergic neurons [13,14]. The mouse SubLDT also contains many non-cholinergic W/PS-active neurons, whereas the cat peri-LCα does not. As described above, carbachol excites not only non-cholinergic, cholinoreceptive PS-on neurons, but also non-cholinergic, cholinoceptive W/PS-active neurons, activation of which may promote the induction of W, as seen with carbachol microinjection into the cat PPT [72,74]. In this regard, Datta and Siwek [81] reported that, in freely moving rats, microinjection of a low or high dose of glutamate into the PPT induces, respectively, PS or W with suppression of PS, indicating a dose-dependent effect of glutamate on W/PS induction. This may also be true in the previous carbachol microinjection studies in the rat, in which a high dose of carbachol is generally used [15].
In a previous single unit recording study in mice [14], I demonstrated the presence of PS-on neurons in the SubLDT and therefore proposed that the cat peri-LCα is homologous to the mouse SubLDT, but not the subcoeruleus pars alpha (SubCA) or sublaterodorsal nucleus (SLD), as described in the rat by Verret et al. [82], Lu et al. [12], and Krenzer et al. [83], because these two areas are located ventral to the caudal LDT and caudally adjacent pontine central gray, contain noradrenergic neurons, and are devoid of both cholinergic neurons and PS-on neurons [14]. All SubLDT PS-on neurons were previously found to display a biphasic action potential, a characteristic of non-cholinergic neurons [14]. Questions arise regarding the source of cholinergic input to cholinoceptive PS-on neurons and the mechanisms underlying the increase in discharge rate in these neurons at the transition from SWS to PS in the mouse. Recently, Van Dort et al. [16] reported that selective optogenetic activation of cholinergic neurons in the mouse PPT during SWS increases the number of REM sleep episodes, but not the duration of PS episodes, indicating involvement of cholinergic mechanisms in the induction of PS and suggesting that the cholinergic drive for PS induction may come from the PPT cholinergic neurons. I have previously suggested [20] that, in the cat, the vast majority of peri-LCα PS-on neurons are non-cholinergic, but cholinoceptive, and that the vast majority of cholinergic neurons sending axons to the peri-LCα are found in the PPT, with a similar distribution to that of the presumed cholinergic PS-on neurons. In the present study, I found that the mouse PPT contains cholinergic PS-on and W/PS-selective neurons, both of which show a significant increase in discharge rate at the transitions from SWS to PSt and a further significant increase from PSt to PS, and maintain a high rate of discharge throughout a PS episode. It therefore appears that the excitation of the non-cholinergic SubLDT PS-on neurons occurs via activation of cholinergic PS-on neurons located in the PPT and/or cholinergic W/PS-selective neurons located in the PPT and SubLDT. Recently, Kroeger et al. [17] reported that selective chemoactivation of mouse cholinergic PPT neurons does not increase PS, but, instead, promotes light SWS. The state-indifferent, continuous chemoactivation of all populations of cholinergic PPT neurons may induce enhancement of cholinergic W/PS-active neuronal activity, resulting in the suppression of the high voltage delta waves on the cortical EEG that characterize deep SWS.
Finally, there are at least three important differences between the cholinergic PPT PS-on neurons described in the present study and the non-cholinergic SubLDT PS-on neurons described in my previous study [14]: (1) the vast majority (29 of 36) of the SubLDT PS-on neurons did not fire during light SWS, while all the cholinergic 9 PPT PS-on neurons began to fire significantly as early as during light SWS; (2) at the transition from SWS to W, the SubLDT PS-on neurons stopped firing suddenly at the end of SWS, while the PPT PS-on neurons displayed a gradual decrease in firing rate and stopped firing before the end of SWS; and (3) at the transition from PS to W, the SubLDT PS-on neurons gradually decreased firing rate and ceased firing before the end of PS, while the PPT PS-on neurons maintained a high rate of tonic discharge up to the very end of PS. These findings suggest that the cholinergic PPT PS-on neurons may play a role in the induction, maintenance, and cessation of both SWS and PS. Cholinergic PPT W/PS-selective neurons also appear to play an important role in PS generation in general and in the mechanisms underlying the induction and maintenance of a PS episode for the following reasons: (1) at the transition from PSt to PS, the W/PS-selective neurons are the first to display a significant increase in discharge rate; (2) in contrast to SubLDT W/PS-selective neurons [13], the PPT W/PS-selective neurons displayed a significantly higher rate of spontaneous discharge during PS than during waking; and (3) in contrast to SubLDT W/PS-selective neurons, which display an increase in firing rate during the transition from PS to W [13], the PPT W/PS-selective neurons displayed a significant decrease in firing rate during this transition (Figure 15C).
The present study shows, for the first time, that the mouse PPT contains cholinergic PS-on and cholinergic W/PS-selective neurons, both of which may play an important role in the induction, maintenance, and cessation of PS, as well as in the generation of the major tonic and phasic signs of PS. It also shows that the cholinergic, GABAergic, and glutamatergic PPT neuronal populations are all composed of a heterogeneous group of neurons, each of which displays different discharge profiles during the sleep-wake cycle. Thus, in order to understand the exact role of PPT neurons in the control of behavioral states, it is a prerequisite to identify genes that are selectively expressed in each subgroup of cholinergic, glutamatergic, or GABAergic PPT neurons and to examine the effect on behavioral states of neuron-specific modulation, using recently advanced optogenetic or pharmacogenetic techniques in non-anesthetized transgenic mice [16,17,84-86].
This study was supported by INSERM U1028-CNRS UMR5292, and Claude Bernard University Lyon 1. The author thanks Dr. T. Barkas for careful reading of the manuscript and correction of the English.
- Jouvet M (1972) The role of monoamine and acetylcholine-containing neurons in the regulation of sleep-waking cycle. Ergeb Physiol 64:166-307. [Crossref]
2021 Copyright OAT. All rights reserv
- Sakai K (1980) Some anatomical and physiological properties of ponto-mesencephalic tegmental neurons with special references to the PGO waves and postural atonia during paradoxical sleep. In: Hobson JA, Brazier MAB, editors. The reticular formation revisited. New York: Raven, pp : 427-447.
- Sakai K (1985) Anatomical and physiological basis of paradoxical sleep. In: McGinty DJ, Drucker-Colin R, Morrison AR, Parmeggiani L, editors. Brain mechanisms of sleep. New York: Raven, pp: 171-198.
- Steriade M (1981) Mechanisms underlying cortical activation: neuronal organization and properties of the midbrain reticular core and intralaminar thalamic nuclei. In: Pompeiano O, Ajimone-Marsan C, editors. Brain mechanisms and perceptual awareness. New York: Raven, pp: 327-377.
- Siegel JM (1989) Brainstem mechanisms generating REM sleep. In: Kryger M, Roth T, Dement WC. Principles and Practice of Sleep Medicine. New York: WB Saunders, Pp: 104-120.
- Jones BE (1991) Paradoxical sleep and its chemical/structural substartes in the brain. Neuroscience 40: 637-656. [Crossref]
- Datta S (1995) Neuronal activity in the peribrachial area: relationship to behavioral state control. Neurosci Biobehav Rev 19: 67-84. [Crossref]
- Pace-Schott EF, Hobson JA (2002) The neurobiology of sleep genetics, cellular physiology and subcortical network. Nat Rev Neurosci 3: 591-605. [Crossref]
- Brown RE, Basheer R, McKenna JT, Strecker RE, McCarley RW (2012) Control of sleep and wakefulness. Physiol Rev 92:1087-1187. [Crossref]
- Maloney KJ, Mainville L, Jones BE (1999) Differential c-fos expression in cholinergic, monoaminergic, and GABAergic cell groups of the pontomesencephalic tegmentum after paradoxical sleep deprivation and recovery. J Neurosci 19: 3057-3072. [Crossref]
- Boissard R, Gervasoni D, Schmidt MH, Barbagli B, Fort P, et al. (2002) The rat ponto-medullary network responsible for paradoxical sleep onset and maintenance: a combined microinjection and functional neuroanatomical study. Eur J Neurosci 16: 1959-1973. [Crossref]
- Lu J, Sherman D, Devor M, Saper CB (2006) A putative flip-flop switch for control of REM sleep. Nature 441: 589-594. [Crossref]
- Sakai K (2012) Discharge properties of presumed cholinergic and noncholinergic laterodorsal tegmental neurons related to cortical activation in non-anesthetized mice. Neuroscience 224: 172-190. [Crossref]
- Sakai K (2015) Paradoxical (rapid eye movement) sleep-on neurons in the laterodorsal pontine tegmentum in mice. Neuroscience 310: 455-471. [Crossref]
- Grace KP, Horner RL (2015) Evaluating the evidence surrounding pontine cholinergic involvement in REM sleep generation. Front Neurol 6:190. [Crossref]
- Van Dort CJ, Zachs DP, Kenny JD, Zheng S, Goldblum RR, et al. (2015) Optogenetic activation of cholinergic neurons in the PPT or LDT induces REM sleep. Proc Natl Acad Sci U S A 112: 584-589. [Crossref]
- Kroeger D, Ferrari LL, Petit G, Mahoney CE, Fuller PM, et al. (2017) Cholinergic, Glutamatergic, and GABAergic Neurons of the Pedunculopontine Tegmental Nucleus Have Distinct Effects on Sleep/Wake Behavior in Mice. J Neurosci 37: 1352-1366. [Crossref]
- Wang HL, Morales M (2009) Pedunculopontine and laterodorsal tegmental nuclei contain distinct populations of cholinergic, glutamatergic and GABAergic neurons in the rat. Eur J Neurosci 29: 340-358. [Crossref]
- Boucetta S, Cissé Y, Mainville L, Morales M, Jones BE (2014) Discharge profiles across the sleep-waking cycle of identified cholinergic, GABAergic, and glutamatergic neurons in the pontomesencephalic tegmentum of the rat. J Neurosci 34: 4708-4727. [Crossref]
- Sakai K (1988) Executive mechanisms of paradoxical sleep. Arch Ital Biol 126: 239-257. [Crossref]
- Sakai K, Koyama Y (1996) Are there cholinergic and non-cholinergic paradoxical sleep-on neurons in the pons? Neuroreport 7: 2449-2453. [Crossref]
- Sakai K, Crochet S, Onoe H (2001) Pontine structures and mechanisms involved in the generation of paradoxical (REM) sleep. Arch Ital Biol 139: 93-107. [Crossref]
- Takahashi K, Kayama Y, Lin JS, Sakai K (2010) Locus coeruleus neuronal activity during the sleep-waking cycle in mice. Neuroscience 169: 1115-1126. [Crossref]
- Pinault D (1996) A novel single-cell staining procedure performed in vivo under electrophysiological control: morpho-functional features of juxtacellularly labeled thalamic cells and other central neurons with biocytin or Neurobiotin. J Neurosci Methods 65: 113-136. [Crossref]
- Takahashi K, Lin JS, Sakai K (2006) Neuronal activity of histaminergic tuberomammillary neurons during wake-sleep states in the mouse. J Neurosci 26: 10292-10298. [Crossref]
- Takahashi K, Lin JS, Sakai K (2009) Characterization and mapping of sleep-waking specific neurons in the basal forebrain and preoptic hypothalamus in mice. Neuroscience 161: 269-292. [Crossref]
- Armstrong DM, Saper CB, Levey AI, Wainer BH, Terry RD (1983) Distribution of cholinergic neurons in rat brain: demonstrated by the immunocytochemical localization of choline acetyltransferase. J Comp Neurol 216: 53-68. [Crossref]
- Rye DB, Saper CB, Lee HJ, Wainer BH (1987) Pedunculopontine tegmental nucleus of the rat: cytoarchitecture, cytochemistry, and some extrapyramidal connections of the mesopontine tegmentum. J Comp Neurol 259: 483-528. [Crossref]
- Boucetta S, Jones BE (2009) Activity profiles of cholinergic and intermingled GABAergic and putative glutamatergic neurons in the pontomesencephalic tegmentum of urethane-anesthetized rats. J Neurosci 29: 4664-4674. [Crossref]
- Paxinos G, Franklin KBJ (2001) The mouse brain in stereotaxic coordinates. San Diego: Academic Press.
- Arcelli P, Frassoni C, Regondi MC, De Biasi S, Spreafico R (1997) GABAergic neurons in mammalian thalamus: a marker of thalamic complexity? Brain Res Bull 42: 27-37. [Crossref]
- Wang B, Gonzalo-Ruiz A, Sanz JM, Campbell G (1999) Immunoelectron microscopic study of ?-aminobutyric acid inputs to identified thalamocortical projection neurons in the anterior thalamus of the rat. Exp Brain Res 126: 369-332. [Crossref]
- Hassani OK, Lee MG, Henny P, Jones BE (2009) Discharge profiles of identified GABAergic in comparison to cholinergic and putative glutamatergic basal forebrain neurons across the sleep-wake cycle. J Neurosci 29: 11828-11840. [Crossref]
- El Mansari M, Sakai K, Jouvet M (1989) Unitary characteristics of presumptive cholonergic tegmental neurons during sleep-waking cycle in freely moving cats. Exp Brain Res 76: 519-529. [Crossref]
- Steriade M, Datta S, Paré D, Oakson G, Currò Dossi R (1990a) Neuronal activities in brain-stem cholinergic nuclei related to tonic activation processes in thalamocortical systems. J Neurosci 10: 2541-2559. [Crossref]
- Kayama Y, Ohta M, Jodo E (1992) Firing of 'possibly' cholinergic neurons in the rat laterodorsal tegmental nucleus during sleep and wakefulness. Brain Res 569: 210-220. [Crossref]
- Koyama Y, Sakai K (2000) Modulation of presumed cholinergic mesopontine tegmental neurons by acetylcholine and monoamines applied iontophoretically in unanesthetized cats. Neuroscience 96: 723-733. [Crossref]
- Datta S, Siwek DF (2002) Single cell activity patterns of pedunculopontine tegmentum neurons across the sleep-wake cycle in the freely moving rats. J Neurosci Res 70: 611-621. [Crossref]
- Saito H, Sakai K, Jouvet M (1977) Discharge patterns of the nucleus parabrachialis lateralis neurons of the cat during sleep and waking. Brain Res 134: 59-72. [Crossref]
- McCarley RW, Nelson JP, Hobson JA (1978) Ponto-geniculo-occipital (PGO) burst neurons: correlaive evidence for neuronal generation of PGO waves. Science 201: 269-272. [Crossref]
- Sakai K, Jouvet M (1980) Brain stem PGO-on neurons projecting directly to the cat dorsal lateral geniculate nucleus. Brain Res 194: 500-505. [Crossref]
- El Mansari M, Sakai K, Jouvet M (1990) Responses of presumed cholinergic mesopontine tegmental neurons to carbachol microinjections in freely moving cats. Exp Brain Res 83: 115-123. [Crossref]
- Sakai K, El Mansari L, Jouvet M (1990) Inhibition by carbachol microinjections of presumptive cholinergic PGO-on neurons in freely moving cats. Brain Res 527: 213-223. [Crossref]
- Steriade M, Paré D, Datta S, Oakson G, Curró Dossi R (1990b) Different cellular types in mesopontine cholinergic nuclei related to ponto-geniculo-occipital waves. J Neurosci 10: 2560-2579. [Crossref]
- Leonard CS, Llinás S (1994) Serotonergic and cholinergic inhibition of mesopontine cholinergic neurons controlling REM sleep: an in vitro electrophysiological study. Neuroscience 59: 309-330. [Crossref]
- Williams JA, Comisarow J, Day J, Fibiger HC, Reiner PB (1994) State-dependent release of acetylcholine in rat thalamus measured by in vivo microdialysis. J Neurosci 14: 5236-5242. [Crossref]
- Kodama T, Honda Y (1996) Acetylcholine releases of mesopontine PGO-on cells in the lateral geniculate nucleus in sleep-waking cycle and serotonergic regulation. Prog Neuro-Psycopharmacol Biol Psychiat 20: 1213-1227. [Crossref]
- Curró Dossi R, Paré D, Steriade M (1991) Short-lasting nicotinic and long-lasting muscarinic depolarizing responses of thalamocortical neurons to stimulation of mesopontine cholinergic nuclei. J Neurophysiol 65: 393-406. [Crossref]
- Steriade M, Currò Dossi R, Paré D, Oakson G (1991) Fast oscillations (20-40 Hz) in thalamocortical systems and their potentiation by mesopontine cholinergic nuclei in the cat. Proc Natl Acad Sci (USA) 88: 4396-4400. [Crossref]
- Steriade M, Amzica F, Nuñez A (1993) Cholinergic and noradrenergic modulation of the slow (approximately 0.3 Hz) oscillation in neocortical cells. J Neurophysiol 70:1385-1400. [Crossref]
- Sakai K, Cespuglio R (1976) Evidence for the presence of eye movement potentials during paradoxical sleep in cats. Electroencephalogr Clin Neurophysiol 41: 37-48. [Crossref]
- Datta S, Hobson JA (1994) Neuronal activity in the caudolateral peribrachial pons: relationship to PGO waves and rapid eye movements. J Neurophysiol 71: 95-109. [Crossref]
- Hu B, Bouhassira D, Steriade M, Deschênes M (1988) The blockage of ponto-geniculo-occipital waves in the cat lateral geniculate nucleus by nicotinic antagonists. Brain Res 473: 394-397. [Crossref]
- McCormick DA, Prince DA (1987) Actions of acetylcholine in the guinea-pig and cat medial and lateral geniculat nuclei, in vitro. J Physiol (Lond) 392: 145-167. [Crossref]
- Stern W, Forbes W, Morgane P (1974) Absence of PGO spikes in rats. Physiol Behav 12: 293-295. [Crossref]
- Takahashi K, Lin JS, Sakai K (2008) Neuronal activity of orexin and non-orexin waking-active neurons during wake-sleep states in the mouse. Neuroscience 153: 860-870. [Crossref]
- Sakai K (2011) Sleep-waking discharge profiles of dorsal raphe nucleus neurons in mice. Neuroscience 197: 200-224. [Crossref]
- Aston-Jones G, Bloom FE (1981) Activity of norepinephrine-containing locus coeruleus neurons in behaving rats anticipates fluctuations in the sleep-waking cycle. J Neurosci 1: 876-886. [Crossref]
- Sakai K, Crochet S (2003) A neural mechanism of sleep and wakefulness. Sleep Biol Rhyth 1: 29-42.
- Foote SL, Aston-Jones G, Bloom EE (1980) Impulse activity of locus coeruleus neurons in awake rats and monkeys is a function of sensory stimulation and arousal. Proc Natl Acad Sci USA 77: 3033-3037. [Crossref]
- Sakai K, Takahashi K, Anaclet C, Lin JS (2010) Sleep-waking discharge of ventral tuberomammillary neurons in wild-type and histidine decarboxylase knock-out mice. Front Behav Neurosci 4: 1-10. [Crossref]
- Macadar SW, Chalupa LM, Lindsley DB (1974) Differentiation of brainstem loci which affect hippocampal and neocortical activity. Exp Neurol 43: 499-514. [Crossref]
- Vertes RP (1981) An analysis of ascending brain stem systems involved in hippocampal synchronization and desynchronization. J Neurophysiol 46: 1140-1159. [Crossref]
- Vertes RP (1982) Brain stem generation of the hippocampal EEG. Prog Neurobiol 19: 159-186. [Crossref]
- Vertes RP, Colom LV, Fortin WJ, Bland BH (1993) Brainstem sites for the carbachol elicitation of the hippocampal theta rhythm in the rat. Exp Brain Res 96: 419-429 [Crossref]
- Bland BH, Oddie SD (1998) Anatomical, electrophysiological and pharamacological studies of ascending brainstem hippocampal synchronizing pathways. Neurosci Biobehav Rev 22: 259-273. [Crossref]
- Kinney GG, Vogel GW, Feng P (1998) Brainstem carbachol injections in the urethane anesthetized rat produce hippocampal theta rhythm and cortical desynchronization: a comparison of pedunculopontine tegmental versus nucleus pontis oralis injections. Brain Res 809: 307-313. [Crossref]
- Fenik VB, Kubin L (2009) Differential localization of carbachol- and bicuculline-sensitive pontine sites for eliciting REM sleep-like effects in anesthetized rats. J Sleep Res 18: 99-112. [Crossref]
- Vertes RP (1979) Brain stem gigantocellular neurons: patterns of activity during behavior and sleep in the freely moving rat. J Neurophysiol 42: 214-228. [Crossref]
- Nuñez A, de Andrés I, García-Austt E (1991) Relationships of nucleus reticularis pontis oralis neuronal discharge with sensory and carbachol evoked hippocampal theta rhythm. Exp Brain Res 87: 303-308. [Crossref]
- Hanada Y, Hallworth NE, Szgatti TL, Scarlett D, Bland BH (1999) Distribution and analysis of hippocampal theta-related cells in the pontine region of the urethane-anesthetized rat. Hippocampus 9: 288-302. [Crossref]
- Vanni-Mercier G, Sakai K, Lin JS, Jouvet M (1989) Mapping of cholinoceptive brainstem structures responsible for the generation of paradoxical sleep in the cat. Arch Ital Biol 127: 133-164. [Crossref]
- Yamamoto K, Mamelak AN, Quattrochi JJ, Hobson JA (1990) A cholinoceptive desynchronized sleep induction zone in the anterodorsal pontine tegmentum: locus of the sensitive region. Neuroscience 39: 279-293. [Crossref]
- Baghdoyan HA, Rodrigo-Angulo ML, McCarley RW, Hobson JA (1984) Site-specific enhancement and suppression of desynchronized signs following cholinergic stimulation of three brainstem regions. Brain Res 306: 39-52. [Crossref]
- Datta S, Calvo JM, Quattrochi JJ, Hobson JA (1991) Long-term enhancement of REM sleep following cholinergic stimulation. Neuroreport 2: 619-622. [Crossref]
- Gnadt JW, Pegram GV (1986) Cholinergic brainstem mechanisms of REM sleep in the rat. Brain Res 384: 29-41. [Crossref]
- Bourgin P, Escourrou P, Gaultier C, Adrien J (1995) Induction of rapid eye movement sleep by carbachol infusion into the pontine reticular formation in the rat. Neuroreport 6: 532-536. [Crossref]
- Deuveilher S, Hars B, Hennevin E (1997) Pontine microinjection of carbachol does not reliably enhance paradoxical sleep in the rat. Sleep 20: 593-607. [Crossref]
- Marks GA, Birabil CG (1998) Enhancement of rapid eye movement sleep in the rat by cholinergic and adenosinergic agonists infused into the pontine reticular formation. Neuroscience 86: 29-37. [Crossref]
- Pollock MS, Mistlberger RE (2003) Rapid eye movement sleep induction by microinjection of the GABA-A antagonist bicuculline into the dorsal subcoeruleus area of the rat. Brain Res 962: 68-77. [Crossref]
- Datta S, Siwek DF (1997) Excitation of the brain stem pedunculopontine tegmentum cholinergic cells induces wakefulness and REM sleep. J Neurophysiol 77: 2975-2988. [Crossref]
- Verret L, Léger L, Fort P, Luppi PH (2005) Cholinergic and noncholinergic brainstem neurons expressing Fos after paradoxical (REM) sleep deprivation and recovery. Eur J Neurosci 21: 2488-2504. [Crossref]
- Krenzer M, Anaclet C, Vetrivelan R, Wang N, Vong L, et al. (2011) Brainstem and spinal cord circuitry regulating REM sleep and muscle atonia. PLoS One 6: e24998. [Crossref]
- Carter ME, Yizhar O, Chikahisa S, Nguyen H, Adamantidis A, Nishino S, Deisseroth K, de Lecea L (2010) Tuning arousal with optogenetic modulation of locus coeruleus neurons. Nat Neurosci 13: 1526-1533. [Crossref]
- Sasaki K, Suzuki M, Mieda M, Tsujino N, Roth B, et al. (2011) Pharmacogenetic modulation of orexin neurons alters sleep/wakefulness states in mice. PLoS One 6: e20360. [Crossref]
- Hayashi Y, Kashiwagi M, Yasuda K, Ando R, Kanuka M, Sakai K, Itohara S (2015) Cells of a common developmental origin regulate REM/non-REM sleep and wakefulness in mice. Science 350: 957-961. [Crossref]


