Abstract
The manufacturing of 3D interconnected globular carbon aerogel, called Globugraphite, is based on the replication of the zinc oxide (ZnO) template morphology by carbon with simultaneous removing of the template material in the chemical vapour deposition (CVD - replica CVD (rCVD) process). Due to the growth mechanism of carbon structures, defects occur at the atomic level and the formation of graphitic pieces, which negatively affects the properties of these structures. By undergoing a temperature treatment at 1600°C, 1800°C, 2000°C and 2200°C in a protective gas atmosphere the carbon structure heals at the atomic level. The connection of the sp2/sp3 graphitic pieces to graphitic sp2 layers due to the thermal annealing is analysed via transmission electron microscopy (TEM) observation and Raman spectroscopy. Based on these analysis methods a model of the graphitization progress is created which explains the clearly increase of the electrical conductivity and the oxidation temperature.
Key words
replica CVD process, thermal graphitization, Raman spectroscopy, TEM, electrical conductivity
Introduction
Since the discovery of carbon nanostructures such as carbon nanotubes (CNTs) [1] and graphene [2] the interest increases to use such materials for several applications, e.g. sensors [3], bioimplantats [4], composites [5-7] and batteries [8]. The development of 3D carbon structures is the next step to generate more applications with improved or specially designed properties. A variety of manufacturing methods opens a new field of research. Manufacturing processes can be distinguished between a template-based [8-11] and a template-free [12] methods for the direct production of carbon aerogels. In addition, assembly of graphitic structures [13-17] can be carried out. One of these methods was the discovery of Aerographite [11]. Based on a ZnO template, a carbon structure is produced in a one-step CVD process by reduction of ZnO in vaporized zinc (Zn) in combination of epitaxy and catalytic graphitization [18]. Due to the outstanding properties of 3D interconnected carbon structures, these can be used for varied applications, such as supercapacitors [19], fuel cells [20], and basic structure for the growth of nerve cells [21] or sensors [22].
Affected by the growth of the carbon structures, there are always defects in the arrangement of the carbon atoms. These deteriorate the mechanical [23,24] as well as the electrical [25] properties of carbon structures. The high temperature annealing of carbon structures especially of carbon nanotubes is a powerful tool to heal structural defects [26]. Several groups investigated the influence of the annealing on the morphology and improvement of properties of CNTs or Graphene [27-29] as well as of CNT-polymer composites [30] and CNT-yarn [31]. It was shown that with increasing temperature, the electrical resistance decreases and the oxidation temperature increases at the same time [23]. In addition, to high- temperature graphitization, first annealing processes with graphene could also be observed at a temperature of up to 600°C [32]. Furthermore, several groups showed that a temperature treatment of carbon structures results in a reorientation of the graphitic layers. Raman spectroscopy is an effective technique of measuring this structural change [26-29]. In addition to the thermal graphitization, graphite layers can be healed by the supply of C2H2/C2H4 [33] or as described for graphene, by metal-assisted healing [34], healing by absorption [35], or self-healing [36].
In the present work, we show for the first time the effect of high temperature annealing as a function of the treatment temperature on the electrical and morphological properties of 3D carbon structures, called Globugraphite. The production of these structures based on, as described in previously works, the synthesis of Aerographite [11,18,19]. To heal the structure of Globugraphite at atomic level and analyze the influence of the treatment temperature, the carbon aerogel were heat-treated at 1600°C, 1800°C, 2000°C and 2200°C for 2 hours in an inert argon atmosphere. The healing process of the graphitic layers is analyzed via Transmission electron microscopy and Raman spectroscopy. Furthermore, we examine the extent to which graphitization influences temperature stability and the electrical conductivity. Based on the analytical techniques a model of the graphitization progress in the presented 3D carbon structures is created.
Materials and methods
Manufacturing of hierarchical ceramic templates
The manufacturing of these carbon structures is based on a two-step process, as previously reported in more details [18]. The replication process of the template morphology takes place in the rCVD method, as previously for the reported for Aerographite [11,19]. In the first process step, a porous ceramic is produced via mixing ZnO powder (Sigma Aldrich, ReagentPlus®, purity of 99.9 %, 5 µm) with a polymer binder (Polyvinyl Butyral-PVB, Mowital® B60 HH, Kuraray®, purity: 99.5 %). After the sample form has been prepared via the uniaxial press, the sintering of the green body takes place, with a defined sintering temperature at 400°C, so that only the sinter necks are formed. This results in a porous hierarchical structure.
Synthesis of hierarchical carbon aerogel
In the second process step the replication of the template structure takes place in the rCVD process. The CVD reactor is heated up to 760°C, a gas stream being set with the process gases argon (0.2 l/min) and hydrogen (60 ml/min). The precursor (toluene, Alfa Aesar, 99.5%) is injected into the preheated zone with an injection rate of 5 ml/h. After an injection time of the carbon source of 60 minutes, the temperature is increased to 900°C for 60 minutes, without the injection of the carbon source. The process ends with cooling down without a supply of hydrogen and with an argon flow of 0.4 l/min. The prepared samples have a cylindrical geometry with a diameter of 11.75 ± 0.31 mm and a height of 1.33 ± 0.05 mm.
Analysis methods
The graphitization was carried out in high-temperature furnaces (Gasdrucksinterofen, Dieckmann and Gero HTK 8) for 2 hours in an argon protective atmosphere at 1600°C, 1800°C, 2000°C and 2200°C. Before the furnace was heated up to the appropriate temperature, the furnace was repeatedly evacuated and purged with argon. The final pressure in the furnace was about 100 mbar. The samples were heated up and cooled down with 20 K/min.
The morphology was characterized via scanning electron (SEM; Zeiss Supra VP 55, 5 kV acceleration voltage) and the influence on the formation of the graphitic layers was characterized by using the transmission electron microscopy (FEI Talos F200X, 200kV acceleration voltage). The samples for the TEM observations were prepared in accordance with the sample preparation as described previously [19]. The samples were dispersed via the ultrasonic sonotrode (Bandelin Sonoplus) in methanol (LC-MS, >99.9 %, Sigma Aldrich), with 30-45 % of the maximum power for 30-45 seconds. Followed by this the solution was dropped onto a TEM grid and dried at 80°C for 45 minutes on a heating plate.
Furthermore, the graphitization progress is analyzed by using Raman spectroscopy (HORIBA Jobin Yvon HR 800, wavelength: 632 nm). The Raman spectra were obtained at room temperature with a spectral width of 500-3000 cm-1 and an acquisition time of 10 seconds at several positions. The ID/IG (R) and D/G´ (ID/IG´) ratios are calculated based on the peak maxima. Additionally, the oxidation temperature was investigated by using the thermogravimetric analysis (TGA, TA instruments Q900 TGA). The samples were heated up to 900 °C with a heating and cooling rate of 20 K/min in a synthetic air (20 vol% oxygen) atmosphere. Finally, the electrical conductivity is measured at room temperature by using a four-wire configuration with a defined current at the source meter of 1 mA (Keithley 2602 System SourceMeter). The electrical conductivity is calculated according to equation (2) by using the measured geometry via equation (1).
Where,
A = sample surface (m2) d = sample diameter (m) h = sample height (m)
R = electrical resitance (Ω)
σ = electrical conductivity (S/m)
Results and discussion
The produced ceramic templates has an hierarchical structure with macropores of approximately 2-10 μm, meso pores between the carbon shells with a width of less than 50 nm, as can been see in Figure 1a and micro pores in the carbon shells of a 1-2 nm, as show in Figure 1a. In Figure 1b, due to a specially sintering process, only sintering of the ZnO particles with formation of sinter necks takes place, which results in a porous structure with a high specific surface area as previosly reported [18]. The macro pores are formed by burning out the binder in the sintering process. The meso pores are formed by a specific adjustment of the sintering temperature, so that a further diffusion is prevented and thus a complete sintering is avoided. By replicating the templates into a carbon structure via the rCVD process, the ceramic structure is replaced by a few nanometer thick carbon shell as shown in Figure 1 c-d. This structure has the same globular morphology as the ZnO template, as shown in Figure 1b. The globular carbon shells are only connected via the previously formed sinter necks. By the hierarchical structure consisting of several planes of pore-like structures, such highly specific surfaces, as Figure 1c shows. Furthermore, the carbon shells are connected via the previously formed sintering necks (Figure 1d). It should be mentioned that the morphology of Globugraphite is not changed by the graphitization during the thermal annealing process.
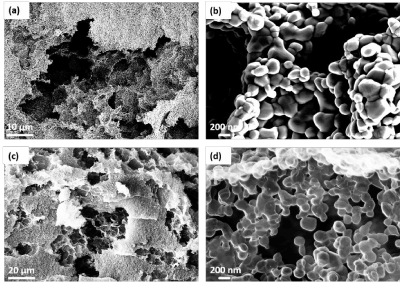
Figure 1. SEM image of the porous hierarchical ceramic structure after the sintering process (a) with its magnified area (b) and of the replicated carbon structure after the CVD process (c) with is magnified area (d).
To understand the graphitization of carbon structures it is important to analyze the influence of this treatment method on the atomic arrangement of the graphitic layers. The untreated samples do not show large graphitic areas, but consists of short graphitic pieces between each is a gap of about a nanometer, as Figure 2a shows. This atomic structure is based on the growth mechanism of such structures. As growth process always causes defects in carbon structure these affect the properties of these structures. As already shown for tetrapodal carbon structures, which are also produced based on a ZnO template, a catalytic graphitization is carried out by the synthesis of the structures. This leads to the diffusion of the catalyst (Zn) through the graphitic layers which are not completely closed. This has an influence on the formation of the defect density [19], which can kbe analyzed by means of Raman spectroscopy. By annealing of the carbon aerogel, a healing process of the individual graphitic pieces with increasing of the annealing temperature is observed, as shown in Figure 3a. The defects between graphitic pieces heal by temperature treatment and form graphitic layers. These graphite bands passing through the carbon aerogel structure, as shown in Figure 2b-e.
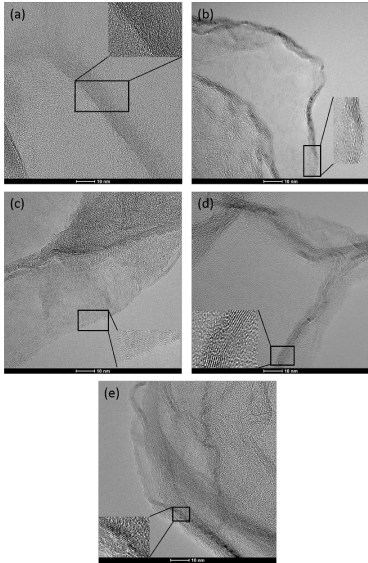
Figure 2. Dependency of the graphitization of the layers on the temperature: untreated (a), 1600°C (b), 1800°C (c), 2000°C (d), 2200°C (e), the inserts have a scale bar of 5 nm.
Raman spectroscopy is a standardized technique to analyze the influence of the thermal annealing process on the structural enhancement in carbon structures. The results from the Raman spectroscopy fits well with the previously TEM observations. As can be seen in Figure 3a, the Raman spectra of the untreated sample shows two peaks, one at ~1330 cm-1, called the D-peak and a second peak at ~1580 cm-1, the G-peak [37-39]. As reported for Aerographite, these carbon aerogels are consits of sp2 and sp3 carbon [11]. By calculating a ratio from both peaks, an intensity factor called R-value or ID/IG ratio can be determined. The untreated sample has an R-value of more than 1. This means that the structures produced have a high defect density. For tetrapodal carbon structures, which are also produced based on a ZnO template, the R value is also higher than 1, which is confirmed by previously works [19,40,41]. This is due to the growth mechanism in which zinc is used as the catalyst for the graphitic arrangement and is replaced by the graphite, so that the gaps between the graphitic pieces can be closed [19]. Untreated Globugraphite do not have a G'-band or 2D-band called (~2660 cm-1). The appearance of strong second order peaks indicates that the tubes have more order in their structure, similar the structure of graphite [42].
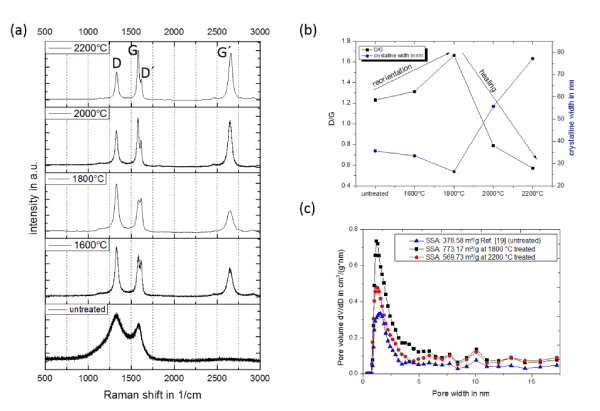
Figure 3. Raman spectra of the globular carbon structures in dependent of the annealing temperature (a), comparison of the R (ID/IG) and the D/G´ value of the annealed structures (b) and a schematic model of the graphitization process (c).
At first with increasing of the treatment temperature at 1600°C and 1800°C the R-value increase continuously, as shown in Figure 3b. At the same time, a formation of the D´ and G'- band can be observed. The appearance of the D´-peak describes as well as the D-band defects in sp2 lattices [39]. The splitting of the G-band into the D´-band, as already detected in other high temperature annealing processes by several groups [29,43]. This splitting is based on a transformation into a graphitic structure and the formation of defects in the formed sp2 layers. The G'-peak describes the three-dimensional order of the graphitic sp2 layers [26]. Behler et al. (2006) interpreted the shift of the G peak to ~1581 cm-1 during the graphitization process with the increasing graphitic arrangement of the carbon lattices in MWCNTs, which correlates with the theoretical position in graphite [43]. This shift from ~1585 cm-1 to ~1581cm-1 of the G-peak also occurs druing the thermal treatment in the here presented carbon aerogel. The R-value decrease down to its minimum at 0.56 for the last temperature stage at 2200°C. Furthermore, the spectra show the formation of the second order peaks after the heat treatment, which occurs the reorientation in the graphitic layers. Thus, the structure has a high order in the formation of the graphitic bands, within the globular as well as between the globular structures. For CNTs a continuous reduction of the R-value has already been observed by several groups with increasing of the treatment temperature [27,29,43]. For this purpose, the 3D crosslinked structures behave in the opposite direction, as shown in Figure 3b, whereby this reduction begins at significantly higher temperatures. Additionally, it should be mentioned that G´-peak is not split into a 2D-1 and a 2D-2 peak as known from graphite [44]. This is because of the number of layers (5-20 layers in Globugraphite) of the here presented carbon structure which has more common with few-layered graphene or multi- walled carbon nanotubes than with bulk graphite. Based on these results, the graphitic position can be oriented with beginning of the graphitization or the healing process, and this orientation reach a higher order with increased temperatures as presented in the schematic model in Figure 3c. First the carbon aerogel consists of graphitic pieces (1). These pieces are consisting of sp2 and sp3 carbon, whereby based on the high defect density more sp3 carbon is present. During the thermal treatment these pieces are combined into short graphitic layers (2). Additionally, crosslinks between the graphitic layers and further defects are formed, which is expressed in the formation of the D'-peak. This takes place up to a temperature of up to 1800°C. Then the orientation of these graphitic layers and the healing of defects in the sp2 are taking places (3). Finally, at a temperature of 2200°C the reduction of defects reaches its minimum, and the healing processes is completed (4). This healing process of the graphitic pieces to graphitic layers has an influence on properties such as the electrical conductivity and the oxidation temperature of carbon structures. With increasing temperature, the healing of the graphitic pieces to global graphitic layers is more efficient.
The thermal annealing of the 3D carbon structures is an effective tool to improve and design the thermal and electrical properties of these materials. The graphitization of the several carbon pieces leads to large carbon layers, which was analyzed via TEM and Raman techniques. The measurement of the electrical conductivity is an effective method to analyze the influence of the healing progress on the properties of these structures, as shown in Figure 4. It shows, that with an increase in the electrical conductivity is associated with the treatment temperature. The untreated samples have an electrical conductivity of 7.7 S/m. The treatment increases the electrical conductivity from 9.4 S/m up to 23.86 S/m for temperature at 1600°C to 2200°C.
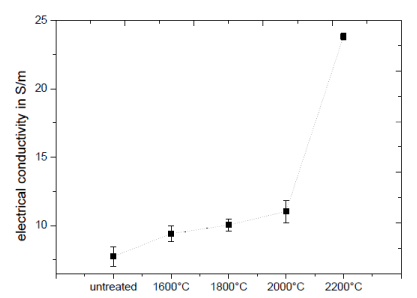
Figure 4. Dependency of the electrical conductivity of the treatment temperature.
The significant increase of the electrical conductivity by annealing at 2200°C can being explained by the improved connection of the graphitic layers between the individual globular structures at the sintering necks to global connected graphitic layers which confirms the previously created model of the graphitization process based on the TEM and Raman observations.
Additionally, the influence of the structural reorientation of the graphitic layers was investigated by using the TGA technique, as Figure 5 shows. Up to a temperature of ~550°C for the untreated and 700°C for the treated carbon aerogel no oxidation takes place. The improvement of the oxidation temperature can be explained by the healing of the graphitic layers by joining them into continuous graphitic bands. The oxidation temperature could be increased from 700°C for the untreated carbon aerogel up to ~770°C for the treated samples, which means an increase of 10%. The results from the measurements of the temperature stability are in good agreement with those of the TEM images and the Raman spectra. Due to the reduction of edges and corner effects, atmospheric oxygen cannot attack the surface when the structures are oxidized. Only by splitting the carbon bond at higher temperatures a thermal oxidation is possible. A further increase of the temperature treatment of more than 1600°C has no significant effect on temperature stability. So, that already 1600°C is enough to generate an optimal improvement. A further increase in the oxidation temperature with increasing of the annealing temperature does not take place due to the already formed graphitic layers. Because of the global crosslinking of the graphitic layers at process temperatures higher than 2000°C. The mass increase from a temperature between 700°C for the untreated and respectively 800°C for the treated samples can be explained by the oxidation of the Zn residue to ZnO.
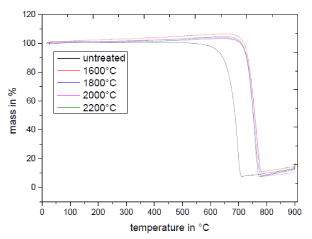
Figure 5. TGA spectra of the globular carbon structure dependent on the annealing temperature.
Conclusion
In this study, a thermal treatment at 1600°C, 1800°C, 2000°C and 2200°C was used to improve the physical properties of 3D interconnected carbon aerogel with a hierarchical morphology. The thermal graphitization via a heat treatment of carbon structures is a powerful tool to heal structural defects on the atomic level. As a result, the graphitic pieces grow together and form graphitic layers, which is confirmed by the determination of TEM and Raman observations. Based on these analysis techniques, a model of the graphitization pogress is created. The graphitization is carried out in four steps, firstly the healing of small pieces into graphitic layers and the formation of overlapping connections followed by the healing of these crosslinkings and the connection of the sintered necks. This leads to the improved electrical conductivity and the low defect densities. Furthermore, it was shown that the analysis of Raman spectra in combination with the measurement of the electrial conductivity of such structures were a simple but extremely effective tool to determine the healing process over the whole structure. It has been shown that the electrical conductivity increases with increasing temperature. The electrical conductivity could be improved up to 300 % and the oxidation temperature by 9%.
Acknowledgement
JM, BF came up with the concept. JM, HB, SG and BF designed the study. JM and HB fabricated and measured the samples. Additionally, the authors would like to acknowledge Mr. Manfred Geerken (Technische Universität Hamburg) and Mr. Robert Albrecht (Technische Universität Ilmenau) for the heat treatment of the samples.
Funding
JM gratefully acknowledge project funding by the German Research Foundation (DFG) SCHU 926/25-1 and HB, SG, BF acknowledge the European Union Seventh Framework Programme under grant agreement n°604391 Graphene Flagship.
References
- Radushkevich L, Lukyanovich V (1952) About the structure of carbon formed by thermal decomposition of carbon monoxide on iron substrate. Zurn Fisic Chim 26: 88-95.
- Geim AK, Novoselov KS (2007) The rise of graphene. Nat Mater 6: 183-191. [Crossref]
- Karimov KS, Abid M, Saleem M, Akhmedov KM, Bashir MM, et al. (2014) Temperature gradient sensor based on CNT composite. Physica B 446: 39-42.
- Hussain MA, Maqbool A, Khalid FA, Bakhsh N, Hussain A, et al. (2014) Mechanical properties of CNT reinforced hybrid functionally graded materials for bioimplants. Trans Nonferrous Met Soc China 24: 90-98.
- Liao J, Tan MJ (2011) A simple approach to prepare Al/CNT composite: Spread– Dispersion (SD) method. Materials Letters 65: 2742-2744.
- Allaoui A, Bai A, Cheng HM, Bai JB (2002) Mechanical and electrical properties of a MWNT/epoxy composite. Compos Sci Technol 62: 1993-1998.
- Thostenson ET, Chou TW (2003) On the elastic properties of carbon nanotube-based composites: modelling and characterization. J Phys D: Appl Phys 36: 573-582.
- Yang S, Huang G, Hua S, Hou X, Huang Y, et al. (2014) Improved electro chemical performance of the Li1.2Ni0.13Co0.13Mn0.54O2 wired by CNT networks for lithium-ion batteries. Materials Letters 118: 8-11.
- Chen Z, Ren W, Gao L, Bilu L, Songfeng P, et al. (2011) Three-dimensional flexible and conductive interconnected graphene networks grown by chemical vapour deposition. Nat Mater 10: 424-428. [Crossref]
- Dong X, Cao Y, Wang J, Chan-Park MB, Wang L, et al. (2012) Hybrid structure of zinc oxide nanorods and three dimensional graphene foam for supercapacitor and electrochemical sensor applications. RSC Adv 2: 4364-4369.
- Mecklenburg M, Schuchardt A, Mishra YK, Kaps S, Adelung R, et al. (2012) Aerographite: ultra lightweight, flexible nanowall, carbon microtube material with outstanding mechanical performance. Adv Mater 24: 3486-3490. [Crossref]
- Gui X, Wei J, Wang K, Cao A, Zhu H (2010) Carbon Nanotube Sponges. Adv Mater 22: 617-621. [Crossref]
- Ye S, Feng J, Wu P (2013) Deposition of Three-Dimensional Graphene Aerogel on Nickel Foam as a Binder-Free Supercapacitor Electrode. ACS Appl Mater Interfaces 5: 7122-7129. [Crossref]
- Liang HW, Guan QF, Chen LF, Zhu Z, Zhang WJ, et al. (2012) Macroscopic-Scale Template Synthesis of Robust Carbonaceous Nanofiber Hydrogels and Aerogels and Their Applications. Angew Chem Int Ed Engl 51: 5101-5105. [Crossref]
- Zhang X, Sui Z, Xu B, Yue S, Luo Y, et al. (2011) Mechanically strong and highly conductive graphene aerogel and its use as electrodes for electrochemical power sources. J Mater Chem 21: 6494-6497.
- Qiu L, Liu JZ, Chang SLY, Wu Y, Li D (2012) Biomimetic superelastic graphene- based cellular monoliths. Nat Commun 3: 1241. [Crossref]
- Song B, Wu Z, Zhu Y, Moon K, Wong CP (2015) Highly Conductive Polyurethane/Polyaniline-Based Composites for Wearable Electronic Applications. ECTC.
- Marx J, Garlof S, Beisch H, Shvets RY, Grygorchak II, et al. (2017) Bio-inspired hierarchical electrodes for energy storage made by carbon replica process, in preparation.
- Marx J, Lewke MRD, Smazna D, Mishra YK, Adelung R, et al. (2017) Growth model of the 3D interconnected carbon structure “Aerographite” via ex-situ analysis. J Mater Chem Phys.
- Yong YC, Dong XC, Chan-Park MB, Song H, Chen P (2012) Macroporous and monolithic anode based on polyaniline hybridized three-dimensional graphene for high- performance microbial fuel cells. ACS Nano 6: 2394-2400. [Crossref]
- Lamprecht C, Taale M, Paulowicz I, Westerhaus H, Grabosch C, et al. (2016) A Tunable Scaffold of Microtubular Graphite for 3D Cell Growth. ACS Appl Mater Interfaces 8: 14980-14985. [Crossref]
- Lupan O, Postica V, Mecklenburg M, Schulte K, Mishra YK, et al. (2016) Low powered, tunable and ultra-light aerographite sensor for climate relevant gas monitoring. J Mater Chem A 4: 16723-16730.
- Sammalkorpi M, Krasheninnikov A, Kuronen A, Nordlund K, Kaski K (2004) Mechanical properties of carbon nanotubes with vacancies and related defects. Physical Review B 70: 245416.
- Rafiee R, Pourazizil R (2014) Evaluating the influence of defects on the Young’s modulus of carbon nanotubes using stochastic modeling. Materials Research 17: 758-766.
- Ishiyama U, Cuong NT, Okada S (2015) Influence of defects on carrier injection in carbon nanotubes with defects. Japanese Journal of Applied Physics 54: 065101.
- Kim YA, Hayashi T, Osawa K, Dresselhaus MS, Endo M (2003) Annealing effect on disordered multi-wall carbon nanotubes. Chemical Physics Letters 380: 319-324.
- Castillejos E, Bachiller-Baeza B, Pérez-Cadenas M, Gallegos-Suarez E, Rodríguez- Ramos I, et al. (2012) Structural and surface modifications of carbon nanotubes when submitted to high temperature annealing treatments. Journal of Alloys and Compounds 536: 460-463.
- Ni ZH, Wang HM, Luo ZQ, Wang YY, Yu T, et al. (2010) The effect of vacuum annealing on graphene. J Raman Spectrosc 41: 479-483.
- Zhao J, Zhang Y, Su Y, Huang X, Wei L, et al. (2012) Structural improvement of CVD multi-walled carbon nanotubes by a rapid annealing process. Diam Relat Mater 25: 24-28.
- Jiang F, Zhang L, Jiang Y, Lu Y, Wang W (2012) Effect of annealing treatment on the structure and properties of polyurethane/multiwalled carbon nanotube nanocomposites. J Appl Polym Sci 126: 845-852.
- Niven JF, Johnson MB, Juckes SM, White MA, Alvarez NT, et al. (2016) Influence of annealing on thermal and electrical properties of carbon nanotube yarns. Carbon 99: 485- 490.
- Jia K, Su Y, Chen Y, Luo J, Yang J, et al. (2015) Effects of defects and thermal treatment on the properties of graphene. Vacuum 116: 90-95.
- Xiao B, Yu X, Ding Y (2014) Theoretical investigation on the healing mechanism of divacancy defect in CNT growth by C2H2 and C2H4. J Mol Model 20: 2125.
- Karoui S, Amara H, Bichara C, Ducastelle F (2010) Nickel-Assisted Healing of Defective Graphene. ACS Nano 4: 6114-6120. [Crossref]
- Wang B, Pantelides ST (2011) Controllable healing of defects and nitrogen doping of graphene by CO and NO molecules. Physical Review B 83: 245403-1-245403-5.
- Tsetseris L, Pantelides ST (2009) Adsorbate-Induced Defect Formation and Annihilation on Graphene and Single-Walled Carbon Nanotubes. J Phys Chem B 113: 941-944.
- Dresselhaus MS, Dresselhaus G, Saito R, Jorio A (2005) Raman spectroscopy of carbon nanotubes. Physics Reports 409: 47-99.
- Dresselhaus MS, Jorio A, Saito R (2010) Characterizing Graphene, Graphite, and Carbon Nanotubes by Raman Spectroscopy. Annu Rev Condens Matter Phys 1: 89-108.
- Beams R, Cancado LG, Novotny L (2015) Raman characterization of defects and dopants in graphene. J Phys Condens Matter 27: 83002.
- Chandrasekaran S, Liebig W, Mecklenburg M, Fiedler B, Smazna D, et al. (2016) Fracture, failure and compression behaviour of a 3D interconnected carbon aerogel (Aerographite) epoxy composite. Compos Sci Technol 122: 50-58.
- Garlof S, Mecklenburg M, Smazna D, Mishra YK, Adelung R, et al. (2017) 3D carbon networks and their polymer composites: Fabrication and electromechanical investigations of neat Aerographite and Aerographite-based PNCs under compressive load. Carbon 111: 103-112.
- Ferrari AC (2007) Raman spectroscopy of graphene and graphite: Disorder, electron– phonon coupling, doping and nonadiabatic effects. Solid State Commun 143: 47- 57.
- Behler K, Osswald S, Ye H, Dimovski S, Gogotsi Y (2006) Effect of thermal treatment on the structure of multi-walled carbon nanotubes. J Nanopart Res 8: 615-625.
- Ferrari AC, Meyer JC, Scardaci V, Casiraghi C, Lazzeri M, et al. 2006. Raman Spectrum of Graphene and Graphene Layers. Phys Rev Lett 97: 187401. [Crossref]