Abstract
Purpose:To investigate demographic factors associated with surgical approach and outcomes for patients with T1/T2 hepatocellular carcinoma (HCC).
Methods:Retrospective analysis of the National Cancer Data Base, 2006-2012, who had undergone open or minimally invasive liver surgery (MIS).
Results:A total of 3,351 patients were identified. The initial surgical approach included 82.7% open (2,770) and 17.3% MIS (581). Patients with T1 tumors were more likely to have MIS than T2 tumors. MIS had superior short-term outcomes, including shorter post-operative length of stay (OR=-2.80 days, 95% CI -3.41 – -2.15, p<0.001) and a lower rate of unplanned readmissions (OR=0.50, 95% CI 0.30–0.084, p=0.007). However, the risk of margin positivity was higher in the MIS group (OR=1.63, 95% CI 1.04–2.56, p=0.32). No difference in survival was observed based on surgical approach (HR=0.94, 95% CI 0.74–1.20, p=0.63).
Conclusions:MIS offers significant surgical benefits for early clinical stage T1/T2 HCC.
KeyWords
hepatocellular carcinoma; minimally invasive surgery; robotic surgery
Introduction
Hepatocellular carcinoma (HCC) constitutes 4.6% of all new cancer cases and represents the fifth leading cause of cancer related death worldwide [1-3]. Although HCC is less common in the United States (US) compared to Africa and East Asia, the incidence of HCC in the US has doubled in the past twenty years [4,5]. Significant improvements in the survival of patients with HCC have been achieved, including earlier detection of HCC at a curative stage (T1/T2 tumors) and enhanced utilization of diverse curative modalities [6]. However, the prognosis of HCC remains one of the worst with a 5-year survival rate of 5.1% in the US [7]. Optimizing outcomes for HCC often requires access to the different treatment modalities, including surgery.
The application of minimally invasive surgery (MIS) using laparoscopic or robotic surgery for the treatment of HCC has increased in the last decade [8,9]. When compared to open surgery, studies have shown equivalent oncologic results for MIS. MIS offers several short-term benefits including shorter hospital length of stay, lower estimated blood loss, and decreased postoperative pain [9]. It is unclear, however, whether MIS provides similar oncologic outcomes to open surgery both in the short-term outcomes (such as margin positivity) and long-term outcomes (i.e. survival) for patients who require liver surgery.
Additionally, many studies have identified that a multitude of disparities exist in the care for patients with HCC, and that these disparities have significant impact on oncologic outcomes [10-13]. With the increasing application of MIS to HCC, it is of unique interest to determine if similar disparities exist with regard to surgical approach for patients who are offered resection. Thus, the objectives of this study were to characterize the demographic factors associated with surgical approach (open versus MIS) for patients with HCC and investigate both the short-term and survival outcomes associated with approach.
Methods
Patients
The National Cancer Data Base (NCDB) is jointly maintained by the American College of Surgeons Commission on Cancer (CoC) and the American Cancer Society (ACS). The NCDB captures approximately 70% of the country’s cancer cases through its participating hospitals. The Participant User File (PUF) for HCC was used. This study was deemed exempt from institutional review.
Patients with HCC were identified using International Classification of Diseases for Oncology, Third Edition (ICD-O-3) topography and morphology codes. Specifically, primary site code “C220” and “histologic type” codes “8170, 8172-8175” were used to select for patients. Demographic factors included patient age, gender, race, income, education, insurance status, facility type, and distance from treating facility. Tumor factors included clinical T stage, grade, and margin positivity. For the purposes of this study, patients with HCC treated with surgery from 2006–2012 were identified. Surgical approach is recorded by the NCDB and includes the open, laparoscopic, robotic, laparoscopic converted to open, and robotic converted to open approaches. Patients offered MIS but then converted to open were analyzed in their respective minimally invasive group, either laparoscopic or robotic, since one of our goals was to determine disparities in access to MIS and not to analyze the factors associated with conversion rates to open. Clinical, as opposed to pathologic, T stage was used to assess initial surgical approach because surgical decision making is based off clinical staging. Patients who were diagnosed with advanced T3 or T4 stage were excluded in order to focus primarily on clear surgical candidates.
The NCDB records definitive surgical procedures, including wedge resection, lobectomy, extended lobectomy, and transplantation. However, the type of surgical procedure as it relates to disparities was excluded from the analysis as this depends on the tumor characteristics such as size and proximity to vascular or biliary structures. Also, patients who had either with chemotherapy or radiation therapy were excluded to analyze the only factors associated with decision making between open surgery and MIS and to minimize disparities associated with access to other aspects of multimodal HCC treatment. Patients who received transplantation were excluded.
The association between surgical approach and patient characteristics was investigated. Analysis was performed to identify factors associated with short-term outcomes (margins, length of stay, unplanned readmission rates) and surgical approach. A separate analysis was performed to identify associations with patient factors and overall survival (OS). For this analysis, patients who had pathologic T3/T4 tumors that were clinically staged as T1/T2 were excluded in order to minimize the effects of stage migration on OS.
Statistical Analysis
Patient characteristics are reported using the mean, median and standard deviation for continuous variables; and using frequencies and relative frequencies for categorical variables. Comparisons were made between procedures using the Mann-Whitney U and Fisher’s exact tests for continuous and categorical variables, respectively.
The association between surgical approaches and short-term outcomes were examined using the Mann-Whitney U and Fisher’s exact tests. A propensity adjusted analysis for surgical approach and short-term outcomes was also performed. Propensity score were generated from a logistic regression model with surgical approach as the outcome and variables in Table 1 as the predictors. The sample used for the propensity adjusted analysis was trimmed such that each cohort had the same range of propensity scores; which were then stratified into ventiles. A stratified Mann-Whitney U test was used to compare LOS between surgical approaches, while the Cochran-Mantel-Haenzel test was used to compare the margin positivity and unplanned readmission rates between surgical approaches. Confidence intervals about the corresponding mean difference or odds ratios were obtained using standard methods.
Table 1. Baseline characteristics of patients with HCC who underwent surgery, grouped by surgical approach (open versus minimally invasive surgery, or MIS). Percentages in the Open and MIS columns are based on the totals by row in the Overall column, whereas percentages in the Overall column are based on the total N of 2,371. Highlighted rows indicate significant p values.
|
Open |
MIS |
Overall |
p value |
Overall |
N |
1,822 (76.8) |
549 (23.2) |
2,371 |
|
Age (years) |
Mean/Stda |
64.0/11.6 |
64.3/11.0 |
64.0/11.5 |
0.82 |
Gender |
Male |
1,313 (77.3%) |
385 (22.7%) |
1,698 (71.6%) |
0.39 |
|
Female |
509 (75.6%) |
164 (24.4%) |
673 (28.4%) |
|
Race |
White |
1,205 (76.5%) |
371 (23.5%) |
1,576 (67.3%) |
0.77 |
|
Black |
279 (76.4%) |
86 (23.6%) |
365 (15.6%) |
|
|
Asian |
280 (78.0%) |
79 (22.0%) |
359 (15.3%) |
|
|
Other |
34 (82.9%) |
7 (17.1%) |
41 (1.8%) |
|
Hispanic |
No |
1,645 (76.8%) |
497 (23.2%) |
2,142 (92.9%) |
0.70 |
|
Yes |
128 (78.5%) |
35 (21.5%) |
163 (7.1%) |
|
Insurance |
Private |
622 (78.2%) |
173 (21.8%) |
795 (33.9%) |
0.12 |
|
Medicaid |
185 (74.6%) |
63 (25.4%) |
248 (10.6%) |
|
|
Medicare |
907 (77.2%) |
268 (22.8%) |
1,175 (50.1%) |
|
|
Other |
34 (77.3%) |
10 (22.7%) |
44 (1.9%) |
|
|
Not insured |
56 (65.9%) |
29 (34.1%) |
85 (3.6%) |
|
Incomeb |
< $30,000 |
275 (74.5%) |
94 (25.5%) |
369 (16.0%) |
0.62 |
|
$30,000-34,999 |
342 (78.4%) |
94 (21.6%) |
436 (18.9%) |
|
|
$35,000-45,999 |
475 (76.6%) |
145 (23.4%) |
620 (26.9%) |
|
|
≥ $46,000 |
678 (77.1%) |
201 (22.9%) |
879 (38.2%) |
|
Educationc |
≥ 29% |
383 (77.4%) |
112 (22.6%) |
495 (21.5%) |
0.59 |
|
20-28.9% |
430 (78.5%) |
118 (21.5%) |
548 (23.8%) |
|
|
14-19.9% |
402 (76.7%) |
122 (23.3%) |
524 (22.8%) |
|
|
< 14% |
554 (75.3%) |
182 (24.7%) |
736 (32.0%) |
|
Facility Type |
Community Cancer Program |
24 (82.8%) |
5 (17.2%) |
29 (1.2%) |
0.22 |
|
Comprehensive |
385 (78.3%) |
107 (21.7%) |
492 (20.8%) |
|
|
Academic |
1,238 (76.6%) |
378 (23.4%) |
1,616 (68.2%) |
|
|
Integrated |
116 (71.2%) |
47 (28.8%) |
163 (6.9%) |
|
|
Other |
59 (83.1%) |
12 (16.9%) |
71 (3.0%) |
|
Days to Surgery |
Mean/Std |
42.8/46.7 |
46.7/52.3 |
43.7/48.1 |
0.28 |
Charlson-Deyod |
0 |
895 (79.9%) |
225 (20.1%) |
1,120 (47.2%) |
0.003 |
|
1 |
578 (73.7%) |
206 (26.3%) |
784 (33.1%) |
|
|
2 |
349 (74.7%) |
118 (25.3%) |
467 (19.7%) |
|
Grade |
Well Differentiated |
424 (77.9%) |
120 (22.1%) |
544 (24.8%) |
0.51 |
|
Moderately Differentiated |
931 (76.2%) |
290 (23.8%) |
1,221 (55.7%) |
|
|
Poorly Differentiated |
323 (78.0%) |
91 (22.0%) |
414 (18.9%) |
|
|
Undifferentiated |
12 (92.3%) |
1 (7.7%) |
13 (0.6%) |
|
Clinical T Stage |
cT1 |
1,347 (75.7%) |
433 (24.3%) |
1,780 (75.1%) |
0.021 |
|
cT2 |
475 (80.4%) |
116 (19.6%) |
591 (24.9%) |
|
Pathologic T Stage |
pT0 |
4 (66.7%) |
2 (33.3%) |
6 (0.3%) |
0.033 |
|
pT1 |
1,169 (72.3%) |
384 (27.8%) |
1,553 (65.5%) |
|
|
pT2 |
649 (79.9%) |
163 (20.1%) |
812 (34.2%) |
|
AFPe |
Negative |
626 (77.1%) |
186 (22.9%) |
812 (45.1%) |
0.69 |
|
Positive |
753 (76.2%) |
235 (23.8%) |
988 (54.9%) |
|
Surgery |
Wedge Resection |
1,166 (73.1%) |
430 (26.9%) |
1,596 (67.3%) |
<.001 |
|
Lobectomy |
530 (83.2%) |
107 (16.8%) |
637 (26.9%) |
|
|
Extended Lobectomy |
117 (93.6%) |
8 (6.4%) |
125 (5.3%) |
|
|
NOSf |
9 (69.2%) |
4 (30.8%) |
13 (0.5%) |
|
| |
|
|
|
|
|
|
|
a Standard deviation
b Income as reported by the NCDB is the median household income for the area of residence of a given patient based on zip code derived from the 2000 US Census.
c Education as reported by the NCDB is the percentage of adults in the area of residence of a given patient (based on zip code derived from the 2000 US Census) who did not graduate from high school.
d Charlson-Deyo comorbidity score is an estimate of comorbid conditions based on ICD-9 diagnosis codes. A score of 0 indicates no comorbidities. Point values are assigned to comorbid conditions based on severity. The NCDB truncates possible scores to 0, 1 and 2 due to the small proportion of cases exceeding a score of 2.
e Alpha fetoprotein
f not otherwise specified
A multivariable logistic regression model was used to identify patient characteristics that were significantly associated with MIS. The model was fit using Firth’s penalized function and odds ratios (ORs) were obtained from the fitted model, and represent the odds of having a MIS procedure as compared to open surgery for a change in the given patient characteristic. This model identifies which demographic and oncologic variables may have an independent association with MIS.
Overall survival (OS) was summarized by surgical approach summarized using standard Kaplan-Meier methods and compared using the log-rank test. A multiple variable Cox regression model was used to evaluate the association between OS and surgical approach while adjusting for other demographic and oncologic variables. The model was fit using Firth’s penalized function, and hazard ratios (HRs) were obtained from model estimates. All analyses were conducted in SAS v9.4 (Cary, NC) at a significance level of 0.05.
Results
A total of 12,880 patients were included in the NCDB liver PUF, 2006 to 2012. A total of 2,371 patients with clinically staged T1/T2 HCC had undergone surgery (excluding transplants and had not received chemotherapy or radiation). Surgical approach included 549 patients (23.2%) who had MIS and 1,822 (76.8%) who had open surgery. Table 1 shows the demographic and tumor characteristics for these patients.
The univariate and propensity adjusted analysis for surgical approach and short-term outcomes (Table 2) showed that MIS was associated with a shorter length of stay (LOS) after a surgery and a lower rate of unplanned readmissions. However, MIS was also associated with a higher rate of margin positivity. Table 2 and the remaining tables indicate the total number of patients used in each analysis, based on having complete available information (i.e. excluding patients with missing data).
Table 2. Univariate and propensity adjusted selected short-term outcomes based on approach, minimally invasive surgery (MIS) versus open. For the propensity adjusted analysis: margins is based on n=1,891 observations; length of stay is based on n=1,931; and unplanned readmission is based on n=1,927.
|
Univariate Analysis |
Propensity Adjusted |
Outcome |
Open |
MIS |
p value |
OR (95% CI) for
MIS vs. Open |
p value |
Margins Positivity |
81 (4.5%) |
34 (6.3%) |
0.11 |
1.58 (1.01, 2.48) |
0.045 |
Length of stay (days) |
7.5 (7.3) |
5.2 (5.7) |
<0.001 |
-2.3 (-2.7, -1.4)b |
< 0.001 |
Unplanned Readmission |
101 (5.6%) |
17 (3.1%) |
0.019 |
0.50 (0.29, 0.88) |
0.015 |
a Mean (Standard Deviation)
b Mean Difference for MIS - Open (95% CI)
Table 3 shows the patient factors associated choosing the initial surgical approach. Patient with private or Medicare were more likely to undergo open surgery as compared to uninsured patients. Patients with higher levels of education were more likely to undergo MIS. No other demographic factors were identified with respect to increased likelihood of undergoing MIS.
Table 3. Multivariable analysis of factors associated with surgical approach. Odds ratios (OR) indicate likelihood of minimally invasive surgery (MIS) versus the open approach. Highlighted rows indicate significant p values. Analysis based on 2,204 patients with complete data.
Variable |
|
OR (95% CI) |
p value |
Age |
1yr Increase |
1.00 (0.99, 1.01) |
0.81 |
Gender |
Female vs Male |
1.17 (0.94, 1.46) |
0.15 |
Race |
Black vs White |
0.99 (0.73, 1.34) |
0.72 |
|
Asian vs White |
0.97 (0.71, 1.31) |
|
|
Other vs White |
0.60 (0.25, 1.43) |
|
Hispanic |
2021 Copyright OAT. All rights reserv
Yes vs No |
1.00 (0.65, 1.54) |
0.99 |
Insurance |
Private vs Not insured |
0.50 (0.30, 0.82) |
0.035 |
|
Medicare vs Not insured |
0.49 (0.29, 0.81) |
|
|
Medicaid vs Not insured |
0.60 (0.35, 1.05) |
|
|
Other vs Not insured |
0.52 (0.22, 1.22) |
|
Income |
≥$46,000 vs <$30,000 |
0.65 (0.44, 1.00) |
0.18 |
|
$35,000-45,999 vs <$30,000 |
0.73 (0.51, 1.05) |
|
|
$30,000-34,999 vs <$30,000 |
0.73 (0.51, 1.05) |
|
Education |
<14% vs ≥29% |
1.52 (1.03, 2.25) |
0.045 |
|
14-19.9% vs ≥29% |
1.29 (0.89, 1.86) |
|
|
20-28.9% vs ≥29% |
1.09 (0.78, 1.53) |
|
Facility Type |
Comprehensive vs Community Cancer Program |
1.14 (0.43, 3.05) |
0.49 |
|
Academic vs Community Cancer Program |
1.25 (0.48, 3.26) |
|
|
Integrated vs Community Cancer Program |
1.64 (0.59, 4.54) |
|
|
Other vs Community Cancer Program |
0.98 (0.29, 3.32) |
|
Charlson-Deyo |
2 vs 0 |
1.38 (1.05, 1.80) |
0.010 |
|
1 vs 0 |
1.37 (1.09, 1.73) |
|
Clinical T |
T2 vs T1 |
0.80 (0.63, 1.01) |
0.06 |
The Kaplan-Meier curve for OS stratified by surgical approach is depicted in Figure 1. The median follow-up for the cohort was 45.8 months (range 0.0 – 130.0 months). For patients who had open surgery, the 3-year OS rate was 0.65 (95% CI 0.62 – 0.68) and the median OS was 55.1 months (95% CI: 51.2 – NR months). For patients who had MIS, the 3-year OS rate was 0.65 (95% CI 0.58 – 0.71) and the median OS was 54.4 months (95% CI 47.1 – NR). There was no significant difference in OS between the two groups (p = 0.48).
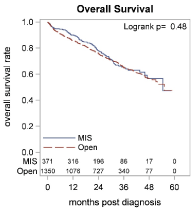
Figure 1. Kaplan-Meier curve of patients with hepatocellular carcinoma (HCC) from the National Cancer Data Base, 2006-2012, grouped by surgical approach – open versus minimally invasive surgery (MIS).
Table 4 shows the multivariable analysis of OS, whereby surgical approach did not have an association with survival. Factors associated with worse OS included higher Charlson-Deyo comorbidity score, greater pathologic stage, margin positivity, and longer hospital LOS. There were no disparate associations among race or socioeconomic factors on OS.
Table 4. Multivariable analysis of overall survival (OS) with surgery approach, open surgery versus minimally invasive surgery (MIS). Highlighted rows indicate significant p values. Analysis based on 1,439 patients with complete data.
Variable |
|
Hazard Ratio (95% CI) |
p value |
Age |
1yr Increase |
1.00 (0.99, 1.02) |
0.47 |
Gender |
Female vs Male |
0.90 (0.73, 1.12) |
0.36 |
Race |
Black vs White |
1.07 (0.81, 1.43) |
0.60 |
|
Asian vs White |
0.89 (0.64, 1.23) |
|
|
Other vs White |
1.42 (0.71, 2.84) |
|
Hispanic |
Yes vs No |
0.95 (0.63, 1.44) |
0.82 |
Insurance |
Private vs Not insured |
0.66 (0.39, 1.10) |
0.23 |
|
Medicare vs Not insured |
0.87 (0.52, 1.46) |
|
|
Medicaid vs Not insured |
0.78 (0.44, 1.40) |
|
|
Other vs Not insured |
0.68 (0.27, 1.72) |
|
Income |
≥$46,000 vs <$30,000 |
0.77 (0.51, 1.14) |
0.56 |
|
$35,000-45,999 vs <$30,000 |
0.87 (0.60, 1.26) |
|
|
$30,000-34,999 vs <$30,000 |
0.93 (0.66, 1.31) |
|
Education |
<14% vs ≥29% |
1.46 (0.99, 2.16) |
0.18 |
|
14-19.9% vs ≥29% |
1.43 (0.99, 2.06) |
|
|
20-28.9% vs ≥29% |
1.39 (1.00, 1.93) |
|
Facility Type |
Comprehensive vs Community Cancer Program |
0.94 (0.36, 2.49) |
0.08 |
|
Academic vs Community Cancer Program |
0.73 (0.28, 1.90) |
|
|
Integrated vs Community Cancer Program |
0.55 (0.20, 1.54) |
|
|
Other vs Community Cancer Program |
0.98 (0.29, 3.29) |
|
Distance |
10 mile increase |
1.00 (0.99, 1.01) |
0.38 |
Charlson-Deyo |
2 vs 0 |
1.50 (1.17, 1.92) |
0.005 |
|
1 vs 0 |
1.13 (0.90, 1.42) |
|
Path T-stage |
pT2 vs pT1 |
1.66 (1.36, 2.02) |
<.001 |
|
pT0 vs pT1 |
0.43 (0.03, 7.20) |
|
Surgery |
Lobectomy vs Wedge Resection |
1.20 (0.97, 1.49) |
0.45 |
|
Extended vs Wedge Resection |
1.21 (0.80, 1.84) |
|
Discussion
Studies of MIS in liver surgery have established the oncologic equivalency to open surgery and proposed additional short-term benefits. Laparoscopic liver surgery has been shown to be superior to open surgery in terms of intraoperative blood loss, pain control, duration of hospital stay, resumption of oral intake, and complication rates [14,15]. The benefits of MIS may be particularly advantageous for cirrhotic patients, given the potential for lower levels of parietal and hepatic injury and the preservation of venous and lymphatic collateral circulation [16]. The safety and feasibility of the MIS approach and its short-term benefits for HCC patients with chronic liver dysfunction have been demonstrated by several series [17-19].
Using a large nationwide database, this study confirmed some of these benefits, namely with respect to post-operative length of stay and unplanned readmission rates, which can serve as surrogate markers for post-operative complications [20]. However, MIS was associated with a higher rate of margin positivity in this study. This was in contrast to other studies, which have concluded no difference in margin status between patients who had open surgery or MIS for HCC [14,21,22]. These previous studies were comprised of much smaller cohorts or represented a meta-analysis of smaller studies totaling 1,238 patients. This may have accounted for the difference observed in this study with regard to margin status, which included over 3,300 patients.
Significant disparities have been noted in presentation, treatment, and survival among patients with HCC. For example, racial disparities have been identified whereby minority populations have poorer outcomes or access to care [8-10]. Other disparities in addition to race have been described for patients with HCC. For example, socioeconomic factors like insurance status may limit access to appropriate preventive and surveillance measures resulting in a higher incidence among older, uninsured patients [11,12]. These disparities have been associated with decreased recommendations for surgery with resectable HCC, decreased rates of surgery even when recommended, and poorer overall survival (OS) in patients of lower socioeconomic status [10,12]. For this reason, there is an important need not only to study the pathogenesis of HCC but also to address clinical disparities in care, which may improve the treatment of HCC among patients from different races and socioeconomic backgrounds.
Interestingly, patients who were uninsured or who had Medicaid had a higher likelihood of undergoing MIS than those with private insurance, who were more likely to undergo open surgery. The reason for this finding is unclear and may be related to factors that are not captured in the NCDB, such as surgeon preference to surgical approach at facilities that differ with respect to payer mix. Furthermore, patients with higher level of education were more likely to undergo MIS compared to less educated patients. This may be reflective of patient preference for MIS given the understanding of improved short-term benefits and equivalent OS as shown by this study and others.
Of note, previous studies investigating disparities in HCC care using the NCDB have been performed. In a published study using the NCDB [23], increasing age was associated with decreased rates of undergoing surgery, but older patients tended to have surgery sooner than younger patients after deciding to have surgery. In addition, patients over age 65 tended to have more MIS than under 64-year old patients. In this study, African-Americans had the longest time to surgery [23]. Our findings were unique in that the focus was on surgical approach. Using the NCDB, disparities specific to surgical approach for clinical T1 and T2 early stages HCC were identified. As the costs associated with MIS are better addressed, disparities in surgical approach for HCC may become increasingly relevant.
Treatment facility type (academic center, comprehensive cancer center, and community center) was not identified as being independently associated with surgical approach. While our findings did not identify treatment facility as a factor associated with either short-term or long-term outcomes, an earlier study utilizing the NCDB had shown that surgical volume was associated with improved OS [24]. While treatment volume was not a specific focus of this study, it may also have important associations with disparities related to access to care and treatment outcomes.
We recognize that there were important limitations to our study. By excluding patients who received neoadjuvant/adjuvant chemotherapy or radiation, there were fewer patients in the analysis, and disparities related to systemic treatment were not evaluated. There may have been some discordance in the reporting of race between self-reported and registry records, which may have possibly impacted the results. However, any reporting bias would have likely been random and not affected the main findings of the study. One of the potential limitations of the NCDB is that surgeries in which the approach was not specified by the operating surgeon may be grouped with the open procedures. The open approach is technically defined by the NCDB as open surgery as well as surgery with unspecified surgical approach, and there is a lack of granularity to the data in terms of hand-assisted MIS procedures. Similar to surgeon preference or expertise with MIS as discussed above, the individual patient preference or bias for a given surgical approach is not captured by the NCDB. The particular decision-making process for a given patient is complex and dependent on several intangible factors, which have been shown to influence treatment in the setting of colorectal cancer [25,26]. This may also apply in the setting of HCC. The NCDB does not provide specific treatment center characteristics other than geographic area and academic/community designation, so further investigations into nuanced differences between hospitals and what affects treatment decisions are limited. Prior patient surgeries are not accounted for in the NCDB. Previous abdominal incisions and the increased presence of intra-abdominal adhesions may potentially influence the decision-making process regarding surgical approach. Lastly, there was also the presence of missing information, which limited sample size and potentially influenced the conclusions.
In summary, MIS for early stage T1/T2 HCC has superior short-term benefits including post-operative LOS and unplanned readmission. In contrast to other studies consisting of smaller cohorts, margin positivity was found to be higher for patients undergoing MIS than open surgery. However, OS was equivalent regardless of surgical approach. This study also identified unique disparities in surgical approach for early stage HCC. As MIS becomes increasingly applied to HCC and further study validates long-term equivalency of MIS as compared to open surgery with the added short-term benefits, disparities in surgical approach may become more relevant to patient care.
Acknowledgements
We thank the Commission on Cancer of the American College of Surgeons and American Cancer Society for access to the NCDB Participant User File.
This work was supported by the National Cancer Institute (NCI) grant P30CA016056.
MK, EG, and CP collected and analyzed the data. KA performed the statistical analysis. MK and CP drafted manuscript. MK, EG, and SN contributed to the study design. SN provided critical revision. Each author approved the final version.
Disclosures
Drs. MK, EG, KA, CP, and SN have no conflicts of interest or financial ties to disclose.
Disclaimers
The American College of Surgeons Committee on Cancer provided the Participant User File from the National Cancer Data Base, but has not reviewed or validated the results or conclusions of our study.
References
- Ferlay J, Shin HR, Bray F, Forman D, Mathers C, et al. (2010) Estimates of worldwide burden of cancer in 2008: GLOBOCAN 2008. Int J Cancer 127: 2893-2917. [Crossref]
- Forner A, Llovet JM, Bruix J (2012) Hepatocellular carcinoma. Lancet 379: 1245-1255.
- Morton DL, Thompson JF, Cochran AJ, Mozzillo N, Nieweg OE, et al. (2014) Final trial report of sentinel-node biopsy versus nodal observation in melanoma. N Eng J Med 370: 599-609.
- Altekruse SF, Henley SJ, Cucinelli JE, McGlynn KA (2014) Changing hepatocellular carcinoma incidence and liver cancer mortality rates in the United States. Am J Gastroenterol 109: 542-553. [Crossref]
- Kim DY, Han KH (2012) Epidemiology and surveillance of hepatocellular carcinoma. Liver Cancer 1: 2-14. [Crossref]
- De Angelis R, Sant M, Coleman MP, Francisci S, Baili P, et al. (2014) Cancer survival in Europe 1999-2007 by country and age: results of EUROCARE--5-a population-based study. Lancet Oncol 15: 23-34. [Crossref]
- El-Serag HB (2012) Epidemiology of viral hepatitis and hepatocellular carcinoma. Gastroenterology 142: 1264-1273.e1. [Crossref]
- Nassour I, Polanco PM (2016) Minimally Invasive Liver Surgery for Hepatic Colorectal Metastases. Curr Colorectal Cancer Rep 12: 103-112. [Crossref]
- Okunrintemi V, Gani F, Pawlik TM (2016) National Trends in Postoperative Outcomes and Cost Comparing Minimally Invasive Versus Open Liver and Pancreatic Surgery. J Gastrointest Surg 20: 1836-1843. [Crossref]
- Tan D, Yopp A, Beg MS, Gopal P, Singal AG (2013) Meta-analysis: underutilisation and disparities of treatment among patients with hepatocellular carcinoma in the United States. Aliment Pharmacol Ther 38: 703-712. [Crossref]
- Zak Y, Rhoads KF, Visser BC (2011) Predictors of surgical intervention for hepatocellular carcinoma: race, socioeconomic status, and hospital type. Arch Surg 146: 778-784.
- Yu JC, Neugut AI, Wang S, Jacobson JS, Ferrante L, et al. (2010) Racial and insurance disparities in the receipt of transplant among patients with hepatocellular carcinoma. Cancer 116: 1801-1809. [Crossref]
- Nathan H, Hyder O, Mayo SC, Hirose K, Wolfgang CL, et al. (2013) Surgical therapy for early hepatocellular carcinoma in the modern era: a 10-year SEER-medicare analysis. Ann Surg 258: 1022-1027. [Crossref]
- Yin Z, Fan X, Ye H, Yin D, Wang J (2013) Short- and long-term outcomes after laparoscopic and open hepatectomy for hepatocellular carcinoma: a global systematic review and meta-analysis. Ann Surg Oncol 20: 1203-1215. [Crossref]
- Afaneh C, Kluger MD (2013) Laparoscopic liver resection: lessons at the end of the second decade. Semin Liver Dis 33: 226-235. [Crossref]
- Lock JF, Malinowski M, Seehofer D, Hoppe S, Rohl RI, et al. (2012) Function and volume recovery after partial hepatectomy: influence of preoperative liver function, residual liver volume, and obesity. Langenbecks Arch Surg 397: 1297-1304. [Crossref]
- Ito K, Ito H, Are C, Allen PJ, Fong Y, et al. (2009) Laparoscopic versus open liver resection: a matched-pair case control study. J Gastrointest Surg 13: 2276-2283. [Crossref]
- Croome KP, Yamashita MH (2010) Laparoscopic vs open hepatic resection for benign and malignant tumors: An updated meta-analysis. Arch Surg 145: 1109-1118. [Crossref]
- Vitali GC, Laurent A, Terraz S, Majno P, Buchs NC, et al. (2016) Minimally invasive surgery versus percutaneous radio frequency ablation for the treatment of single small (</=3 cm) hepatocellular carcinoma: a case-control study. Surg Endosc 30: 2301-2307. [Crossref]
- Gabriel E, Attwood K, Thirunavukarasu P, Al-Sukhni E, Boland P, et al. (2016) Predicting Individualized Postoperative Survival for Stage II/III Colon Cancer Using a Mobile Application Derived from the National Cancer Data Base. J Am Coll Surg 222: 232-244. [Crossref]
- Franken C, Lau B, Putchakayala K, DiFronzo LA (2014) Comparison of short-term outcomes in laparoscopic vs open hepatectomy. JAMA Surg 149: 941-946. [Crossref]
- Lee KF, Chong CN, Wong J, Cheung YS, Wong J, et al. (2011) Long-term results of laparoscopic hepatectomy versus open hepatectomy for hepatocellular carcinoma: a case-matched analysis. World J Surg 35: 2268-2274. [Crossref]
- Hoehn RS, Hanseman DJ, Jernigan PL, Wima K, Ertel AE, et al. (2015) Disparities in care for patients with curable hepatocellular carcinoma. HPB (Oxford) 17: 747-752. [Crossref]
- Chapman BC, Paniccia A, Hosokawa PW, Henderson WG, Overbey DM, et al. (2017) Impact of Facility Type and Surgical Volume on 10-Year Survival in Patients Undergoing Hepatic Resection for Hepatocellular Carcinoma. J Am Coll Surg 224: 362-372. [Crossref]
- Polite BN, Dignam JJ, Olopade OI (2005) Colorectal cancer and race: understanding the differences in outcomes between African Americans and whites. Med Clin North Am 89: 771-793. [Crossref]
- Polite BN, Sing A, Sargent DJ, Grothey A, Berlin J, et al. (2012) Exploring racial differences in outcome and treatment for metastatic colorectal cancer. results from a large prospective observational cohort study (BRiTE). Cancer 118: 1083-1090. [Crossref]