Objective: To characterize the temporal processing and Frequency-Following Response in adults with behavioral dysphonia.
Method: Twelve individuals of both sexes, aged 19 to 57 years, diagnosed with behavioral dysphonia were submitted to behavioral assessment (sequential memory test for verbal and nonverbal sounds, duration pattern test, and random gap detection test) and electrophysiological assessment (Frequency-Following Response) of central auditory processing.
Results: In the behavioral assessment, the most changed tests were the duration pattern (50%) and the random gap detection tests (58%), while in the electrophysiological assessment a greater number of changes was observed in the F and O components, characterized by both latency delay and absence of the component. The greatest change among these components took place in the O-wave (50%).
Conclusion: Changes were evidenced in both the behavioral and electrophysiological assessments of the central auditory processing in adults with behavioral dysphonia.
auditory evoked potential, hearing, auditory perception, dysphonia, voice
Hearing is the sense through which sounds are perceived. For people to receive and analyze sounds, they have in their organism a set of structures named auditory system, comprising the peripheral and central auditory pathways. Auditory processing is a series of time-sequenced mental operations that enable the person to perform acoustic and metacognitive sound analyses [1]. These auditory system mechanisms and processes are responsible for the phenomena known as sound localization and lateralization, auditory discrimination, auditory temporal aspects, and auditory performance in competing noise and degraded signals [2,3].
Temporal processing is one of the physiological auditory mechanisms that make up the auditory processing behavioral assessment.
Many auditory information characteristics are influenced by time, and temporal auditory processing is defined as the perception of sound or its changes within a limited and defined time - i.e., it is the ability to perceive or differentiate stimuli presented in quick succession [4,5].
Temporal information acoustic decoding represented by the analysis of duration, frequency, gap, and order of different stimulus patterns, provide essential information to the central auditory nervous system (CANS). All these cues, which conduct the temporal processing, are important to speech perception since the speech structure has quickly changing acoustic signals [4,6].
There is an interrelationship between the auditory analysis of the suprasegmental aspects and the adjustments of voice patterns, especially related to prosody, which reinforces the importance of assessing the temporal aspects in voice disorders.
It is known that people with dysphonia whose underlying factor is poor vocal behavior, are usually unable to perceive their own voice disorders. This makes self-monitoring more difficult and, consequently, they continue to abuse their voice with inadequate voice patterns [7]. However, few studies have correlated voice disorders with central auditory processing disorders in adults [7-10].
Central auditory processing can be assessed with behavioral auditory tests (which assess the auditory skills) or electrophysiological examinations (which assess the CANS bioelectric activity)- e.g., the frequency-following response (FFR). In this potential, the waves elicited with a /da/ speech stimulus are identified, whose analysis involves the latency (ms) and amplitude (µV) of the response components [11,12].
Auditory evoked potentials can provide electrophysiological evidence of the auditory skills with objective measures that aid in therapeutic monitoring. The information of the FFR components, whose clinical application is considerably recent, can complement and/or corroborate that provided by the behavioral tests, particularly the procedures that assess temporal processing.
Hence, although voice therapy involves indirect stimulation of the auditory skills, the hypothesis in this study is that the existence of central auditory processing disorders in people with dysphonia can contribute to unsuccessful voice therapy regarding the learning and maintenance of the adequate voice pattern. Consequently, changes may be observed in the behavioral and electrophysiological assessments, which remain stable even after the voice rehabilitation process, as there is no specific and controlled auditory stimulation.
Based on these assumptions, this study aimed to characterize the temporal processing and the auditory evoked potential with complex stimuli (FFR) in adults with behavioral dysphonia with and without lesions.
This study was conducted at a public Electrophysiology and Auditory Processing Outpatient Center. It was approved by the institution’s Research Ethics Committee under number 1.199.177. All the individuals were recruited from a waiting list for speech-language-hearing therapy at the institution’s voice outpatient center. They were informed about the procedures to which they would be submitted and signed the informed consent form before they participated in the study.
The inclusion criteria for the study were auditory thresholds within normality standards (i.e., up to 25 dB HL), speech recognition with over 92% of correct answers, type A tympanometric curves bilaterally, contralateral stapedial acoustic reflexes present at adequate levels, right-hand preference, Brazilian Portuguese spoken as a first language, literacy, and an otorhinolaryngological diagnosis of dysphonia with stroboscopy.
Voice changes resulting from vocal nodules, mid-posterior cleft, and anterior and anteroposterior fusiform cleft were included. The exclusion criteria of the study were the presence of minimal larynx structural changes, Reinke’s edema, contact ulcers, granuloma, and leukoplakia.
As a result of these criteria, the sample comprised 12 individuals of both sexes, aged 19 to 57 years, diagnosed with behavioral dysphonia with and without lesions.
The participants were submitted to a battery of procedures that included clinical history, auditory electrophysiological assessment, and auditory processing behavioral assessment, described below.
In clinical history, the individuals answered a speech-language-hearing anamnesis to investigate aspects related to voice and hearing.
The following tests were used to study the temporal processing: sequential memory test for verbal (SMV) and nonverbal sounds (SMNV), pure-tone duration pattern test (DPT), and random gap detection test (RGDT).
The SMV and SMNV were respectively conducted with four syllables and four instrument sounds, presented in three different sequences with no visual cue.
Three pure tones with different durations -long (L) (500 ms) and short ones (C) (250 ms)- were simultaneously presented in a certain order to both ears in the DPT. The person was asked to name the stimuli in the order they were presented.
In the RGDT, clicks were presented with varied interstimulus time gaps, and the individuals were instructed to inform whether they were hearing one or two tones. The equipment used for the auditory electrophysiological assessment was the Smart EP, manufactured by Intelligent Hearing Systems. The auditory evoked potentials were researched in an electrically and acoustically treated room. The participants were seated in a comfortable reclining chair and instructed to remain quiet to avoid myogenic artifacts. Before starting the examinations, their skin was prepared with abrasive paste, and the electrodes were fixed with adhesive tape, positioned as follows: active electrode (positioned at CZ – vertex), reference electrodes (positioned at A1 and A2- left and right earlobes), and ground electrode (positioned at the forehead), according to the 10-20 system. The electrodes’ impedance measure was set below 5 kΩ, and the difference between each electrode, at 2 kΩ at the most.
To register the FFR, the syllable used was /da/, presented monaurally to the right ear at 80 dB SPL. The polarity was alternated, the presentation speed was of 10.9 stimuli per second, a gain of 100.0k, high-pass filter at 50 Hz, low-pass filter at 3000 Hz, stimulus duration of 40 ms, and window of 60 ms [13].
During the examination, the subjects were instructed to watch a video of their interest so they would not pay attention to the acoustic stimulus presented in the assessment.
The mean value of two 3,000-stimulus sweepings was calculated. At the end of the collection, the two sweepings were summed to obtain the V, A, D, E, F, and O components, and the slope of the summed wave.
The visual comparative analysis was conducted using the individual tracings and the summed tracing to find the replicability of the peaks and to confirm the presence of the components. This potential was analyzed considering the V, A, D, E, F, and O wave latency values13. The slope was calculated with the following formula:
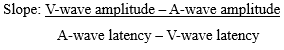
The V-wave amplitude was established as the difference between the point corresponding to 0.0μV of the wave and the maximum positive value. As for the A-wave amplitude, it was the difference between the point corresponding to 0.0μV and the maximum negative value.
The statistical analysis was conducted with descriptive analysis (mean, standard deviation, minimum, median, and maximum), and the qualitative analysis was carried out with the comparison of the normal and changed results. Peason's Linear Correlation Test was used for the correlation analysis and the significance level was set to 0,05 or 5%.
The characterization of the temporal processing of people with dysphonia was made with descriptive analyses of the SMV, SMNV, DPT, and RGDT, presented in table 1.
Table 1. Descriptive measures for the sequential memory test for verbal and nonverbal sounds, duration pattern test, and random gap detection test in the total sample (n:12).
SMV: sequential memory test for verbal sounds; SMNV: sequential memory test for verbal sounds; DPT: duration pattern test; RGDT: Random Gap Detection Threshold
It is necessary to assess the temporal processing in people with dysphonia because the adequate auditory perception of the temporal aspects is essential to voice production and monitoring.
The most changed tests were the DPT (50%) and RGDT (58%), which are related to the temporal ordering and resolution skills-i.e., the person’s ability to recognize the acoustic aspects of a signal (intensity, duration, and frequency) and its changes in a given period [5]. Findings that agree with the present study were observed in adults with dysphonia involving the temporal ordering [7,9,10] and temporal resolution skills [10]. Similarly, other studies conducted with occupational voice users also verified changes in these skills [14-16].
Temporal auditory tests are particularly related to the suprasegmental aspects of speech, such as rhythm, intonation, and tonicity. In the voice rehabilitation process, it is suggested that voice changes requiring the analysis of acoustic aspects be made during the voice exercises. These must be self-perceived to maintain this more adequate pattern in these people’s daily lives. Thus, a loss in the auditory analysis could lead to inadequate auditory perception, reflecting on the aspects of voice production and the continued voice abuse or misuse.
In the FFR assessment, a greater number of changes was observed in the F and O components, due to either latency delay or absence of the component. No studies were found in the literature correlating the FFR with dysphonia, which reinforces the originality of this study.
These components refer to independent mechanisms in speech sound decoding. The F-wave is characterized by the sustained portion (FFR) of the stimulus, thus reflecting on the harmonical structure and the periodicity of the sound structure of the vowel. The O-wave, in its turn, is the response to the stimulus offset [11,12].
The most frequent change among these components in the sample of the study was in the O-wave (50%). A crucial characteristic of the neurons that specifically decode the duration is that they respond to the stimulus offset. Hence, the C-wave may be responding to the offset of the stimulus’ initial pulse, while the O-wave is responding to the offset of the whole stimulus.
Considering these findings in the context of the sample of the present study, the data suggest a relationship between deficits in the perception of the temporal characteristics of the acoustic stimulus and speech decoding, related to losses in the temporal resolution auditory skill – which is the minimum time required by the ear to perceive acoustic events [17].
Speech comprehension depends on the ability to establish the meaning in the quick temporal changes and the spectral information present in consonants and vowels. Therefore, the auditory system must first decode these acoustic cues that change in time.
When studying the correlation between the behavioral and the electrophysiological assessments of the auditory processing, only one positive association was found between the SMV and the A-wave latency. Hence, the increase in the number of correct answers in the SMV would correspond to the increase in the A-wave latency. This is an undesired correlation since the increased number of correct answers means better performance, whereas the increased latency means worse performance. However, the temporal aspects in the SMV involve more sequential memory for verbal sounds, whereas the A-wave latency is more related to the initial decoding of the stimulus and the quick temporal changes. Thus, such a positive correlation is explained by their being independent physiological mechanisms.
The presence of changes in the FFR in people with dysphonia reveals one more datum related to the loss in the perception of temporal processing skills, already observed in the behavioral assessment. Therefore, coinciding findings were observed between the behavioral and electrophysiological assessments of the auditory processing in this group of people, demonstrating the need to include the auditory processing assessment in patients with dysphonia.
Despite the great advancements in auditory electrophysiology, some aspects still need to be better clarified. Hence, it must be used as a complement in the diagnosis of CAPD -i.e., always combined with central auditory behavioral assessment.
The FFR has been increasingly used in recent years, contributing especially to the diagnosis of language disorders. According to the results observed in the present study, this potential proved to be relevant in furnishing data on the temporal aspects of the auditory processing of people with dysphonia. Thus, it can be used as a biological marker of the therapeutic intervention, evidencing the effects of neuronal plasticity on the auditory pathway when stimulated.
The main limitation of this study was the difficulty to compose the sample. The strict sample criteria were necessary in order to find a true correlation of the impact of CAPD associated with dysphonia, thus excluding any factor predisposing to a worsened dysphonia condition.
Further studies are needed with larger samples and other forms of intervention (for instance, the acoustically controlled auditory training), which would strengthen the evidence the findings obtained in this study.
Also, studies involving the other FFR analyses in the frequency domain (fundamental frequency and harmonics) would provide additional information on the contribution of this evoked potential in the test battery of central auditory processing assessment.
Changes were observed in the temporal ordering and resolution skills in the behavioral assessment, and the latency delay or absence of components in the auditory processing electrophysiological assessment in adults with behavioral dysphonia.
- Pereira LD, Navas ALGP, Santos MTM (2002) Auditory processing: An association approach between hearing and language. Manole, São Paulo, Brazil. p75-93.
- American Speech-Language-Hearing Association (1996) Central auditory processing: Current status of research and implications for clinical practice. Am J Audiol. Available from: http://www.asha.org/policy.
- American Academy of Audiology (2010) Clinical Practice Guidelines for the Diagnosis, Treatment and Management of Children and Adults with Central Auditory Processing Disorder. Available from: http://www.audiology.org.
- Samelli AG, Schochat E (2008) Auditory processing, temporal resolution and gap detection test: literature review. Rev CEFAC 10: 369-377.
- Bellis TJ (2003) Assessment and management of central auditory processing disorders in the educational setting: from science to practice. Thomson: Delmar Learning.
- Smith NA, Trainor LJ, Shore DI (2006) The development of temporal resolution: between-channel gap detection in infants and adults. J Speech Lang Hear Res 49: 1104-1013. [Crossref]
- Ramos JS, Feniman MR, Gielow I, Silverio KCA (2017) Correlation between Voice and Auditory Processing. J Voice 32: 25-36. [Crossref]
- Gimenez TN, Medrano LMM, Sanchez ML (2004) Study of central auditory function - duration and pitch - in voice disorders. Rev Cefac 6: 77-82.
- Buosi MMB, Ferreira LP, Momensohn-Santos TM (2013) Auditory perception of teachers with voice disorders. Audiol Commun Res 18: 101-108.
- Bez ACM, Luiz CBL, Paes SM, Azevedo RR, Gil D (2020) Electrophysiological and Behavioral Evaluation of Auditory Processing in Adults with Dysphonia. Int Arch Otorhinolaryngol.
- Russo N, Nicol T, Musacchia G, Kraus N (2004) Brainstem responses to speech syllables. Clin Neurophysiol 115: 2021-2030. [Crossref]
- Russo N, Nicol T, Zecker S, Hayes EA, Kraus N (2005) Auditory training improves neural timing in the human brainstem. Behav Brain Res 156: 95-103. [Crossref]
- Skoe E, Krizman J, Anderson S, Kraus N (2015) Stability and plasticity of auditory brainstem function across the lifespan. Cereb Cortex 25: 1415-1426. [Crossref]
- Silva MCB, Cunha MB, Souza CCL (2006) Auditory processing assessment in telemarketing operators. Rev CEFAC 8: 536-542.
- Ishii C, Arashiro PM, Pereira LD (2006) Ordering and temporal resolution in professional singers and in well tuned and out of tune amateur singers. Pró Fono 18: 285-292. [Crossref]
- Paoliello KBG, Pereira LD, Behlau M (2019) Voice Quality and Auditory Processing in Subjects with and Without Musical Experience. J Voice S0892-1997(18)30315-1.
- Johnson KL, Nicol T, Zecker S, Kraus N (2007) Auditory brainstem correlates of perceptual timing deficits. J Cogn Neurosci 19: 376-385. [Crossref]