Abstract
Previously, we demonstrated that wastewater provided useful information to track the viral load and variants for the SARS-CoV-2 pandemic and can also identify other pathogens present in our communities. However, implementation of wastewater-based epidemiology has mainly been at the level of wastewater treatment plants, losing the granularity that would be necessary for public health departments to enact targeted actions in response to identified outbreaks. Here, we propose a multi-tiered approach to wastewater-based epidemiology which pairs wastewater treatment plant sampling with upstream samples at key locations within the community sewer system. We furthermore demonstrated the capability to take the data gleaned from wastewater and incorporate it into an interactive dashboard that could be used by public health epidemiologists to identify areas within their municipality which need focused public health resources such as contact tracing, outbreak sourcing or other responses to localized outbreaks of infectious disease. This database backed dashboard synthesizes and presents wastewater-based pathogen surveillance data at the community level in conjunction with human demographic information. The data provided can be used to predict changes in case counts in the community based on the wastewater data, identify emerging outbreaks, and can be used to identify trends in infectious disease epidemiology for different demographics.
Key words
genomics, pathogen tracking dashboard, SARS-CoV-2, viral load, wastewater
Introduction
Outbreak tracking can identify communities that need public health action to reduce morbidity. However, when the pathogen is novel, as in the case of SARS-CoV-2 (virus of coronavirus disease 2019 (COVID-19)), the time needed to develop and validate a diagnostic test was too slow for effective response. COVID-19 spread rapidly, with asymptomatic carriers increasing the difficulty of containment. Due to lack of tests, state governments resorted to lockdown measures and social distancing guidelines which distressed the general population. Wastewater-based epidemiology (WBE) has emerged as a way to track SARS-CoV-2 within the population and identify regional trends [1-5]. Most WBE focuses on screening wastewater treatment plants to track the abundance of SARS-CoV-2 in large populations using quantitative polymerase chain reaction (qPCR) [6-9]. However, treatment plant analysis is too high level for targeted community policy; increased treatment plant viral loads cannot be easily attributed to specific neighbourhoods. Furthermore, pathogens in the wastewater travel a long distance to the plant, increasing potential for signal degradation or loss.
We propose a multi-tiered approach to WBE (Figure 1) that pairs treatment plant and upstream subsystem samples. Analysis of samples at the treatment plant provide a high-level view of pathogen transmission in the region, while the subsystem samples provide more detailed and accurate insights into pathogen prevalence in high-risk communities. We conducted a pilot study demonstrating that WBE within a community provides pathogen abundance trends over time from targeted and untargeted RNA sequencing [2]. Here, we present a proof-of-concept dashboard for stakeholders to make local policy decisions based on this new data stream. Continuous untargeted wastewater monitoring will identify novel pathogens early, enabling quick diagnostic to roll out to reduce the impact of emerging diseases and prevent outbreaks from reaching pandemic status.
Figure 1. Our approach is to gather wastewater samples not only at the treatment plants, but also at strategically chosen upstream locations where inferences could be made at a community or building level. This would enable targeted policy decisions to be made for communities and high-priority locations
Materials and methods
An overview of our methodology is shown in Figure 2 below. This effort involved the collection and analysis of targeted wastewater samples, the training of a predictive model relating the SARS-CoV-2 viral load in those samples to case counts in the catchment, the formation of a database to hold this information, and the development of a browser-based dashboard to visualize analysis results and predictions from the models.
Figure 2. Overview of the sample collection and analysis process
Working together with the Great Lakes Environmental Center (GLEC), our team collected several weeks of wastewater samples from four manhole access locations in Toledo, Ohio in July 2020 (Figure 3). One goal of the project was to relate SARS-CoV-2 viral loads to recorded case counts, so two of these access points were located directly outside St. Vincent Medical Center and Promedica Toledo Hospital to facilitate this comparison. For similar reasons, a third site was chosen outside a nursing home, Continuing Healthcare Solutions. The fourth site served as a test case and was located at a junction point outside the Cresthaven neighbourhood; all effluent from that neighbourhood passed through this access point.
Figure 3. The four sampling sites in Toledo were collected outside two hospitals (1-2), a nursing home (3), and a neighborhood (4). The locations of the manholes used for the sampling appear as white circles on the aerial views on the right. The map on the left was created using OpenStreetMap (https://www.openstreetmap.org/)
GLEC retrieved one-litre samples from each of these four locations on the dates indicated in Table 1. Each sample was collected between 10 AM and 12 PM ET, and in most cases the flow rate was sufficient to obtain a 24-hour composite sample using an ISCO 3700C autosampler. In the first week, three of the sites had low flow conditions and “grab” samples were collected; in this case, a bucket is used to collect wastewater prior to running the autosampler to ensure the one-litre target is reached. Along with the physical samples, we also recorded metadata such as the time and method of collection, the pH of the samples, and the ambient air and water temperature when the sample was collected.
|
7/14/2020 |
7/22/2020 |
7/28/2020 |
St. Vincent |
Grab |
24Hr |
24Hr |
17 |
28 |
31 |
17.4 |
9 |
110.6 |
Promedica |
24Hr |
24Hr |
24Hr |
DNP |
DNP |
DNP |
2.3 |
1 |
DND |
CHS |
Grab |
24Hr |
24Hr |
0 |
0 |
1 |
DND |
DND |
0.6 |
Cresthaven |
Grab |
24Hr |
24Hr |
UNK |
UNK |
UNK |
39.1 |
4.5 |
2.9 |
Sample Type (Grab vs. 24Hr Composite)
# of Positive Cases in Upstream Population
Viral Load (genome copies per milliliter)
DNP: Did Not Provide; DND: Did Not Detect; UNK: Unknown |
Table 1. Sample Collection Details
Our team extracted RNA from each sample and analyzed it using two methods. First, we used reverse transcription qPCR analysis to target SARS-CoV-2 and determine its viral load within the sample; the measurements resulting from that analysis appear in Table 1. Second, we used metagenomic analysis to sequence, assemble, and align the RNA to determine the presence and abundance of all biological organisms found in the samples. In this way, we were able to specifically target the spread of COVID by monitoring SARS-CoV-2 levels but could also track the spread of other pathogens throughout the upstream populations. RNA analysis procedures were described in detail in our previous work [2].
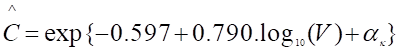
Along with the data collection efforts, we also developed a predictive model that related SARS-CoV-2 viral load in the wastewater samples to reported case counts in the upstream catchment. Since the targeted data we were collecting would not be sufficient to train such a model, we acquired additional data from the Ohio Coronavirus Wastewater Monitoring Network [10], which is a collaboration between the Ohio Department of Health (ODH), the Ohio Environmental Protection Agency (EPA), and the Water Resources Center at The Ohio State University (OSU-WRC). The dataset contained paired qPCR viral loads and upstream catchment case counts for 62 water treatment plants within the state of Ohio from January 2020 through March 2021. Using these data, we trained a Poisson regression model using the log viral load as the predictor and incorporated a random effect for the treatment plant. The final model is given by Equation (1) below, where  is the estimated case count, V is the viral load in gc/mL, and α_k is the random offset term for treatment plant k, which contributed the wastewater sample.
A parity plot of observed vs. predicted case counts is shown in Figure 4 below. The grey points in the plot are the training data from ODH at the treatment plant level. Due to the simplicity of the model, overfitting was not a concern. However, we were not sure whether our targeted wastewater samples from manholes in Toledo would show the same pattern. The green dots show the model fit for those samples from St. Vincent and Continuing Healthcare Solutions that had paired viral load and reported case count data, using the baseline offset of α_k=0. They seem consistent with the overall pattern seen for the ODH treatment plant data, which suggests that one could use the same model for relating viral load to case counts regardless of where the wastewater samples are being collected.
Figure 4. The plot above shows the case count model fit on the training data from the Ohio Dept. of Health (gray) with the targeted wastewater data overlaid in green. Predictions on our samples (green) used an offset of α_k=0. The targeted data appear consistent with what was seen on the treatment plant level dataset
To provide a proof of concept for how targeted wastewater samples can be used to inform local policy decisions, we also built an application to store, model, and explore the wastewater analysis results in the context of the community upstream of the sampling site. Underlying this application is a SQL database built to store qPCR and metagenomic analysis results, sample metadata, and site information. In addition, we obtained U.S. Census data at the tract level from 2020 in the state of Ohio for a variety of demographic variables including age, race, employment (median earnings and industry), household (size and space), citizenship status, and health insurance (% insured); these data were also stored in the database.
We built the front end of our application around the latest Angular framework and used the industry-standard Bootstrap user interface library for maximum portability. Data visualization was handled through the commercial library Any chart (charts), open-source libraries Bootstrap tables (for tabular data display), and Leaflet (for mapping). An ASP.Net Web API framework formed the middleware layer of the application, serving information from the database to the front end.
Results
A screenshot of the final dashboard is shown in Figure 5. The Wastewater Pathogen Tracking Dashboard (WPTD) is split into three panels. The map panel (A) shows the spatial locations of the wastewater sampling sites. The overlay panel (B) allows the user to select demographic variables to overlay on the map. Finally, the analysis panel (C) shows metadata and results associated with the sample analyses for the selected site including identified mutations in the genome of SARS-CoV-2. The main panel (A) contains a map of Toledo, Ohio and the surrounding region, with census tracts indicated with a colored overlay. The colors correspond to census data selected in the overlay panel (B) below it. The red circles on the map indicate the four sampling sites, each of which can be selected through a mouse click, which populates the tabs in the analysis panel (C) and generates a tooltip indicating the name of the site, the census tract, and the value of the demographic variable of interest for that tract.
Figure 5. The Wastewater Pathogen Tracking Dashboard (WPTD) is split into three panels. The map panel (A) shows the spatial locations of the wastewater sampling sites. The overlay panel (B) allows the user to select demographic variables to overlay on the map. Finally, the analysis panel (C) shows metadata and results associated with the sample analyses for the selected site including identified mutations in the genome of SARS-CoV-2
The analysis panel contains most of the information in the application and has tabs to view results at the census tract level, the sampling site level, and the individual sample level. The Census tab (Figure 6) shows a table of population demographics for the census tract to which the selected site belongs. In the future, we plan to expand this tab to include graphical summaries (bar charts, histograms, scatterplots, etc.) to further explore the relationship between sets of demographic variables within the census tract.
Figure 6. The census tab contains a table of tract-level information for all of the demographic categories in the database
The Site tab (Figure 5). The Wastewater Pathogen Tracking Dashboard (WPTD) is split into three panels. The map panel (A) shows the spatial locations of the wastewater sampling sites. The overlay panel (B) allows the user to select demographic variables to overlay on the map. Finally, the analysis panel (C) shows metadata and results associated with the sample analyses for the selected site including identified mutations in the genome of SARS-CoV-2., C) aggregates information from all samples at the selected site and shows distributions of pathogens over time. Since a large focus of the project was on better understanding and responding to the COVID-19 pandemic, this tab also includes the case count predictions from the model described in Section 2 and summary-level information about the SARS-CoV-2 analysis, including the coverage of the genome and the presence of spread of mutant strains of the virus.
The plots of viral load and predicted case counts for the four sites in Figure 7 show trends that track well with the truth data we had for St. Vincent and CHS, with errors in the case count predictions on the order of single digits. The results for Promedica and Cresthaven show that both locations appeared to have declining cases over the three-week period. Aside from the plots of viral loads and case counts, the Site tab also contains daily summaries of any mutations observed in the SARS-CoV-2 genomes (see the bottom right of Figure 5. The Wastewater Pathogen Tracking Dashboard (WPTD) is split into three panels. The map panel (A) shows the spatial locations of the wastewater sampling sites. The overlay panel (B) allows the user to select demographic variables to overlay on the map. Finally, the analysis panel (C) shows metadata and results associated with the sample analyses for the selected site including identified mutations in the genome of SARS-CoV-2.), whether any known clades were detected, and the genome coverage. This feature enables tracking of SARS-CoV-2 variants over time across the community. Our findings related to SARS-CoV-2 variants are discussed in more detail in [2]. The final set of plots in the Site tab are heatmaps that show the abundances of different infectious diseases over time (Figure 8). The heatmaps in the Site tab show the abundance of pathogens resulting from the metagenomic analysis of the wastewater sample. The heatmap on the left shows total contig counts for organisms falling into one of several infection categories. By selecting one of these categories (e.g., Opportunistic peritoneal organism), a second heatmap shows a breakdown of the individual detected organisms from that category. A hover-over mouse effect indicates the abundance in percentages instead of counts; this abundance is also captured in the shade of blue for the cell.). These abundances are derived from the metagenomic analysis and are provided for individual organisms as well as at a higher-level categorization by the type of infections they cause.
Figure 7. SARS-CoV-2 viral loads and predicted case counts for the four sites. The predicted case counts for St. Vincent track well with the known patient count (17, 28, and 31 for the three weeks), and overpredict for Continuing Healthcare Solution, which had only 1 case on July 28. There is a clear trend for both Promedica and Cresthaven of declining case counts over this period, but without a known case count for these locations, this trend cannot be verified
Figure 8. The heatmaps in the Site tab show the abundance of pathogens resulting from the metagenomic analysis of the wastewater sample. The heatmap on the left shows total contig counts for organisms falling into one of several infection categories. By selecting one of these categories (e.g., Opportunistic peritoneal organism), a second heatmap shows a breakdown of the individual detected organisms from that category. A hover-over mouse effect indicates the abundance in percentages instead of counts; this abundance is also captured in the shade of blue for the cell
Figure 9. The Sample tab allows the user to look at abundances of different organism categories over time (top left), a table of individual organism counts with filtering and sorting options (bottom left), and a starburst chart of all organism abundances (right). Clicking on the startburst chart allows the user to drill down into specific categories of organisms and see the results for individual species and strains
Finally, the Sample tab of the analysis panel gives an in-depth summary of the metagenomic results for the wastewater samples (Figure 9). To orient the user, the top plot of the tab provides a summary of contig counts for different categories of organisms over time (Figure 9, top left). Below it is a table with filtering and sorting controls to allow the user to better understand the distribution of organisms detected in each sample (Figure 9, bottom right). The tab also includes an interactive starburst chart (Figure 9, right) that arranges the organisms within a hierarchical structure that can be navigated by the user to understand the biological distribution of the sample at different resolutions.
Discussion and conclusion
Wastewater sampling at the treatment plant level is an effective way to monitor large population centers and understand broad trends in disease transmission over time. However, to make local policy decisions, the resolution is not sufficient to understand where within those population centers the outbreaks are occurring. Typically, treatment plants service populations on the order of entire small towns or large portions (e.g., one third or one half) of larger cities. Our proposed solution to this problem is to complement it with the collection of additional samples upstream of the treatment plant at carefully chosen locations that allow for finer resolution inferences to be made. The dashboard described here shows a proof of concept for how we envision the information from those targeted samples being used to drive local policy decisions. To prevent or identify new outbreaks, strategic sampling can take place at points of entry to the country or state, such as airports, train or metro stations, and also healthcare settings where individuals will seek treatment. Highly populated neighbourhoods or larger gathering places such as large corporations or event centers may also be good locations for monitoring the public during outbreaks.
Specifically, by combining sample locations, census data, and abundances of pathogens like SARS-CoV-2 in a single view, a dashboard will allow policymakers to synthesize information about where outbreaks are unfolding over time, which populations are affected, and which of those populations are most vulnerable. Furthermore, by incorporating statistical model predictions into the dashboard, as we did with a Poisson regression model, scientific concepts like viral load can be translated into outcomes of interest like case counts. This again makes it easier for the user of the dashboard to make connections between the wastewater sample data and the impact on the community. As a result, decision-makers can more quickly and effectively deploy resources to relieve stressors on specific populations or enact different policies at the community level based on the need. When a drastic increase in the prevalence of an infectious disease is observed by wastewater genomic based epidemiology, this will enable focused efforts for tracking variants in that outbreak through targeted sequencing, which would be presented by the mutation analysis features of the dashboard. This targeted information further enables policy decisions to be made in public health response to infectious disease outbreaks.
Acknowledgements
The authors would like to thank Dennis McIntyre, Great Lakes Environmental Center for sample collection; Angela Tucker, City of Toledo, Division of Environmental Services for help with sample site identification and access to sewers; and Dr. Jennifer Gottschalk, Toledo-Lucas County Public Health Department, and St. Vincent’s Heart Center for providing COVID-19 case data. This work was supported by the National Science Foundation, grant #2033137.
References
- Crits-Christoph A, Kantor RS, Olm MR, Whitney ON, Al-Shayeb B, et al. (2021) Genome Sequencing of Sewage Detects Regionally Prevalent SARS-CoV-2 Variants. mBio 12: e02703-e02720. [Crossref]
- Spurbeck RR, Minard-Smith A, Catlin L (2021) Feasibility of neighborhood and building scale wastewater-based genomic epidemiology for pathogen surveillance. Sci Total Environ 789: 147829. [Crossref]
- Ahmed W, Angel N, Edson J, Bibby K, Bivins A, et al. (2020) First confirmed detection of SARS-CoV-2 in untreated wastewater in Australia: A proof of concept for the wastewater surveillance of COVID-19 in the community. Sci Total Environ 728: 138764. [Crossref]
- Haramoto E, Malla B, Thakali O, Kitajima M (2020) First environmental surveillance for the presence of SARS-CoV-2 RNA in wastewater and river water in Japan. Sci Total Environ 737: 140405. [Crossref]
- Kitajima M, Ahmed W, Bibby K, Carducci A, Gerba CP, et al. (2020) SARS-CoV-2 in wastewater: State of the knowledge and research needs. Sci Total Environ 739: 139076. [Crossref]
- Hart OE, Halden RU (2020) Computational analysis of SARS-CoV-2/COVID-19 surveillance by wastewater-based epidemiology locally and globally: Feasibility, economy, opportunities and challenges. Sci Total Environ 730: 138875. [Crossref]
- Bivins A, North D, Ahmad A, Ahmed W, Alm E, et al. (2020) Wastewater-Based Epidemiology: Global Collaborative to Maximize Contributions in the Fight Against COVID-19. Environ Sci Technol 54: 7754-7757. [Crossref]
- Westhaus S, Weber FA, Schiwy S, Linnemann V, Brinkmann M, et al. (2021) Detection of SARS-CoV-2 in raw and treated wastewater in Germany - Suitability for COVID-19 surveillance and potential transmission risks. Sci Total Environ 751: 141750. [Crossref]
- Wu F, Zhang J, Xiao A, Gu X, Lee WL, et al. (2020) SARS-CoV-2 Titers in Wastewater Are Higher than Expected from Clinically Confirmed Cases. mSystems 5: e00614- e00620. [Crossref]
- OCWMN (2021) COVID-19 DASHBOARD: Ohio Coronavirus Wastewater Monitoring Network. [Online] Available at: https://coronavirus.ohio.gov/wps/portal/gov/covid-19/dashboards/other-resources/wastewater. [Accessed 26 May 2021]