Study objective: To evaluate the anatomical changes of the pelvic floor and urinary system following delivery, and to analyse the relationship to mode of delivery and obstetrical procedures. Furthermore, this study aims to discuss and analyse the performance of transperineal sonography of the urethrovesical junction for the diagnosis of female stress urinary incontinence.
Methods: Pubovesical angle (PVA) and retrovesical angle (RVA) were evaluated ultrasonographically in controls and pregnant women 24 hours and then 12 weeks after delivery. All patients completed the ICIQ-SF questionnaire. At 24 hours after the delivery, RVA mean values in pregnant women were higher than controls’ and still higher when compared with RVA values after 12 weeks.
Results: A linear relationship between PVA modifications and infant weight at birth was demonstrated, as well as between PVA and neonatal biparietal diameter. Besides, the study confirms the occurrence of changes at the urethrovesical junction following disengagement manoeuvres and shoulder dystocia. The role of BMI in affecting the recovery of perineal anatomy after delivery has also been investigated.
Conclusion: PVA has shown to be higher in symptomatic women with a cut-off value for the onset of incontinence of 74°, with a sensitivity of 100% and a specificity of 72.5%.
stress urinary incontinence, vaginal delivery, urethrovesical junction, ultrasound, pregnancy
Stress urinary incontinence (SUI) is a pathological condition defined as complaint of involuntary loss of urine on effort or physical exertion including sporting activities, sneezing, or coughing [1]. It often follows a sudden increase of the intra-abdominal pressure as by coughing, sneezing, running or heavy lifting.
A large community- based epidemiological study (EPINCONT: Epidemiology of Incontinence in the County of Nord-Trøndelag), performed in collaboration with the National Health Screening Service of Norway, showed that twenty-five percent of the adult women have involuntary loss of urine and the mean age of the affected women was 53.2 years versus 47.7 years for the continent women [2]. The prevalence of incontinence increased with increasing age.
Parity is also an important risk factor for female urinary incontinence (UI) in fertile and peri- and early post-menopausal ages. A strong association has been demonstrated between parity and UI, especially stress and mixed incontinence. In age groups affected by parity, the first delivery had a higher impact than each of the next, even if parity was not related to severity [3].
The risk of urinary incontinence is particularly higher both among women who have had vaginal deliveries and those who have had cesarean sections than among nulliparous ones. The EPINCONT study showed that the individual risk of moderate or severe incontinence would be decreased by 5-10% if all deliveries had occurred by cesarean section when compared to the average risk of UI after vaginal deliveries. But this decrease would apply only until 50 years of age, since there was found no association between urinary incontinence (UI) and mode of delivery in older age groups. The mechanical strain during labour may add to the risk associated with pregnancy itself [4].
The aim of the present study is to investigate the relationship between vaginal delivery and stress incontinence and evaluate the use of pubovesical angle (PVA) as a predictive tool for the onset of SUI in patients with singleton pregnancy and age < 40.
Previous reported data showed that the pubovesical angle (PVA) measurement represent a valid tool for the early evaluation of modifications in urethrovesical junction (UJV) mobility in patients with singleton pregnancy and age ≤40 years [5].
This longitudinal observational study was carried out in our university hospital centre in Salerno from January 2014 to April 2016. We recruited 160 near-term pregnant women, satisfying the inclusion and exclusion criteria to participate in the study.
Inclusion criteria were normal proceeding pregnancy, nulliparity, gestational age between 38th and 41st week, woman age ≤ 41 years, vaginal delivery, family history of SUI. Exclusion criteria were caesarean delivery, SUI predating current pregnancy, chronic bladder infections, structural abnormalities of the urinary tract, previous pelvic surgeries involving the urinary system and pelvic floor, previous stillbirths, diabetes, hypertension, connective tissue diseases, neurodegenerative diseases. A group of 80 women was enrolled as control group: patients in the group were between 20 and 28 years with a BMI between 20 and 30, had never been pregnant before and no history of pelvic floor surgery.
Approval of the Institutional Review Board was obtained prior to the beginning of the study in our university hospital centre in Salerno and all patients signed informed consent before entering the study.
All patients underwent perineal ultrasonography, performed by three different experienced gynaecologists using an Aloka Prosound Alfa-10 ultrasound machine, with a 3.5-MHz convex probe. A translabial-perineal approach was used, with one scan in controls and two scans in pregnant women at 24 hours and 12 weeks after delivery (Figure 1). All patients also completed the ICIQ-SF questionnaire [6] at each visit.
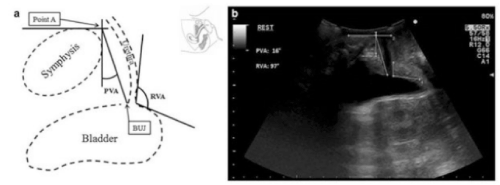
Figure 1. Ultrasonographic measurement of PVA and RVA. a) schematic representation b) ultrasonographic image
With a bladder volume of 100-150 mL, three different ultrasound images were recorded: the UVJ was evaluated at rest (R), during coughing (C) and maximum Valsalva (V) manoeuvre, with each value reported as the mean value of the three different measurements collected by gynaecologists, in order to maximize the accuracy.
As previously reported by studies of Cosimato et al. [5] and Wijma et al. [7], we defined the position of the bladder neck as the angle between the line going from the UVJ to the intersection of two reference lines passing respectively along the posterior and inferior margins of the pubic symphysis (PVA). The posterior retrovesical angle (RVA), and its changes in response to increases in abdominal pressure were also evaluated.
The Kolmogorov-Smirnov test was used to assess data distribution. The Mann- Whitney test was used to assess differences between the two groups of pregnant women and controls. The value of the angle between the highest measure in asymptomatic women and the lowest in symptomatic women was considered to be the reference. Starting from this angle, the positive predictive value (PPV), negative predictive value (NPV), sensitivity and specificity for the prediction of SUI symptoms were determined. Statistical significance was set at a p value of <0.05.
During the period of study, among the 160 women examined after 24 hours from the delivery, 66 of them did not attend for the 12th week evaluation and therefore were excluded from analysis. A total number of 94 patients and 80 controls was examined.
BMI, birth weight, weight gain, family history, incontinence during pregnancy, occurrence of vaginal tears and type of vaginal deliveries were considered for the analysis. Among the 94 examined patients, 58% was in normal-weight (BMI=18.5-24.9), 38% in over- weight (BMI=25-29.9), 2% obese (BMI>30) and 2% under-weight (BMI<18.5), with a mean BMI of 25. Forty-eight women gained more than 14 kg during pregnancy (52.2%). Newborns had a mean birth weight of 3207 g (3000-3500g) and a mean bi-parietal diameter of 9.0 cm.
It was also found that 32 patients suffered from UI during the 3rd trimester (35.6%), 24 women suffered from constipation during the pregnancy (26.1%), while 10 had physical stress for intense working activity (10.6%). 8 women (8.5%) had family history of UI. Mode of vaginal delivery (spontaneous or operative), occurrence and degree of vaginal lacerations, use of episiotomy and occurrence of shoulder dystocia were also noted. 1st degree lacerations were found in 22 women (24.4%), 2nd degree ones in 14 women (15.6%) and 3rd degree in 2 women (2.2%). Episiotomy was performed in 58 women (61.7%), Kristeller maneuver and vacuum extraction were applied respectively in 18 (19.1%) and 4 women (4.25%), while shoulder dystocia complicated 4 deliveries (4.25%). The mean duration of the second stage of labour was 30 minutes; only 4 patients delivered within 15 minutes after the beginning of pushing (4.25%).
Ultrasonographic PVA findings in pregnant women are shown in the figure 2: after 24 hours, PVA mean value was 49.8 at rest, 65.9 during cough and 69.6 during Valsalva. After 12 weeks, values decreased to 44.5, 55.9 and 66.2.
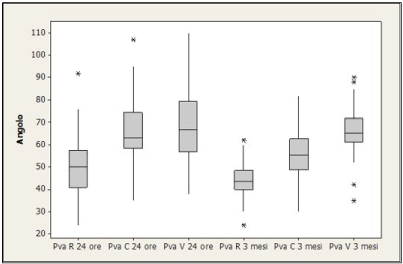
Figure 2. PVA values after 24 h and 3 months
RVA measurement: after 24 hours the mean value is 182.9 at rest, 189.4 during cough and 195.8 during Valsalva. After 12 weeks, values respectively regress to 162.1, 181.8 and 198.3 (Figure 3).
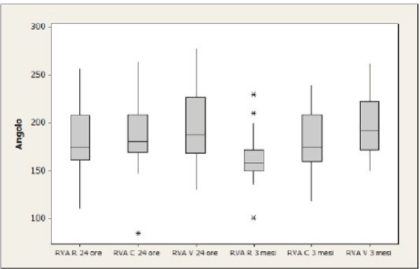
Figure 3. RVA values after 24 h and 3 months
Measurements in control group: PVA and RVA result to have lower levels than delivered women. PVA mean value is 28.7 at rest, 37 during cough and 48.3 during Valsalva; RVA values are 130.6 at rest, 138.2 during cough and 147.1 during Valsalva (Figure 4).

Figure 4. PVA and RVA mean values in control group
Data reported by Cosimato et al. [5] suggest that the impact of the pregnancy on anatomic- functional changes of UVJ is negligible: in pregnant women at term, PVA values were 28.2 ± 3.5 at rest, 36.8 ± 4.6 during cough, 48.9 ± 6.9 during Valsalva. These values are similar to controls’ in our study: PVA was found to be 28.7 ± 4.9 (rest), 37 ± 7.7 (cough) and 48.3 ± 12.6 (Valsalva).
RVA values in pregnant women [5] and our controls’ do not show significant differences: 127.0 ± 3.1 at rest (our value is 130.6), 132.6 ± 2.2 during cough (138.2), 140.4 ± 2.6 during Valsalva (147.1). Our study confirms that vaginal delivery and related factors have a strong impact on UVJ and its modifications: RVA mean values after 24 hours from the delivery were higher than controls’ values, they decrease after 12 weeks, without going back to normal values obtained in other studies [5].
The prevalence of SUI 3 months after VD appeared to be 10.6% compared to the prevalence of 35.6% of SUI during pregnancy. 6.3% of the affected patients did not suffer from SUI during pregnancy.
Most significant anatomical changes involved in the occurrence of SUI in puerperium occur within 24 hours after delivery (p-value 0.0045 rest, 0.009 cough) with a highly predictive value for Valsalva manoeuvre (p-value 0.02); shoulder dystocia (p-value 0.010) is significantly related to the steady increase of PVA values as reported in literature [8].
We found a linear relationship between neonatal weight at birth and PVA and biparietal diameter (BPD) and PVA (Figure 5), as previously shown in literature: Valsky et al. [9] demonstrated that a cranial circumference ≥ 35.5 cm is frequently cause of important perineal damages.
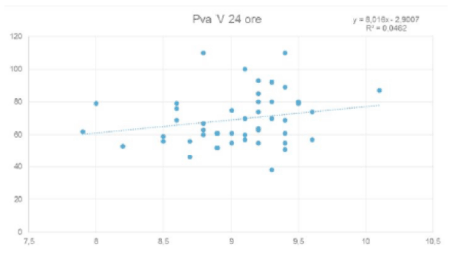
Figure 5. Relationship between PVA and biparietal diameter
Surprisingly, 3rd degree perineal tears did not cause modifications of the PVA at rest and during cough and Valsalva, even if RVA was strongly affected; this seem to be in contrast with previous studies reported in literature by Snooks et al. [10] and Handa et al. [11].
The present analysis showed that older age, smoking, weight gain, high BMI and the presence of SUI in pregnancy were not associated with anatomical changes both at 24 hours and at 3 months, in any measurement of PVA and RVA. This lack of correlation could be justified by the involvement of many factors in the onset of SUI other than increased motility of UVJ. Sangsawang showed that the increased volume and weight of uterus (but also collagen modifications and reduction of relaxin) play a crucial role in the development of SUI [12]. Not only the anatomical changes are the possible cause of incontinence, but also some notable events such as the increased intra-abdominal pressure, muscular depletion, nervous and vascular impairment which further affect urinary bladder muscle contraction and tension of pelvic floor.
Valsky demonstrates that a third stage lasting more than 120 minutes is detrimental for the pelvic floor [9], while Rogers showed that a long second stage has a moderate impact on the urinary incontinence [13]. Allen et al. found that the risk of developing UI rises with the prolongation of the second stage, especially in case of a pushing phase lasting more than 3 hours in nulliparous women and more than 2 hours in multiparous women [14]. PVA and RVA evaluations gave us additional information concerning the puerperal recovery of the perineal anatomy: a higher BMI is associated with a slower recovery of the perineal anatomy (p-value 0.01 for RVA- R, p-value 0.029 for RVA-C) as well as excessive weight gain during pregnancy (p-value 0.026 for PVA-V).
Evaluation 24 hours after delivery allowed us to identify the factors which cause the greatest impairment of the normal anatomy, such as shoulder dystocia, high birth weight, BMI, 3rd degree lacerations, Kristeller manoeuvre, episiotomy.
It’s important to point out how the significant modifications of the PVA after 24 hours affects the future development of UI in the following 3 months after delivery, even though PVA come back to normal value. In fact, it could be seen that PVA values are significantly higher in symptomatic women than in asymptomatic ones (Figure 6): the cut-off value of PVA in symptomatic women has been calculated in 74°, with a sensitivity of 100%, specificity of 72.5% and a negative predictive value of 100% (Figure 7).
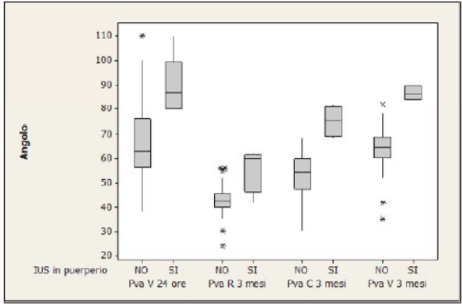
Figure 6. PVA values in symptomatic and asymptomatic women
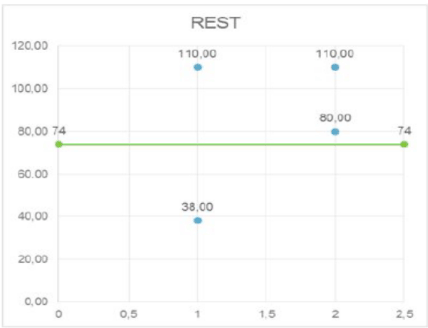
Figure 7. PVA cut-off value in symptomatic women
Pelvic floor ultrasound has been widely applied in clinical practice for studying the pelvic floor anatomy. It provides accurate information regarding the position of the uretro-vesical junction and the posterior wall of the bladder. In this study it was showed the modifications of the angles of UVJ and the posterior wall of the bladder following vaginal delivery (VD) and their correlation with onset of UI. We were able to identify the cut-off value of the defined angles at which the onset of a SUI can be expected after delivery. This represents a valid tool in order to minimize the most frequent risk factors involved in the onset of SUI in pregnant women. Furthermore, these evaluations could be useful in identifying women at risk of urinary incontinence, in order to select those to be scheduled for a specific pelvic floor rehabilitation program after VD.
Authors declare no conflict of interest. This research did not receive any specific grant from funding agencies in the public, commercial or not-for-profit sectors.
Lucio MA Cipullo: Project development, Manuscript writing
Gianmario E Poto: Manuscript writing
Marco Amato: Data collecting, Manuscript writing
Cosimo Cosimato: Data collecting, Project development
Maurizio Guida: Project development
- Haylen BT, de Ridder D, Freeman RM, Swift SE (2010) An International Urogynecological Association (IUGA)/International Continence Society (ICS) joint report on the terminology for female pelvic floor dysfunction. Int Urogynecol J 21: 5-26.
- Hannestad YS, Rortveit G, Sandvik H, Hunskaar S (2000) A community-based epidemiological survey of female urinary incontinence: The Norwegian EPINCONT Study. J Clin Epidemiol 53: 1150-1157. [Crossref]
- Rortveit G, Hannestad YS, Daltveit AK, Hunskaar S (2001) Age- and type-dependent effects of parity on urinary incontinence: The Norwegian EPINCONT Study. Obstet Gynecol 98: 1004-1010.
- Rortveit G, Daltveit AK, Hannestad YS, Hunskaar S, Norwegian EPINCONT Study (2003) Urinary incontinence after vaginal delivery or cesarean section. N Engl J Med 348: 900-907.
- Cosimato C, Cipullo LMA, Altieri V, Guida M (2015) Ultrasonographic evaluation of urethrovescical junction mobility: correlation with type of delivery and stress urinary incontinence. Int Urogynecol J 26:1495-1502.
- Tubaro A, Zattoni F, Prezioso D, Scarpa RM, Pesce F (2006) Italian validation of the international consultation on incontinence questionnaires. BJU International 97: 101-108.
- Wijma J, Weis Potters AE, De Wolf BT, Tinga DJ, Aarnoudse JG (2001) Anatomical and functional changes in the lower urinary tract during pregnancy. BJOG 108: 726-732. [Crossref]
- Kalis V, Chaloupka P, Turek J, Rokyta Z (2005) Risk factors for 3rd and 4th degree perineal ruptures during delivery. Ceska Gynekol 70: 30-36. [Crossref]
- Valsky DV, Lipschuetz M, Bord A, Eldar I (2009) Fetal head circumference and length of second stage of labor are risk factors for levator ani muscle injury, diagnosed by 3-dimensional transperineal ultrasound in primiparous women. Am J Obstet Gynecol 201: 91. e1-e7. [Crossref]
- Snooks SJ, Setchell M, Swash M, Henry MM (1984) Injury to innervation of pelvic floor sphincter musculature in childbirth. Lancet 2: 546-550. [Crossref]
- Handa VL, Blomquist JL, McDermott KC, Friedman S, Muñoz A (2012) Pelvic floor disorders after vaginal birth: effect of episiotomy, perineal laceration, and operative birth. Obstet Gynecol 119: 233-239. [Crossref]
- Sangsawang B, Sangsawang N (2013) Stress urinary incontinence in pregnant women: a review of prevalence, pathophysiology, and treatment. Int Urogynecol J 24: 901-912. [Crossref]
- Rogers RG, Leeman LM, Borders N, Qualls C (2014) Contribution of the second stage of labour to pelvic floor dysfunction: a prospective cohort comparison of nulliparous women. BJOG 121: 1145-1153. [Crossref]
- Allen VM, Baskett TF, O'Connell CM, McKeen D, Allen AC (2009) Maternal and perinatal outcomes with increasing duration of the second stage of labor. Obstet Gynecol 113: 1248-1258.


