Abstract
The present study assessed the effect of marjoram, propolis, and their combination against adenine induced chronic kidney disease (CKD) and renal dysfunction in male albino rats. Thirty-five rats weighing (200 ± 10 g) were divided into seven groups (n=5). The 1st control group, the 2nd adenine group (300 mg/kg), the 3rd marjoram group (100 mg/kg), the 4th propolis group (70 mg/kg), the 5th adenine + marjoram group, the 6th adenine + propolis group and the 7th adenine + marjoram + propolis group, all treatments were given orally for 30 consecutive days. The results showed that adenine treatment caused renal disorders with extensive tubulointerstitial fibrosis, tubular atrophy, crystal formation and marked vessel calcification in the kidney tissue associated with increasing the plasma renal biomarkers. The oxidative stress markers lipid peroxidation and protein carbonyl content were increased with a significant decrease in the activities of superoxide dismutase, catalase, and glutathione level. However, administration of marjoram and propolis separately or in combination improved kidney functions as they ameliorated the levels of renal function parameters and prevented oxidative stress. It can be concluded that marjoram and propolis in combination could cause an amazing improvement in the renal functions after adenine induced chronic renal failure and the histology of the kidney greatly recovered after the treatment with their combination. Thus, this surprise combination represents a new therapeutic strategy and gives good hope for a patient with CKD.
Key words
adenine, chronic kidney disease, marjoram, nephrotoxicity, propolis
Abbreviations
CKD: Chronic Kidney Disease, MDA: Malondialdehyde, SOD: Superoxide Dismutase, GSH: Glutathione, ROS: Reactive Oxygen Species. Ma: Marjoram, Pr: Propolis, Ad: Adenine.
Introduction
Chronic kidney disease (CKD) is progressively perceived as a worldwide general medical issue, and it is a determinant factor of poor health results. In spite of the fact that CKD has been better known in developed countries, many proofs show that the expanding of CKD is a significant problem in developing countries [1]. Adenine-induced chronic renal failure (CRF) where it significantly increased the plasma concentrations of urea and creatinine (Cr), and reduced creatinine clearance [2]. Moreover, it caused oxidative stress and DNA damage [3]. The adenine fed treatment produced the fast beginning of kidney disease with heavily tubulointerstitial fibrosis, tubular atrophy, crystal formation and marked vessel calcification [4].
Among the therapeutic activities, flavonoids that have antihypertensive, antidiabetic, and anti-inflammatory effects. Numerous flavonoids also have renoprotective effects that may be important in diseases such as diabetic nephropathy, glomerulonephritis and chemically-induced kidney insufficiency [5]. It was concluded that oxidative stress appeared to contribute in the pathogenesis of paracetamol-induced toxicity in rats and using moringa and marjoram herbal extracts as natural supplementary herbs beside their health benefits can protect against oxidative damage caused by paracetamol [6]. The possible mechanisms for the renal protective activity of O. majorana essential oil came from its ability scavenge free radicals that prevent lipid peroxidation and improve the antioxidant/ detoxification system in the kidney [7,8].
Propolis is one of the natural substances, collected by honeybees from sprouts, exudates of trees and other parts of the plants and is modified in the beehive by adding salivated secretions and wax [9]. Propolis extract has a strong protective effect against ethylene glycol induced hepatotoxicity and nephrotoxicity and has a potential to treat and stop urinary calculus, crystalluria, and proteinuria, as it controlled the level of magnesium, creatinine, sodium, potassium, and chloride. Propolis extract alleviates urinary protein excretion and ameliorates the deterioration of liver and kidney function caused by ethylene glycol [10].
Therefore, the study was aimed to evaluate the effect of O. majorana and propolis separately or in combination on chronic kidney disease in rats-model induced by adenine.
Materials and methods
Animals and experimental design
In this study, 35 male albino rats (Rattus norvigicus) weighting (200 ± 10 g) were used. They obtained from the Animal House of Faculty of Veterinary Medicine, Zagazig University, Egypt. The animals housed in metal cages bedded with wood shavings and kept under standard laboratory conditions of aeration and room temperature at about 25oC. They were allowed to free access to standard diet and water ad libitum. The rats accommodated to the laboratory conditions for two weeks before being experimented. All applicable international, national, and/or institutional guidelines for the care and use of animals were followed and approved by the research scientific committee of the Zoology Department- Faculty of Science- Zagazig University.
Animals were divided into 7 groups (5 rats each) as follows: the 1st control group was received 1 mL of distilled water, the 2nd adenine group were daily given adenine (300 mg/kg) [11], the 3rd marjoram group were daily treated with marjoram extract (50 mg/kg) [12], the 4th propolis group were received propolis (70 mg/kg) [13], the 5th (adenine + marjoram group) were administered adenine (300 mg/kg) and followed by marjoram extract (100 mg/kg), the 6th adenine + propolis group were administered adenine (300 mg/kg) then propolis (70 mg/kg), the last 7th adenine + marjoram + propolis group were administered adenine (300 mg/kg), then marjoram extract (100 mg/kg) and propolis (70 mg/kg). All the animals were treated orally simultaneously daily for 30 consecutive days.
Chemicals
The adenine was obtained from Central Drug House (P), [CDH], Ltd, New Delhi, India as adenine sulfate which dissolved in distilled water. Propolis powder was obtained from Dosic IMP&EXP Co Ltd, China and dissolved in distilled water.
Extraction of the plant marjoram
The plant was collected from the Faculty of Pharmacy field at Zagazig University. Origanum majorana L. from the family Lamiaceae is commonly known as sweet marjoram, 650 g of the dried plant was extracted by using 70% alcohol, by maceration method at room temperature 3 times each time 48 hrs. The total extract after concentration by Rotary evaporator was 9.79 g.
Blood, urine and kidney sampling
At the end of the experimental period, all rats placed individually in metabolic cages to collect the urine voided in 24 hrs. Twenty-four hours after the end of the treated-rats were anesthetized by light inhalation of diethyl ether then sacrificed. Blood sample collected from the retro-orbital vein, that allows bleeding of the same animal more than one time with minimal stress [14] and the blood directly transported to tubes containing ethylenediamine tetra-acetic acid (EDTA). The blood and urine were centrifuged at 900 (r.p.m.) for 15 min. The plasma obtained, together with the urine specimens, was stored frozen at – 20oC for further biochemical analyses. Immediately after collection blood, the abdomen was exposed, dissected by longitudinal incision than the kidneys and the testes from each rat were removed, then one kidney was homogenized for biochemical measurements while the other kidney and one testis were fixed in 10% formalin for histological examination.
Preparation of tissue homogenate
The kidney was removed by the end of the experimental period and perfuse with normal saline to reduce red blood cell contamination. Part of kidney tissue was homogenized with 9 mL of 0.15 KCl buffer (pH 7.5) using a motor fitted homogenizer. The homogenate was centrifuged in an ordinary centrifuge at 5,000 rpm for 10 min to obtain 10% homogenate. The pellets were discarded and final supernatant as was used freshly for the determination of antioxidant enzymes activities, as well as the levels of glutathione (GSH) and lipid peroxidation [15].
Determination of plasma and urine creatinine (CREA) level
The creatinine was determined according to the method described by [16]. Creatinine in alkaline solution reacts with picric acid to form a colored complex. The rate of complex formation is measured calorimetrically at 492 nm.
Estimation of plasma and urine uric acid (UA) level
Colorimetric determination of uric acid, after deproteinization by a phosphotungstic reduction in alkaline medium (sodium carbonate), was carried out by spectrophotometer, using specific kits (BIO-ADWIC) according to Coalombe and Faurean [17]. Uric acid present in the sample reduces phosphotungstate to tungsten blue in alkaline medium (sodium carbonate). The phosphotungstic acid reagent is used as deproteinizing and color reagent.
Determination of plasma and urine urea nitrogen (BUN) level
Blood urea nitrogen (BUN) was assayed using urea Nitrogen® Flex reagent cartridge (DADE, BEHRING) using Dimension® clinical chemistry system (Automatic analyzer). The urea nitrogen method employs a urease/ glutamate dehydrogenase coupled enzymatic technique [18]. Urease specifically hydrolyzes urea to form ammonia and CO2. The ammonia is used by the enzyme glutamate dehydrogenase (GLDH) to reductively aminate a-ketoglutarate (a -KG), with simultaneous oxidation of reduced nicotinamide- adenine dinucleotide (NADH). The change in absorbance at 340 nm due to the disappearance of NADH is directly proportional to the BUN concentration.
Estimation of malondialdehyde (MDA) concentration
Kidney tissues MDA concentration was determined according to the method adopted by Mesbah et al. [19] that indicated to lipid peroxidation (LPO). Measurement of colonic MDA depends on the determination of thiobarbituric acid reactive substance content (TBARS). Thiobarbituric reacts with malondialdehyde in the acidic medium at a temperature of 100˚C for 15 min to form thiobarbituric acid reactive products. The absorbance of the resultant color product can be measured at 530 nm.
Estimation of protein carbonyl (PC) concentration:
Protein carbonyl content was measured in the kidney as protein hydrazone derivative, using 2,4- dinitrophenyl hydrazide [20].
Determination of antioxidant enzymes activity:
Kidney tissue superoxide dismutase (SOD) activity was determined according to the method described by Kakkar et al. [21]. The assay of SOD activity is based on the inhibition of the formation of NADH-phenazine methosulphate-nitro blue tetrazolium formazon. The color formed at the end of the reaction can be extracted into butanol and measured at 560 nm.
Renal catalase activity (CAT) was estimated according to Luck [22]. The UV absorption of hydrogen peroxide can be measured at 240 nm, whose absorbance drops when degraded by the enzyme catalase. From the drop-in absorbance, the enzyme activity can be calculated.
Estimation of reduced glutathione concentration
Reduced glutathione (GSH) in kidney tissue was determined according to the methods described by Moron et al. [23]. Determination of reduced glutathione was based on GSH reaction with DTNB (5, 5'-dithiobis nitro benzoic acid) produces a yellow-colored product of nitromercaptobenzoic acid that absorbs at 412 nm.
Measurement of renal minerals (sodium, potassium, calcium, and phosphorus) concentration
Tissue parts of kidney were washed with saline and distal water for the removal of blood, and later the fatty parts were removed and blotted over a piece of filter paper. Prior to dissection, tissue was perfused with a 50 mM of sodium phosphate buffer saline (100 mM Na2HPO4 / NaH2PO4) (pH 7.4) in an ice medium containing 0.16 mg/mL heparin to remove any red blood cells and clots. Then tissues were homogenized in 5–10 mL cold buffer per gram tissue and centrifuged at 5000 rpm for ½ hours. The resulting supernatant was transferred into Eppendorf tubes and preserved at -80oC in a deep freezer until used for various biochemical assays [24].
Histopathological studies
Tissue sampling and histopathological examination part of kidney tissue separated from either normal or treated groups of rats were fixed in 10% formal saline for twenty-four hours. The fixed tissues were processed habitually, embedded in paraffin, sectioned, deparaffinized and rehydrated then stained with hematoxylin and eosin (H&E) using typical techniques of Bancroft and Gamble [25] for histopathological examinations.
Statistical analysis
Data were collected, organized and stated as mean ± standard error of the mean (S.E.M) of seven groups, summarized and then analyzed by software SPSS/version 15.0). The statistical technique was one-way analyses of variance ANOVA test (F-test), and if significant differences between means were found, Duncan’s multiple range test (Whose significant level was defined as (P<0.05) was used according to Snedecor and Cochran [26] estimate the effect of different treated groups.
Results
The data presented in Table 1 showed that the plasma creatinine concentration of adenine-group increased significantly but there was significant decreased in urine as compared with the control group. Adenine with propolis, adenine with marjoram, and adenine- with marjoram and propolis showed no significant changes in plasma creatinine level, while a significant decrease in urine creatinine was observed when compared with the control. Comparing adenine/ marjoram, or adenine/propolis or Adenine/marjoram/propolis with adenine-treated group only, a significant decrease in plasma creatinine level and a significant increase in urine creatinine concentration were recorded.
Table 1. Creatinine, uric acid and urea nitrogen levels in the plasma and urine of different studied groups
|
Groups
|
Plasma
creatinine
(mg/dL)
|
Urine
creatinine
(mg/dL)
|
Plasma
uric acid
(mg/dl)
|
Urine
uric acid
(mg/dL)
|
Plasma
urea nitrogen
(mg/dL)
|
Urine
urea nitrogen
(mg/dL)
|
|
Control
|
0.52 ± 0.01b
|
21.09 ± 0.17b
|
1.19 ± 2.32b
|
48.87 ± 0.97b
|
13.18 ± 0.29b
|
1343.76 ± 104.39b
|
|
adenine
|
2.31 ± 0.01a
|
21.09 ± 0.09a
|
2.32 ± 2.32a
|
48.87 ± 0.56a
|
45.61 ± 0.36a
|
853.54 ± 180.73a
|
|
Ma
|
0.53 ± 0.02b
|
44.63 ± 0.23b
|
1.09 ± 0.03b
|
47.45 ± 0.97b
|
12.35 ± 0.24b
|
702.32 ± 180.30ab
|
|
Pr
|
0.53 ± 0.02b
|
44.59 ± 0.20b
|
1.20 ± 0.03b
|
47.46 ± 1.38b
|
12.60 ± 0.18b
|
1167.11 ± 113.99ab
|
|
Ad +Ma
|
1.15 ± 0.02ab
|
29.65 ± 0.19ab
|
1.71 ± 0.04ab
|
41.04 ± 0.95a
|
32.98 ± 0.43ab
|
1062.86 ± 171.13ab
|
|
Ad +Pr
|
1.16 ± 0.02ab
|
30.13 ± 0.36ab
|
1.71 ± 0.06ab
|
39.64 ± 1.53a
|
32.76 ± 0.28ab
|
891.24 ± 111.75ab
|
|
Ad+Ma+Pr
|
1.11 ± 0.02ab
|
29.37 ± 0.38ab
|
1.54 ± 0.02ab
|
39.65 ± 1.52a
|
30.41 ± 0.38ab
|
856.50 ± 123.94ab
|
Data are presented as means ± S.E (N=5)
- Significant difference from control (P ≤ 0.05)
- Significant difference from Ad (P ≤ 0.05)
Ad= Adenine Ma = Marjoram Pr = Propolis
The uric acid concentration in plasma of adenine- group showed a significant increase as compared to control group, but in urine, adenine-group, adenine/marjoram, adenine/ propolis, and Adenine/marjoram/propolis showed a significant decrease as compared to control animals (Table 1). However, comparing adenine/marjoram, or adenine/propolis with adenine-treated rats showed a significant increase in urine.
The blood urea nitrogen (BUN) concentrations in plasma and urine of adenine-treated group showed a significant increase in plasma and a significant decrease in urine compared to the control group (Table 1). The adenine-treated group with propolis and adenine-treated group with marjoram and propolis showed a significant increase in plasma urea compared to the control group while, a significant decrease in urine urea levels.
The data presented in Table 2 showed that the levels of MDA and PC content of adenine- treated rats were a significant increase when compared to the control group. However, data recorded a significant increase in MDA level, and no significant change in PC content of adenine/marjoram, or adenine/propolis, or adenine/marjoram/ propolis treated rats when compared to control group. Comparing to the adenine-treated rats, adenine/marjoram, adenine/propolis, adenine/marjoram/ propolis- treated groups showed a significant decrease in MDA and slightly decrease in PC contents.
Table 2. Kidney concentration of malondialdehyde (MDA), protein carbonyl (PC) and glutathione (GSH) as well as superoxide dismutase (SOD) and catalase activities in different studied groups
|
Groups
|
MDA
(nmol/g)
|
PC
(µmol/g)
|
GSH
(mmol/g)
|
SOD
(U/mg)
|
Catalase
(U/g)
|
|
Control
|
28.26 ± 0.34b
|
0.21 ±.01b
|
9.24 ± 0.22b
|
101.16 ± 1.57b
|
4.80 ± 0.23b
|
|
Ad
|
92.6 ± 2.56a
|
0.28 ± 0.01a
|
4.97 ± 0.24a
|
49.54 ± 1.87a
|
0.78 ± 0.03a
|
|
Ma
|
23.82 ± 0.44b
|
0.2 ± 0.01b
|
10.59 ± 0.30ab
|
115.20 ± 1.86ab
|
6.06 ± 0.34b
|
|
Pr
|
23.22 ± 0.34b
|
0.2 ± 0.01b
|
11.02 ± 0.15ab
|
124.20 ± 1.97ab
|
5.58 ± 0.33b
|
|
Ad +Ma
|
54.52 ± 1.22ab
|
0.23 ± 0.01b
|
6.30 ± 0.25ab
|
78.34 ± 1.43ab
|
3.37 ± 0.27ab
|
|
Ad +Pr
|
54.22 ± 1.22ab
|
0.23 ± 0.01b
|
6.91 ± 0.14ab
|
77.94 ± 1.33ab
|
4.18 ± 0.13b
|
|
Ad +Ma+ Pr
|
44.46 ± 1.25ab
|
0.22 ± 0.01b
|
7.00 ± 0.27ab
|
83.94 ± 2.47ab
|
3.54 ± 0.13b
|
Data are presented as means ± S.E (N=5)
- Significant difference from control (P ≤ 0.05)
(b) Significant difference from Ad (P ≤ 0.05)
Ad= Adenine Ma = Marjoram Pr = Propolis
GSH concentration in the tissue of adenine-treated rats showed a significant decrease compared to the control value (Table 2). Also, Adenine + marjoram, adenine + propolis, adenine + marjoram + propolis treated groups showed similar results. Also, adenine + marjoram, Adenine + propolis, Adenine + marjoram + propolis showed a significant increase compared to the adenine-treated group.
The levels of SOD and CAT in the control and different treated groups: Adenine-treated group when compared to control rats, showed a significant decrease in SOD activity (Table 2). In addition, adenine + marjoram, adenine + propolis, adenine + marjoram + propolis treated groups showed a significant decrease in the activity of SOD compared to control group. Compared to adenine-treated rats, the adenine + marjoram, adenine + propolis, adenine + marjoram + propolis treated groups showed a significant increase in SOD activity. The adenine-treated rats showed a significant decrease in CAT activity compared to the control group. Comparing to Adenine-treated rats, adenine + marjoram, adenine + propolis, adenine + marjoram + propolis treated groups showed a significant increase in CAT activity.
The data presented in Table 3 showed that adenine-treated rats, adenine + marjoram, adenine + propolis, adenine + marjoram + propolis treated groups have a significant increase in kidney Na concentration when compared to control group, and showed a slight decrease compared to the adenine-treated group. The results illustrated that kidney K concentration showed a significant increase in adenine, adenine + marjoram, adenine + propolis, adenine + marjoram + propolis -treated groups compared to the control group. The adenine + marjoram, adenine + propolis, adenine + marjoram + propolis treated groups showed non-significant change compared to adenine-treated group. Kidney Ca and P concentrations in adenine-treated group showed a significant increase compared to the control group. Kidney Ca and P concentrations in adenine + marjoram, adenine + propolis, adenine + marjoram + propolis treated groups showed a significant decrease from the Adenine-treated group.
Table 3. Kidney sodium (Na), potassium (K), calcium (Ca) and phosphorus (P) concentrations in the control and different treated rat group
|
Groups
|
Na
(mg/g /k.t.)
|
K
(mg/g/k.t.)
|
Ca
(mg/g /k.t.)
|
P
(mg/g /k.t.)
|
|
Control
|
11.17 ± 0.28b
|
3.28 ± 0.14
|
18.60 ± 0.26b
|
1.84 ± 0.11b
|
|
Ad
|
26.70 ± 0.75a
|
4.16 ± 0.17
|
24.07 ± 0.45a
|
2.34 ± 0.15a
|
|
Ma
|
18.75 ± 0.32ab
|
4.17 ± 0.19a
|
13.82 ± 0.27ab
|
2.06 ± 0.08ab
|
|
Pr
|
18.76 ± 0.29ab
|
4.22 ± 0.22
|
14.14 ± 0.34ab
|
1.98 ± 0.15b
|
|
Ad +Ma
|
21.64 ± 0.58a
|
4.50 ± 0.09a
|
16.71 ± 0.39ab
|
1.95 ± 0.12b
|
|
Ad +Pr
|
23.51 ± 0.54a
|
3.76 ± 0.15
|
17.13 ± 0.20b
|
1.92 ± 0.13b
|
|
Ad +Ma+ Pr
|
21.98±0.53a
|
4.03 ± 0.19
|
17.32 ± 0.25b
|
1.82 ± 0.19b
|
Data are presented as means ± S.E (N=5)
- Significant difference from control (P ≤ 0.05)
(b) Significant difference from Ad (P ≤ 0.05)
Ad= Adenine Ma = Marjoram Pr = Propolis
Histological investigation of kidney tissues of the control group showed renal corpuscles in the cortex. Each corpuscle appeared as a dense rounded structure. The glomeruli surrounded by narrow Bowman's space. Most of the cortical parenchyma surrounding the renal corpuscles consisted of proximal and distal convoluted tubules (Figures 1a and 1b). Similarly, the histology in renal parenchyma in both marjoram and propolis was normal as in the control group as in Figures 2a, 2b and Figures 3a, 3b respectively.
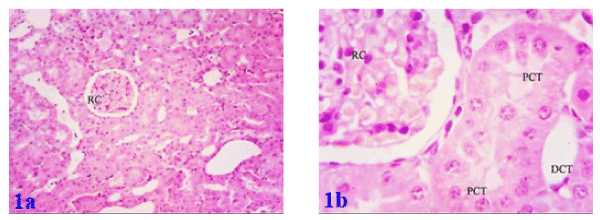
Figure 1a. Photomicrograph of kidney of normal (control) rat showing a normal histological pattern for the renal tissue and Figure 1b: showing; renal corpuscles (RC) containing glomeruli and surrounded by a narrow Bowman's space, proximal convoluted tubules (PCT) with narrow lumen and distal convoluted tubule (DCT) with wide lumina
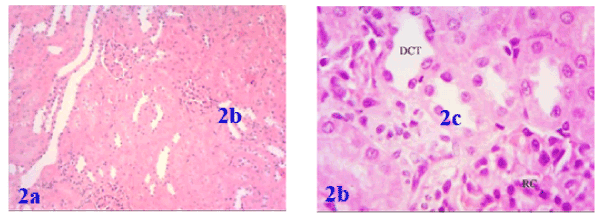
Figure 2a. Photomicrograph of the kidney of marjoram treated rat showing renal corpuscles containing glomeruli and surrounded by a narrow Bowman's space, proximal convoluted tubules, and distal convoluted tubules and Figure 2b: showed a magnifying picture of the last description
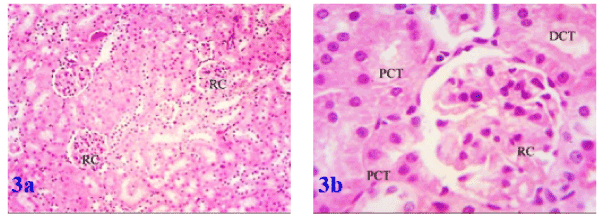
Figure 3a. Photomicrograph of the kidney of propolis treated rat showing a good histological pattern for the renal corpuscles inside the renal tissue and Figure 3b: showing a renal corpuscle, proximal (PCT) and distal convoluted tubules (DCT) in a good cytoplasmic and nuclear profiles
Histological examination of rat kidney treated with adenine showed degenerative changes in most parenchymous elements in comparison with the control. Atrophy of renal corpuscle was observed. Proximal tubules showed histological changes in the form of widening of the tubular lumen. Marked atrophy and degeneration of distal tubules were also observed. Also, Adenine treated group showing areas of acute tubular necrosis and exhibited severe glomerulotubular damage with numerous crystals deposited and marked fibrosis (Figures 4a-4c).
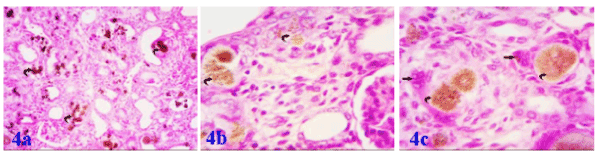
Figure 4a. Photomicrograph of the kidney of albino rat exposed to adenine showing; extensive deposition of adenine crystals inside the renal parenchyma (curved arrow). Figure 4b: showing the localization of adenine crystals inside damaged distal convoluted tubules (curved arrows) and Figure 4c: Enlarged field showing; damaged and proliferating nuclei of the convoluted tubules around the characteristic crystals of adenine
All effects induced by adenine were markedly ameliorated by supplementation with marjoram and propolis showing decreased intensity in number and size of adenine crystals deposited in the renal tissue. Co-administration of marjoram with adenine - revealed mild vacuolar degeneration of renal tubular epithelium. (Figures 5a and 5b). Co-administration of propolis with adenine -revealed significant improvement in kidney tubules marked by the absence of tubular casts, reduction of infiltration, degeneration and tubular dilatation and also resulted in the normal epithelial lining with brush borders in proximal convoluted tubules (Figures 6a and 6b). Also, co-administration of propolis and marjoram with adenine - revealed significant improvement in kidney tubules marked by the decreased intensity in number and size of adenine crystals deposited in the renal tissue (Figures 7a-7c).
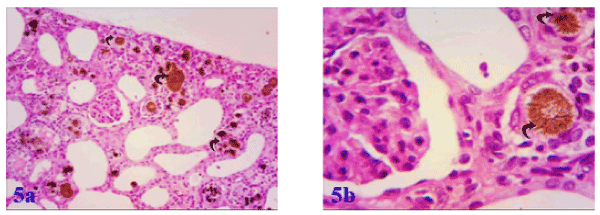
Figure 5a. Photomicrograph of the kidney of albino rat exposed to adenine + marjoram showing a slight decrease in adenine deposition in the renal tissue, Figure 5b: showing; a magnified portion from the last photomicrograph and the characteristic adenine crystals enclosed inside the lumens of convoluted tubules (curved arrows) with surrounding leucocytic cellular infiltration
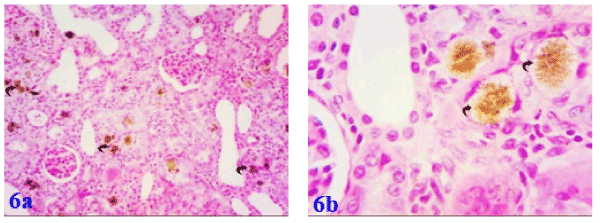
Figure 6a. Photomicrograph of kidney of albino rat exposed to adenine + propolis showing decreased intensity of adenine crystals in the renal tissue due to gavage of propolis, Figure 6b: showing enlarged portion of the last photo exhibiting a partial recovering of the renal tissue concomitant to propolis administration and showing a renal corpuscle and renal elements with good nuclear profiles as compared to that of adenine only
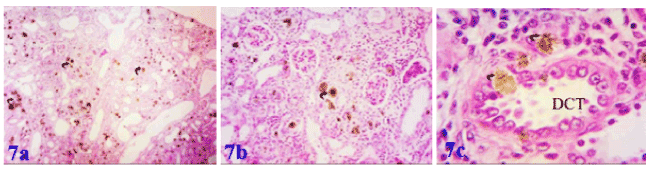
Figure 7a. Photomicrograph of kidney of albino rat exposed to adenine + marjoram + propolis showing decreased intensity in number and size of adenine crystals deposited in the renal tissue due to administration of marjoram and propolis together with adenine, Figure 7b: showing a good histological pattern for the renal corpuscles and a fewer number of adenine crystals and Figure 7c: showing; amelioration of distal convoluted tubule with few number of adenine crystals
Discussion
Patients with CKD are at high risk for the development of serious and critical illness and for adverse outcomes after Intensive Care Unit admission. In these patients, acute kidney injury frequently occurs that contributes to a progression of long-term kidney dysfunction, potentially leading to end-stage renal disease (ESRD) [27]. In the present study, the adenine induced renal failure in rats seemed to be like a chronic renal failure in humans.
Chronic kidney disease caused an increase in the plasma concentration of creatinine, plasma BUN and uric acid by decreasing the urinary excretion of uric acid, creatinine, and urea. These results in the same line with Ali et al. [2] who reported that adenine-induced CRF significantly increased the plasma concentrations of urea and creatinine. These results are followed by renal disorder with increased levels of plasma creatinine, phosphate and parathyroid hormone (PTH).
Structurally, the kidneys of 0.25% adenine-rats showed tubular atrophy, erosion of proximal tubular brush borders with flattening of the epithelium, focal tubular epithelial hypertrophy, and glomerular damage in the form of glomerulosclerosis and hypertrophy [4]. Adenine diet (0.25%) induced characteristics of human chronic kidney disease at 16 weeks including increased BUN and plasma creatinine, decreased BUN and creatinine clearances; proteinuria; increased chronic inflammation as macrophage and myofibroblast infiltration, increased collagen deposition, tubular atrophy, apoptosis, and TNF-α and TGF-β expression; glomerulopathy as increased podocyte desmin expression; increased HO-1 expression; and increased plasma uric acid [28]. The adenine-treated groups showed diffuse tubular injury with neutrophil polymorph infiltration, tubular necrosis, tubular atrophy and diffuse interstitial fibrosis [29]. According to Chang et al. [30], following adenine administration, accumulation of crystals was found in the renal tubular lumina and interstitia starting on day 5.
In this study, the MDA and protein carbonyl levels were significantly higher in the CRF group compared with the control group. According to El-Habibi et al. [31], adenine treatment caused renal disorders resembling CRF represented by a significant increase in renal oxidative stress markers LPO product (MDA) and PC content. Exposure to a high concentration of adenine results in the production of free radicals, which induces oxidative stress as shown by increased LPO, free radical generation, and arachidonic acid release with decreased GSH [32].
In the metabolism of human, when adenine is present in excess, it becomes a significant substrate for xanthine dehydrogenase. This enzyme can oxidize adenine to 2, 8 dihydroxyadenine (DHA) forming crystals in renal tubules [29]. The DHA precipitated crystals could enhance the production of reactive oxygen species (ROS) as peroxides and superoxide anion radicals causing oxidative stress [33].
In the present work, there is a significant rise in oxidative stress markers and significantly decrease in the activities of oxidant enzymes (SOD and CAT) as well as GSH level in kidneys of adenine-treated rats compared to the kidneys of controls. Ali et al. [3] reported that in adenine- treated rats, antioxidant indicators, including SOD and CAT activity, total antioxidant capacity and GSH were harmfully affected. Also according to El-Habibi et al. [31], who reported that adenine -induced CRF in male rats caused a significant decrease in the activities of SOD, CAT and the level of GSH. The CATs and SODs are the most efficient antioxidant enzymes. Their combined action converts the potentially dangerous superoxide radical (O2-) and hydrogen peroxide (H2O2) to water (H2O) and molecular oxygen (O2), thus averting cellular damage [34]. Al Za’abi et al. [35], reported that the concentration of GSH and activities of some enzymes included in its metabolism were decreased in kidneys and livers of rats with CKD induced by adenine.
Heo et al. [36], reported that marjoram contains ursolic acid that decreased the oxidative stress which causes cell death. El-Ashmawy et al. [37], indicated that marjoram plays an important renoprotective agent which ameliorates kidney functions caused by lead toxicity, also they illustrated that essential oil, alcoholic and aqueous extracts of marjoram significantly decrease the plasma activities of alkaline phosphatase, urea, and creatinine and enhanced the histology of kidney in comparison with lead acetate administrated group. Ethanol extract from marjoram was found to remarkably reduce the formation of ulcers, gastric secretion and acid production, and the concentration of MDA [38]. Marjoram extract was shown to mitigate the kidney antioxidant activities and reduce LPO levels that were corrupted by Cd in albino rats. So, marjoram is a potential agent that showed protective and medicinal effects on nephrotoxicity caused by cadmium [39].
In the present study, the administration of marjoram and propolis lead to significantly increased in renal SOD and CAT, also a slight increase in GSH. While showed significantly decreased in MDA and PC, this result is in agreement with Aita and Mohammed [40], who reported that co-administration of marjoram oil with sodium nitrite minimized the hazard effects of sodium nitrite, it elevated the level of plasma total antioxidant capacity (TAC) and decreased the level of plasma MDA. Kamel [41], reported that the increased levels of LPO in tissues of diabetic rats were reverted near back to normal levels after the treatment with marjoram oil. The marjoram treatment also resulted in a significant increase in SOD, CAT and glutathione peroxidase in the liver and kidney of diabetic rats. The administration of marjoram has a protective role against oxidative damage of paracetamol as was insured from improvement of almost all evaluated parameters. Although, changes in oxidant-antioxidant biomarkers induced by the herbal plants when combined with paracetamol were still significantly differed from control healthy group, but their values were markedly improved when compared to paracetamol-treated rats suggesting a protective effect of the herbs against oxidative damage caused by paracetamol [6]. Ulusoy et al. [42] reported that propolis is a strong antioxidant which has the ability to scavenge free radicals. Propolis antioxidant activity is mostly related to its flavonoid content, that makes it able to scavenge free radicals and thereby protection against LPO [13]. Propolis and its extract have antioxidant properties. Oral administration of propolis extract in doses of 100, 200 & 300 mg/kg improved the body and kidney weights, plasma glucose, lipid profile, MDA and renal function tests. Renal GSH, SOD, and CAT were significantly increased while MDA was markedly reduced. These results may suggest the strong antioxidant effect of propolis which can improve oxidative stress and interrupt the occurrence of diabetic nephropathy in diabetes mellitus [43]. Jasprica et al. [44], reported that propolis has the ability to cause decreasing in MDA levels and increasing in SOD, GSH, and CAT activities. Propolis is also reported to prevent the production of superoxide anion. Therefore, it is suggested that propolis have the ability to reverse the consumption of GSH [45].
In the present work, kidney Ca and P concentrations in adenine - treated group showed a significant increase while Kidney Ca and P concentrations in the other treated groups showed a significant decrease compared to adenine -treated group. Patients with chronic renal disease have a tendency to keep and retain phosphorus due to decreased kidney filtration and have diminished kidney hydroxylation of 25-hydroxyvitamin D to calcitriol, resulting in hyperphosphatemia, calciferol deficiency, and ultimately hypocalcemia [46].
The data presented in this investigation demonstrated that kidney Na and K concentrations showed a significant increase in all treated groups when compared to control group, but Na showed slightly decrease and K showed non-significant change compared to adenine-treated group. According to Diwan et al. [4], adenine diet-induced continuous progressive kidney damage with increasing potassium concentration. Potassium level might increase along with deteriorating renal function. Subsequently, the elevated potassium level might by itself stimulate potassium excretion [47]. As mentioned in El Menyiy et al. [10], propolis made the level of sodium, potassium, and chloride somewhat normal in adenine induced CKD rats because it increased the excretion of potassium, sodium, and chloride as compared to the ethylene glycol group. Thus, propolis extract powerfully stands against ethylene glycol that caused hepatotoxicity and nephrotoxicity and also has the possibility to cure or even hinder urinary calculus and crystalluria.
Histopathological analyses revealed the deposition of crystals in the renal tubules accompanied by tubular dilatation, loss of tubular epithelial cells, and tubulointerstitial fibrosis. Adenine-related micro-crystals are usually non-obstructing, but incite an inflammatory reaction that ultimately leads to narrowing or obliteration of the vascular lumen [28]. However, kidney histological sections of the rats treated with adenine plus marjoram or adenine plus propolis showed marked improvement in comparison with the adenine treated group. This finding is in accordance with that of Aita and Mohammed [40], who reported that marjoram has a renoprotective role as the renal lesions were few and restricted to vacuolization of renal tubular epithelium in rats co-administered sodium nitrite with marjoram oil. Addition of marjoram with paracetamol reduced the severity of the histopathological changes such as congestion of the blood vessels in the renal cortex, focal inflammatory cells aggregation between the congested glomeruli and fibroblastic cells proliferation between the degenerated atrophied tubules according to Saleh et al. [6].
Co-administration of propolis with gentamicin showed a significant decrease in BUN levels, the appearance of healthy glomeruli with normal cellularity, reduction of tubular injury, a decrease of collagen and reticular fibers deposition, reduction of apoptosis, kidney injury and oxidative stress [48]. Propolis prevented the rise in the number of apoptotic cells expression, and improved kidney morphology as methotrexate-induced kidney injury in the rat caused epithelial desquamation into the lumen of the tubules, dilatation, and congestion of the peritubular vessels and renal corpuscles with obscure Bowman’s space, so propolis is a potent antioxidant agent in preventing kidney injury [42].
Conclusion
The study suggests that marjoram and propolis are useful as renoprotection against chronic renal failure. This effect can be attributed to their strong antioxidant activity and high ability to scavenge reactive oxygen species, playing an important role as anti-inflammatory agents. Marjoram is conjugated with propolis plays an important role in ameliorating kidney functions and chronic renal failure induced by adenine. Thus, this surprise combination represents a new therapeutic strategy and gives good hope for a patient with CKD.
Ethical approval and consent to participate
All applicable international, national, and/or institutional guidelines for the care and use of animals were followed and approved by Prof Dr. Abdallah Elhoot (Head of Zoology Department- Zagazig University).
Author contributions
AD: made the planning and supervision overall steps of processing of the research. HA: carried out the physiological, biochemical and anatomical studies, participated in the sequence alignment and drafted the manuscript. MZ: participate in the physiological analysis and supervision of the research. SE: carried out the preparation of the chemicals and made the extraction of Origanum majorana and propolis and supervision of the research. BH: carried out the practical part of this research.
References
- Garcia-Garcia G, Agodoa L, Norris KC (2017) Chronic Kidney Disease in Disadvantaged Populations (Eds.). Academic Press.
- Ali BH, Ziada A, Al Husseini I, Beegam S, Al-Ruqaishi B, et al. (2011) Effect of Acacia gum on blood pressure in rats with adenine-induced chronic renal failure. Phytomedicine 18: 1176-1180. [Crossref]
- Ali BH, Beecham S, Al-Lawati I, Waly MI, Al Za'abi M, et al. (2013) Comparative efficacy of three brands of gum acacia on adenine-induced chronic renal failure in rats. Physio Res 62: 47-56. [Crossref]
- Diwan V, Brown L, Gobe GC (2018) Adenine‐induced chronic kidney disease in rats. Nephrology 23: 5-11. [Crossref]
- Vargas F, Duran R, Alejandra P, García-Guillén AI, Wangensteen R., et al. (2018) Flavonoids in kidney health and disease. Front Physiol 9: 394. [Crossref]
- Saleh NS, Allam TS, El-Rabeai RM, El-Sabbagh HS (2018) Protective Effect of Some Egyptian Medicinal Plants Against Oxidative Stress in Rats. Alexandria J Veterinary Sci 58: 1-14.
- Singh VK, Dixit P, Saxena PN (2005) Cybil induced hepatobiochemical changes in Wistar rats. J Environ Biol 26: 725-727. [Crossref]
- Badee AZM, Moawad RK, ElNoketi MM, Gouda MM (2013) Antioxidant and Antimicrobial Activities of Marjoram (Origanum majorana) Essential Oil. J App Sci Res 9: 1193-1201.
- Simões LM, Gregório LE, Da Silva Filho AA, De Souza ML, Azzolini AE, et al. (2004) Effect of Brazilian green propolis on the production of reactive oxygen species by stimulated neutrophils. J Ethnopharmacol 94: 59-65. [Crossref]
- El Menyiy N, Al Waili N, Bakour M, Al-Waili H, Lyoussi B, et al. (2016) Protective effect of propolis in proteinuria, crystalluria, nephrotoxicity and hepatotoxicity induced by ethylene glycol ingestion. Arch Med Res 47: 526-534. [Crossref]
- Wang J, Wang F, Yun H, Zhang H, Zhang Q, et al. (2012) Effects and mechanism of fucoidan derivatives from Lamminnaria japonica in experimental adenine-induced chronic kidney disease. J Ethnopharmacol 139: 807-813. [Crossref]
- Ramadan G, El-Beih NM, Arafa NM, Zahra MM (2013) Preventive effects of Egyptian sweet marjoram (Origanum majorana L.) leaves on hematological changes and cardiotoxicity in isoproterenol-treated albino rats. Cardiovasc Toxicol 13: 100-109. [Crossref]
- Yousef MI, Salama AF (2009) Propolis protection from reproductive toxicity caused by aluminum chloride in male rats. Food Chem Toxicol 47: 1168-1175. [Crossref]
- Van Herck H, Baumans V, Brandt CJ, Boere HA, Hesp AP, et al. (2001) Blood sampling from the retro-orbital plexus, the saphenous vein and the tail vein in rats: comparative effects on selected behavioral and blood variables. Lab Anim 35:131-139. [Crossref]
- Azhar S, Cao L, Reaven E (1995) Alteration of the adrenal antioxidant defense system during aging in rats. J Clin Invest 96: 1414-1424. [Crossref]
- Henry RJ (1974) Clinical chemistry, Harper & Row publishers. New York pp: 181.
- Coalombe, JJ, Favreau L (1963) A new simple semimicro Method for calorimetric determination of urea. Clin Chem 9: 102-108. [Crossref]
- Talke H, Schubert GE (1965) Enzymatic urea determination in the blood and serum in the WARBURG optical test. Klin Wochenschr 43: 174-175. [Crossref]
- Mesbah L, Soraya B, Narimane S, Jean PF (2004) Protective effect of flavonoids against the toxicity of vinblastine cyclophosphamide and paracetamol by inhibition of lipid peroxidation and increase of liver glutathione. Haematol 7: 59- 67.
- Smith C, Carney J, Stark-Reed P, Oliver C, Stadtman ER, et al. (1991) Excess brain protein oxidation and enzyme dysfunction in normal aging and in Alzheimer disease. Proct Natl Acad Sci U S A 88: 10540-10543. [Crossref]
- Kakkar P, Das B, Viswanathan PN (1984) A Modified Spectrophotometric Assay of Superoxide Dismutase. Indian J Biochem Biophys 21: 130-132. [Crossref]
- Luck H (1974) In “Methods of Enzymatic Analysis 2” (BERGMEYER ed.), Academic Press, New York. pp: 885.
- Moron MS, Depierre JW, Mannervik B (1979) Levels of glutathione, glutathione reductase, and glutathione S-transferase activities in rat lung and liver. Biochim Biophys Acta 582: 67–78. [Crossref]
- Habig W, Pabast M, Jakoby WJ (1974) The first step in mercapturic acid formation. J Biol Chem 249: 7130-7139. [Crossref]
- Bancroft JD, Gamble M (2002) Theory and practice of histological techniques. 5th ed. Edinburgh: Churchill Livingstone Pub 172: 593-620.
- Snedecor GW, Cochran WG (1989) Statistical Methods (8thEd), Ames Iowa State University.
- De Rosa S, Prowle JR, Samoni S, Villa G, Ronco C, et al. (2019) Acute Kidney Injury in Patients With Chronic Kidney Disease. Critical Care Nephrol pp: 85-89.
- Diwan V, Mistry A, Gobe, G, Brown L (2013) Adenine-induced chronic kidney and cardiovascular damage in rats. J Pharmacol Toxicol Methods 68: 197-207. [Crossref]
- Ali BH, Al-Salam S, Al Husseni I, Kayed RR, Al-Masroori N, et al. (2010) Effects of Gum Arabic in rats with adenine-induced chronic renal failure. Exp Biol Med 235: 373-382. [Crossref]
- Chang ZZ, Kelly JD, Arthur LN, Lauren O, Marian TN, et al. (2018) Short-term oral gavage administration of adenine induces a model of fibrotic kidney disease in rats. J Pharmacol Toxicol Methods 94: 34–43.
- El-Habibi EM, Othman AI, Ibrahim R (2014) Assessment the role of green tea catechins on Adenine- induced chronic renal failure in male rats. J Environ Sci 43: 539-556.
- Wang J, Zhang Q, Jin W, Niu X, Zhang H, et al. (2011) Effects and mechanism of low molecular weight fucoidan in mitigating the peroxidative and renal damage induced by adenine. Carbohydrate Polymers 84: 417-423.
- Veena CK, Josephine A, Preetha SP, Varalakshmi P, Sundarapandiyan R, et al. (2006) Renal peroxidative changes mediated by oxalate: the protective role of fucoidan. Life Sci 79: 1789-1795. [Crossref]
- Matheson IB, Etheridge RD, Kratowich NR, Lee J (1975) The quenching of singlet oxygen by amino acids and proteins. Photochem Photobiol 21: 165-171. [Crossref]
- Al Za’abi M, Shalaby A, Manoj P, Ali BH (2017) The in vivo effects of adenine-induced chronic kidney disease on some renal and hepatic function and CYP450 metabolizing enzymes. Physio Res 66: 263-271. [Crossref]
- Heo HJ, Cho HY, Hong B, Kim HK, Heo TR, et al. (2002) Ursolic acid of Origanum majorana L. reduces Abeta-induced oxidative injury. Mol Cells 13: 5-11. [Crossref]
- El-Ashmawy IM1, El-Nahas AF, Salama OM (2005) Protective effect of volatile oil, alcoholic and aqueous extracts of Origanum majorana on lead acetate toxicity in mice. Basic Clin Pharmacol Toxicol 97: 238-243. [Crossref]
- Al-Howiriny T, Alsheikh A, Alqasoumi S, Al-Yahya M, ElTahir K, et al. (2009) Protective effect of Origanum majorana L. ‘Marjoram’ on various models of gastric mucosal injury in rats. Am J Chin Med 37: 531–545. [Crossref]
- Shati AA (2011) Effects of Origanum majorana L. on cadmium-induced hepatotoxicity and nephrotoxicity in albino rats. Saudi Med J 32: 797–805.
- Aita NAA, Mohammed FF (2014) Effect of marjoram oil on the clinicopathological, cytogenetic and histopathological alterations induced by sodium nitrite toxicity in rats. Global Vet 12: 606-616.
- Kamel MA (2014) Protective effects of marjoram oil (Organium majorana l.) On antioxidant enzymes in experimental diabetic rats. Assiut Vet Med 60: 140.
- Ulusoy HB, Öztürk İ, Sönmez MF (2016) Protective effect of propolis on methotrexate-induced kidney injury in the rat. Ren Fail 38: 744-750. [Crossref]
- Abo-Salem OM, El-Edel RH, Harisa GE, El-Halawany N, Ghonaim MM, et al. (2009) Experimental diabetic nephropathy can be prevented by propolis: effect on metabolic disturbances and renal oxidative parameters. Pak J Pharm Sci 22: 205-210. [Crossref]
- Jasprica I, Mornar A, Debeljak Z, Smolcić-Bubalo A, Medić-Sarić M, et al. (2007) In vivo study of propolis supplementation effects on antioxidative status and red blood cells. J Ethnopharmacol 110: 548-554. [Crossref]
- Castaldo S, Capasso F (2002) Propolis, an old remedy used in modern medicine. Fitoterapia 73: S1-6. [Crossref]
- Martin KJ, González EA (2007) Metabolic bone disease in chronic kidney disease. J Am Soc Nephrol 18: 875-885. [Crossref]
- Hsieh MF, Wu IW, Lee CC, Wang SY, Wu MS, et al. (2011) Higher Serum Potassium Level Associated with Late Stage Chronic Kidney Disease. Chang Gung Med J 34: 418-425. [Crossref]
- Aldahmash BA, El-Nagar DM, Ibrahim KE (2016) Reno-protective effects of propolis on gentamicin-induced acute renal toxicity in Swiss albino mice. Nefrologia 36: 643-652. [Crossref]