Abstract
Research objective: African Americans are a high-risk group for limb amputation as a result of Type 2 diabetes and subsequent peripheral artery disease with lower limb ischemia. Black patients represent 14.7% of the 30 million Americans with diabetes. Health care utilization data indicates that limb amputations are nearly two times higher among Blacks compared with non-Hispanic whites. The highest prevalence can be seen in Southern most states including Louisiana, Mississippi, and Texas. AHA and ADA care guidelines provide strong evidence-based practice recommendations that could offer opportunities for timely clinical intervention to reduce or prevent limb loss. This study aimed to compare limb amputation rates among six southern states with high prevalence of diabetes using an existing data source.
Study design: Public use files from CMS were used to determine rates of lower extremity amputation among Medicare beneficiaries by year, from 2007 through 2018, for six Southern states (LA, AL, GA, MS, TX, FL) with high prevalence of diabetes.
Population studied: Medicare Beneficiaries.
Principal findings: Data visualizations created from the analysis of the CMS data demonstrated the increasing rates of amputations— from 1757 per 100,000 Medicare Beneficiaries in 2007 to 2660 per 100,000 in 2018, an increase of 51% based over the twelve-year period. Increasing rates were seen in all six states, but the highest rate of change was noted for Texas, with a 75% increase over the 12-year period.
Conclusions: Changing the trajectory of the limb loss epidemic begins with increasing the awareness of health care professionals and offering opportunities for care practice changes.
Implications for policy or practice: Findings suggest that to address the alarming rates of limb loss, training for health care providers is needed to increase awareness and practice techniques for monitoring lower extremity (foot, ankle and lower limb) circulation.
Key words
limb loss epidemic,
Introduction
Approximately 37 million US adults have diabetes [1]. As diabetes progresses, it serves as a precursor to cardiovascular disease and microvascular complications like peripheral artery disease or PAD [2]. Because of the microvascular complications that occur in the lower limb, Type II Diabetes is the leading cause of non-traumatic limb amputations globally [3,4]. Each year, more than 150,000 persons will undergo a lower extremity amputation [5]. Persons with diabetes account for 60-70% of those procedures [6].
Numerous studies have established that underserved, minorities are disproportionately affected by diabetes and the related, lower-extremity amputations [7-10]. Research also consistently reports a higher rate of PAD and the potential for higher limb amputations in Black and Hispanic Americans. Black persons are particularly less likely than other racial groups to be diagnosed and promptly treated and, therefore, carry higher burden of lower limb amputation [11,12].
Empirical findings confirm disparities in health care for Black and Hispanic patients with complicated PAD and critical limb ischemia in the lower limbs. Nearly four decades of research have been devoted to understanding disparities in patterns of lower extremity amputations in the United States [6-12]. A recent investigation of Black persons with amputations found that this group was significantly less likely than white persons to have undergone limb saving procedures: [revascularization (23.6 vs. 31.6%, p<0.0001), any limb-related admission (39.6 vs. 44.7%, p<0.0001), toe amputation (12.9 vs. 13.8%, p<0.0005) or wound debridement (11.6 vs. 14.2%, p<0.0001] prior to amputation [12]. In research examining racial and regional variations in diabetes-related lower-limb amputations, higher rates of critical limb ischemia CLI and a higher proportion of major limb amputations during hospitalizations were seen in Black and Hispanic patients compared to non-Hispanic White patients [11].
While there have been reports of lower extremity amputation rates in individual states and metropolitan areas [13,14], there has not been an examination of the trajectory of temporal, diabetes-associated lower extremity amputations and the relationship of limb amputation and geographic location from the larger national perspective. The purpose of this study is to address this knowledge gap by examining patterns of lower extremity amputation rates in Medicare fee-for-service beneficiaries in the United States and District of Columbia from 2011-2020.
Materials and Methods
The study is an observational, longitudinal analysis of Center for Medicare and Medicaid Services CMS, Geographic Variation public use files [15]. These files include information on geographic differences in utilization and quality of health care services for the fee-for-service (FFS) Medicare population 18 years of age and older [15]. Reported rates of diabetes-associated lower limb amputations for a 10-year period (2011-2022) for the 50 United States and the District of Columbia were extracted. The dataset contains beneficiary demographics (Age, Sex, Race, Ethnicity, Medicaid Eligibility, Average Hierarchical Condition Score), and Medicare FFS beneficiary counts by state [16]. The file also includes 14 prevention quality indicators, one of which, Prevention Quality Indicator 16 (PQI 16)--lower extremity amputation rates associated with diabetes reported per 100,000 population [16]. All PQIs reported in the file use data from hospital discharges to identify potentially avoidable admissions that are influenced by quality of outpatient care [16]. PQIs are population-based indicators that capture all cases of potentially preventable complications that occur in a given population (e.g., a community, state or region) either during a hospitalization or in a subsequent hospitalization [16]. To appropriately account for differences in population size by state the rate of limb amputation was calculated by dividing the reported number of amputations by the reported number of FFS Medicare beneficiaries between the ages of 45 and 64, for which age specific demographics were reported.
A repeated measure, generalized linear mixed model was used. The response variable was amputation rate using a log normal distribution. Independent variables were Time (in years), Race/Ethnicity (Black, White Non-Hispanic, Hispanic, and Other), Gender (Male, Female), and geographic location. The state rates were grouped into nine census regions based on the regions identified by the US Census Multiple comparisons and used Bonferroni correction to determine adjusted p-values. Statistical significance was determined as p<0.05. Analysis was completed using SAS v. 9.4 (SAS Institute, Cary, NC).
Results
The CMS Geographic Variation Public Use files averaged 5.4 million Medicare FFS beneficiaries per year for the years 2011-2020. From an individual state perspective for the year 2020, Texas had the highest amputation rate (473 per 100,000 FFS beneficiaries) followed by the District of Columbia, Hawaii, Georgia, and North Carolina. Rhode Island had the lowest amputation rate (107 per 100,000 FFS beneficiaries) followed by Massachusetts, Utah, Vermont and Wyoming (Table 3). A statistically significant increase in amputation rates over time of approximately, 9% per year was found (Figure 1).
Figure 1. Mean Amputation rate (unadjusted) by year
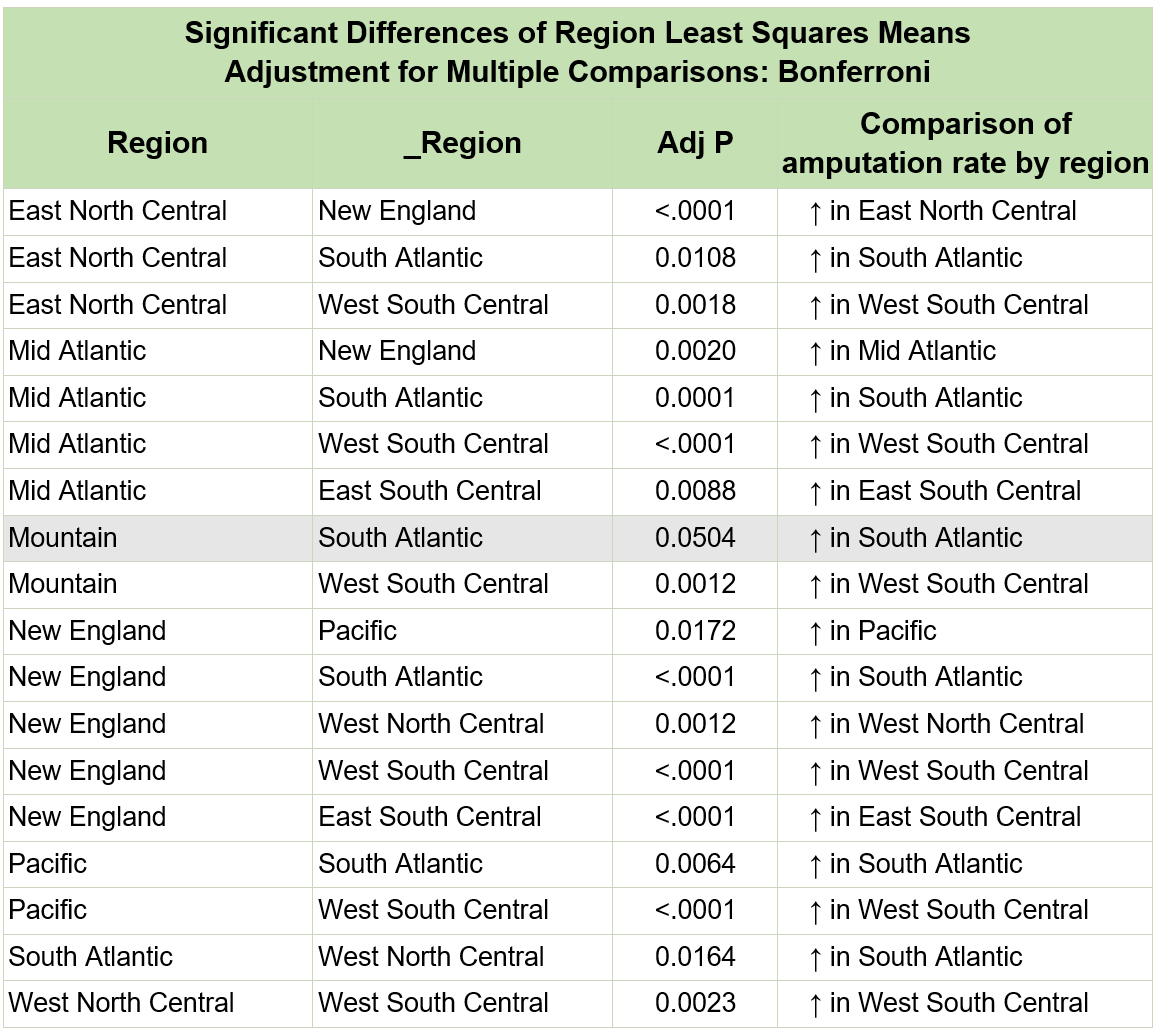
A statistically significant regional effect was also found (Table 1 and Figure 2). The New England and Mountain regions tended to have consistently lower rates, while Southern regions (W. South Central, E. South Central, S. Atlantic) tended to have higher rates. Statistically significant regional comparisons are shown in Table 2. When compared with other geographic regions, Southern regions (South Atlantic, West South Central, East South Central) had increasing amputation rates, though not all were statistically significant. The GLMM estimated amputation rates by year adjusting for race/ethnicity, gender, and region are shown in Figure 3. The estimated R2=0.694.
Figure 2. Regional effect on amputation rates
Figure 3. GLMM estimated amputation rates by year adjusting for race/ethnicity, gender, and region
Table 1. Fixed Effects of amputation rates across various regions
| Effect
|
Region
|
Estimate
|
Standard
Error
|
DF
|
t-Value
|
Pr>|t|
|
Pct_Female |
|
4.8752 |
1.8219 |
456 |
2.68 |
0.0077 |
Pct_Race_Hispanic |
|
1.3223 |
0.3561 |
456 |
3.71 |
0.0002 |
year_seq |
|
0.08816 |
0.004276 |
456 |
20.62 |
<0.0001 |
Region |
East North Central |
-9.5357 |
1.0157 |
42 |
-9.39 |
<0.0001 |
Region |
Mid Atlantic |
-9.6483 |
1.0320 |
42 |
-9.35 |
<0.0001 |
Region |
Mountain |
-9.6517 |
0.9682 |
42 |
-9.97 |
<0.0001 |
Region |
New England |
-9.9866 |
1.0251 |
42 |
-9.74 |
<0.0001 |
Region |
Pacific |
-9.6392 |
0.9832 |
42 |
-9.80 |
<0.0001 |
Region |
South Atlantic |
-9.3389 |
1.0146 |
42 |
-9.20 |
<0.0001 |
Region |
West North Central |
-9.5911 |
1.0099 |
42 |
-9.50 |
<0.0001 |
Region |
West South Central |
-9.2418 |
1.0054 |
42 |
-9.19 |
<0.0001 |
Region |
East South Central |
-9.3634 |
1.0119 |
42 |
-9.25 |
<0.0001 |
Table 2. Comparison of amputation rates across various regions
| Region
|
Estimate
|
Standard
Error
|
DF
|
t-Value
|
Pr>|t|
|
East North Central |
-6.4238 |
0.03957 |
42 |
-162.32 |
<0.0001 |
Mid Atlantic |
-6.5363 |
0.05239 |
42 |
-124.76 |
<0.0001 |
Mountain |
-6.5398 |
0.07809 |
42 |
-83.74 |
<0.0001 |
New England |
-6.8746 |
0.06444 |
42 |
-106.68 |
<0.0001 |
Pacific |
-6.5273 |
0.05814 |
42 |
-112.27 |
<0.0001 |
South Atlantic |
-6.2269 |
0.03572 |
42 |
-174.33 |
<0.0001 |
West North Central |
-6.4791 |
0.05769 |
42 |
-112.32 |
<0.0001 |
West South Central |
-6.1299 |
0.04971 |
42 |
-123.30 |
<0.0001 |
East South Central |
-6.2515 |
0.05177 |
42 |
-120.75 |
<0.0001 |
A regional effect is also reflected in the unadjusted state-level rates by race and ethnicity. States with a higher proportion of self-reported Black and Hispanic persons have higher amputation rates (Table 1, Figure 2 and Supplementary Table 1). When adjusting for other factors in the multivariate model, however, it is the proportion of persons identifying as Hispanic that remains a significant factor in lower limb amputation (Table 2).
Supplementary Table 1: Significant Differences of Region Least Square Means Adjustment for Multiple Comparisons: Bonferroni
Discussion
Our study examined trends in rates of lower extremity amputations among Medicare FFS beneficiaries in the United States and District of Columbia from 2011-2020. The data shows a steady increase in diabetes associated lower extremity amputation rates among persons less than 65 years of age in the overall FFS beneficiary population of 9% per year. A large body of literature suggests likely culprits that contribute to this growing trend including barriers to screening for PAD and lower limb neuropathy [17], lack of medical or revascularization options [18], and complications with co-occurring PAD [19].
Lower extremity amputation is widely associated with peripheral artery disease or lower extremity arterial disease that is most often the result of complicated diabetes. Early detection and intervention are key to minimizing this and other cardiovascular disease morbidity and mortality. American Heart Association and American College of Cardiology (AHC/ACC) Guidelines indicate that all persons with diabetes, whether experiencing symptoms or asymptomatic should be screened for peripheral artery disease [20]. One-third of persons presenting with PAD will have clinically significant symptoms related to the limbs including leg pain while walking. The remainder of the PAD population may have few or no visible signs or symptoms. Early detection and diagnosis are critically important because minor amputations will most likely lead to more significant amputations [21]. Unfortunately, the access to health care necessary for early detection is an underlying barrier that most often affects the care of racial, ethnic, and low-socio-economic populations who are disproportionately affected by PAD and limb loss [10].
Managing PAD risk factors begins with reducing cardiovascular risk through healthy habits [22]. Once PAD is diagnosed, treatment includes medication therapy management [22]. More pronounced PAD symptoms require aggressive and invasive procedures. Treatment alternatives are an area of profound disparities. In a study examining amputation disparities between white and non-white patients with critical limb ischemia, Durazzo and colleagues found that White persons were more likely to undergo a revascularization procedure than other groups [23].
Our study also demonstrated a significant regional influence. The southern regions of the US, comprised of fifteen states plus the District of Columbia, had the highest regional rates of limb amputations. All states with higher limb amputation rates are also states with larger populations of non-white persons. These results support other research studies that have shown limb amputation disparities [10,22]. Among the non-white populations in our study, the Hispanic population was found to have the highest rates of limb amputations, similar to rates reported by research studies dating back to 1999 [24]. In fact, among the forty-eight contiguous states, Texas had the highest amputation rate of all states. This finding is supported by the literature. Total amputations rates in Texas annually increased 30% from 2007 to 2014 according to a study using hospital discharge data [25]. Another study by Barshes et al., reported on the amputation rates of four regions in Texas suggesting that amputation procedures were more likely than revascularization procedures among Black and Hispanic Persons [25]. This study also observed that of 349 hospitals included in the research, 21% reported amputations but no revascularization procedures [25]. A 2019 article of the Texas Observer reported on the amputation crisis inside the Rio Grande Valley, one of the poorest and least-insured regions of the country [26]. The article affirmed that a third of residents have diabetes, with amputation rates in the Valley approximately 50% greater than the state of Texas in 2015 [26].
Both the increasing rates and the regional differences noted in our study are the result of numerous factors reported in literature for decades but remain unresolved today. Among these is the increasing prevalence of diabetes and its known comorbidities. The relationships between diabetes, region, and limb amputation have been explored in only a few, individual state-level analyses [27], with the relationship between diabetes and limb amputation particularly strong. Unless policy changes recognize these differences and address them in impactful ways, diabetes will remain the leading cause of nontraumatic limb amputation in the United States [28], and the disparities demonstrated with this data analysis will continue.
Our research covers a subset of Medicare beneficiaries (approximately 9 million) who represent middle adulthood or middle age who, while demonstrating physical, cognitive, and social changes are in a life stage characterized by lasting life contributions including family, career, and legacy. Living with complicated diabetes limb loss in this vital time of life, however, alters that life trajectory and has several implications. These persons will likely face further illness, disability, and, as a result, be unable to work. Further, as disability and illness increase, need for health care intervention will become greater, and, unfortunately, a great number will face premature death.
There are several limitations that should be noted. Reporting of race/ethnicity as a single variable in the CMS data file does not allow for an appropriate analysis of the effect of race or ethnicity. The fact that these two generally accepted constructs are confounded, prohibits a more detailed analysis using this dataset. Our study included Medicare FFS beneficiaries who were ages 45-64. This population includes those who have received Social Security Disability Insurance (SSDI) benefits for twenty-four months due to a long term, medically determined physical or mental impairment. This Medicare coverage group also includes populations diagnosed with end-stage renal disease (ESRD) or amyotrophic lateral sclerosis (ALS). Kaiser Family Foundation reported that this group of recipients are significantly different from traditional, over 65 beneficiaries—lower annual incomes, largely Black and Hispanic, and a larger male population [29]. This group had more cognitive impairment, memory loss, and poor health status compared to the older beneficiaries.
Conclusions
The literature supports that limb loss in the United States has resulted in epidemic proportions. This study used public use, CMS data to demonstrate the disturbing patterns of lower extremity amputation rates nationwide. Our findings suggest that certain demographic and geographic factors such as age, race/ethnicity, sex, and location can influence the likelihood of undergoing a lower extremity amputation when better therapeutic alternatives exist. The study highlights the need for targeted interventions and improved access to preventive care services to address these disparities and reduce the burden of lower extremity amputations on Medicare beneficiaries who are not over 65 years of age. This research can serve as a call to action for policymakers, healthcare providers, and communities to work towards improving healthcare equity and ensuring that all individuals have access to high-quality care that preserves quality of life.
References
- Center for Disease Control and Prevention. National Diabetes Statistics Report. https://www.cdc.gov/diabetes/data/statistics-report/index.html. Accessed [June 15, 2022].
- Arinze NV, Gregory A, Francis JM, Farber A, Chitalia VC (2019) Unique aspects of peripheral artery disease in patients with chronic kidney disease. Vasc Med 24: 251-260. [Crossref]
- Bancks MP, Kershaw K, Carson AP, Gordon-Larsen P, Schreiner PJ, et al. (2017) Association of Modifiable Risk Factors in Young Adulthood With Racial Disparity in Incident Type 2 Diabetes During Middle Adulthood. JAMA 318: 2457-2465. [Crossref]
- Creager MA, Loscalzo J. Arterial Diseases of the Extremities. In: Jameson J, Fauci AS, Kasper DL, Hauser SL, Longo DL, Loscalzo J, eds. Harrison’s Principles of Internal Medicine, 21e. McGraw-Hill. 2023:2107-2114.
- Molina CS, Faulk J. Lower Extremity Amputation. 2022 Aug 22. In: StatPearls [Internet]. Treasure Island (FL): StatPearls Publishing; 2022. [Crossref]
- ka M, Raczyńska M, Marcinkowska K, Lisicka I, Czaicki A, et al. (2021) Amputations of Lower Limb in Subjects with Diabetes Mellitus: Reasons and 30-Day Mortality. J Diabetes Res 2021: 8866126. [Crossref]
- Arya S, Binney Z, Khakharia A, Brewster LP, Goodney P, et al. (2018) Race and Socioeconomic Status Independently Affect Risk of Major Amputation in Peripheral Artery Disease. J Am Heart Assoc 7: e007425. [Crossref]
- Henry AJ, Hevelone ND, Belkin M, Nguyen LL (2011) Socioeconomic and hospital-related predictors of amputation for critical limb ischemia. J Vasc Surg 53: 330-339.e1. [Crossref]
- Akinlotan MA, Primm K, Bolin JN, Ferdinand Cheres AL, Lee J, et al. (2021) Racial, Rural, and Regional Disparities in Diabetes-Related Lower-Extremity Amputation Rates, 2009-2017. Diabetes Care 44: 2053-2060. [Crossref]
- Hackler EL 3rd, Hamburg NM, White Solaru KT (2021) Racial and Ethnic Disparities in Peripheral Artery Disease. Circ Res 128: 1913-1926. [Crossref]
- Chen L, Zhang D, Shi L, Kalbaugh CA (2021) Disparities in Peripheral Artery Disease Hospitalizations Identified Among Understudied Race-Ethnicity Groups. Front Cardiovasc Med 8: 692236. [Crossref]
- Holman KH, Henke PK, Dimick JB, Birkmeyer JD (2011) Racial disparities in the use of revascularization before leg amputation in Medicare patients. J Vasc Surg 54: 420-426. [Crossref]
- Fanaroff AC, Yang L, Nathan AS, Khatana SAM, Julien H, et al. (2021) Geographic and Socioeconomic Disparities in Major Lower Extremity Amputation Rates in Metropolitan Areas. J Am Heart Assoc 10: e021456. [Crossref]
- Stevens CD, Schriger DL, Raffetto B, Davis AC, Zingmond D, et al. (2014) Geographic clustering of diabetic lower-extremity amputations in low-income regions of California. Health Aff (Millwood) 33: 1383-1390. [Crossref]
- Medicare & Medicaid Services, Medicare Data for the Geographic Variation Public Use Files. Accessed: May 22, 2022; available at https://www.cms.gov/Research-Statistics- Data-and-Systems/Statistics-Trends-and-Reports/Medicare-Geographic-Variation/GV_PUF.
- Agency for Healthcare Research and Quality and US Dept. of Health and Human Services. Prevention Quality Indicator 16 (PQI 16) Lower-Extremity Amputation Among Patients with Diabetes Rate July 2020. Area-Level Indicator. Type of Score: Rate. www.qualityindicators.ahrq.gov. AHRQ Quality Indicators™ (AHRQ QI™) ICD-10-CM/PCS Specification v2020.
- Li Y, Burrows NR, Gregg EW, Albright A, Geiss LS (2012) Declining rates of hospitalization for nontraumatic lower-extremity amputation in the diabetic population aged 40 years or older: U.S., 1988-2008. Diabetes Care 35: 273-277. [Crossref]
- Skrepnek GH, Mills JL Sr, Armstrong DG (2015) A Diabetic Emergency One Million Feet Long: Disparities and Burdens of Illness among Diabetic Foot Ulcer Cases within Emergency Departments in the United States, 2006-2010. PLoS One 10: e0134914. [Crossref]
- Barnes JA, Eid MA, Creager MA, Goodney PP (2020) Epidemiology and Risk of Amputation in Patients With Diabetes Mellitus and Peripheral Artery Disease. Arterioscler Thromb Vasc Biol 40: 1808-1817. [Crossref]
- Gerhard-Herman MD, Gornik HL, Barrett C, Barshes NR, Corriere MA, et al. (2017) 2016 AHA/ACC Guideline on the Management of Patients With Lower Extremity Peripheral Artery Disease: Executive Summary: A Report of the American College of Cardiology/American Heart Association Task Force on Clinical Practice Guidelines. Circulation 135: e686-e725. [Crossref]
- Lin JH, Jeon SY, Romano PS, Humphries MD (2020) Rates and timing of subsequent amputation after initial minor amputation. J Vasc Surg 72: 268-275. [Crossref]
- Creager MA, Matsushita K, Arya S, Beckman JA, Duval S, et al. (2021) Reducing Nontraumatic Lower-Extremity Amputations by 20% by 2030: Time to Get to Our Feet: A Policy Statement From the American Heart Association. Circulation 143: e875-e891. [Crossref]
- Durazzo TS, Frencher S, Gusberg R (2013) Influence of race on the management of lower extremity ischemia: revascularization vs amputation. JAMA Surg 148: 617-623. [Crossref]
- Lavery LA, van Houtum WH, Ashry HR, Armstrong DG, Pugh JA (1999) Diabetes-related lower-extremity amputations disproportionately affect Blacks and Mexican Americans. South Med J 92: 593-599. [Crossref]
- Barshes NR, Sharath S, Zamani N, Smith K, Serag H, et al. (2018) Racial and Geographic Variation In Leg Amputations Among Texans. Tex Public Health J 70: 22-27. [Crossref]
- Novack, S. Public Health: Life and Limb: Inside the Rio Grande Valley’s amputation Crisis.Texas Observer.March 4, 2019. https://www.texasobserver.org/life-and-limb/. Accessed. July 7, 2022.
- Stevens CD, Schriger DL, Raffetto B, Davis AC, Zingmond D, et al. (2014) Geographic clustering of diabetic lower-extremity amputations in low-income regions of California. Health Aff (Millwood) 33: 1383-1390. [Crossref]
- Amputee Coalition Factsheet. Texas. https://www.amputee-coalition.org/resources/texas-2/. [Accessed, July 10, 2022].
- Koma W, Cubanski J, Neuman T (2021) A Snapshot of Sources of Coverage Among Medicare Beneficiaries in 2018. Kaiser Family Foundation.