Abstract
The objective of this work was to determine the effect of ultrasound application on the formation and stability of foams at pH 3 made with whey protein isolate at 2 and 6%w/w and two hydroxypropylmethylcelluloses at 0.25%w/w, correlating with bubble images obtained from foams. The samples were sonicated for 20 min using an ultrasonic processor at a frequency of 20 kHz. Foam formation and stability were measured by conductimetric and optical methods. Moreover, the evolution of the bubble size change in the foam was determined by a second CCD camera. Changes of parameters were obtained solely by the polysaccharides addition, having a huge importance the behavior of these macro-molecules, however, it was observed that ultrasound treatment could be used to increment the density of mixed systems foams and retarding the drainage of liquid with a good image correlation.
Key words
Whey proteins, Polysaccharides, Foaming properties, Ultrasound
Introduction
Whey protein concentrates and isolates are important food ingredients because of their desirable functional properties, such as gelation, foaming and emulsification. Whey proteins are a significant source of functional protein ingredients for many traditional and novel food products [1]. The main proteins in whey are β-lactoglobulin (β-lg), α-lactalbumin (α-lac) and bovine serum albumin (BSA) and they account for 70% of total whey proteins [2]. These proteins are responsible for the functional properties of whey proteins, such as solubility in water, viscosity, gelation, emulsification, foaming, colour, flavor and texture enhancement and offer numerous nutritional advantages to formulated products [3].
Polysaccharides are used in admixture to proteins mainly to enhance stability of dispersed systems. They can strongly enhance the stability of protein foams by acting as thickening or gelling agents [4]. In addition, the surface-activity character along the structure of polysaccharides influences the foam formation parameters of proteins as well as the protein state and concentration.
The effect of ultrasound is related to cavitation, heating, dynamic agitation, shear stresses, and turbulence [5]. It may cause physical changes producing aggregates through non-covalent bonds by cyclic generation and collapse of cavities depending of structural or aggregation protein state.
In the present work 2 and 6% wt/wt of whey protein isolate was prepared at pH 3 and two surface-active polysaccharides were added at 0.25%w/w. Ultrasound was used in order to analyze the foaming formation and stability effect on mixed systems relating with the bubble size change.
Materials and Methods
Whey protein isolate and polysaccharides mixed systems
Whey protein isolate (WPI) was provided by Milkaut, Argentina. Two different concentrations were made to mix and reach 2 and 6% wt/wt and adjusted further to pH3.
Polysaccharides used were two tension-active polysaccharides, hydroxypropylmethylcelluloses called E4M and E50lv. The polysaccharides were added to soluble protein solutions in order to reach a final concentration of 0.25%, wt/wt of polysaccharides in each mixed system. These final solutions were treated by high intensity ultrasound (HIUS).
Foam formation
The foams were made using a Foamscan instrument (Teclis-It Concept, Logessaigne, France). The foam is generated by blowing nitrogen gas at a flow of 45 mL/min through a porous glass filter of 0.2 µm at the button of a glass tube where 20 ml of the foaming aqueous solutions (25 ± 1ºC) is placed. In all experiments, the foam was allowed to reach a volume of 120 ml. The bubbling was then stopped and the evolution of the foam was analyzed by means of conductimetric and optical measurements. The Final Time of Foaming (FTF), the Total Gas Volume (TGV) and the Final liquid volume (FLV) were taken from the table results after each experiment. The generated foam rises along a thermostated square prism glass column, where the volume is followed by image analysis using a CCD camera. The evolution of the bubble size change in the foam was also determined by a second CCD camera set with a macro objective which allows to capture the variation of the air bubble size every 5 s. Thus, the images of initial obtained foam could be obtained to characterize them.
As same way, foam drainage stability was determined from the volume of liquid drained from the foam over time [6]. The half-life time to drain (t1/2), referring to the time needed to drain V/2 can be expressed by Eq. (1) corresponding to an empirical second-order equation.
t 1/2 = (k2 Vo)-1 (1)
Where Vo is the liquid volume (ml) in the foam at time t = 0 and k2 is the second order drainage rate constant (min/ml-1).
To characterize also the obtained foam in each case, the relative foam conductivity (Cf, %) is a measure of foam density and was determined by Eq. (2).
Cf = C foam (f)/ C liq (f) × 100 (2)
Where Cfoam(f) and Cliq(f) are the final foam and liquid conductivity values, respectively.
The following parameters were determined: Foam Expansion (FE), as the inverse of the Foam Maximum Density (MD) determined by (3), is a measure of the liquid retention in the foam; the Overall Foaming Capacity (OFC, mL/s) was determined from the slope of the foam volume curve up to the end of the bubbling. The Foam Capacity (FC), a measure of gas retention in the foam, was determined by (4)
FE = Vfoam (f) / (Vliq (i) - Vliq(f) (3)
FC = Vfoam (f) / Vgas(f) (4)
where Vliq(i) and Vliq(f) are the initial and the final liquid volumes; Vfoam(f) is the final foam volume and Vgas(f) is the final gas volume injected.
High-intensity ultrasound (HIUS) treatment
WPI-polysaccharides solutions at different protein concentrations were sonicated for 20 min using an ultrasonic processor Vibra Cell Sonics, model VCX at a frequency of 20 kHz and an amplitude of 20%, which were constant. A 13 mm high grade titanium alloy probe threaded to a 3 mm tapered microtip was used to sonicate 10 ml of the solutions. Samples contained into glass test tubes were immersed into a glycerine-jacketed at 0.5ºC to dissipate most of the heat produced during sonication treatments (Polystat, Cole-Parmer).
Statistical analysis
All the experiments were performed in duplicate or triplicate. The model goodness-of-fit was evaluated by the coefficient of determination (R2) and the analysis of variance (ANOVA), using Statgraphics Plus 3.0. software.
Results and Discussion
Efficiency in foam formation
Since the foaming protocol determines that the nitrogen flow stops once the foam height reaches 120 ml, the foaming time, the gas required during the bubbling and the remaining liquid will depend on the ease of the solution to form the foam, which would relate to the overall foaming capacity in each case. In the Table 1 it can be seen the Final Time of Foaming (FTF), the Total Gas Volume (TGV) incorporated into the foam and the Final liquid volume (FLV), corresponding to the remaining liquid after foam formation; for untreated (Control) and HIUS treated systems. Thus, we can assume a better efficiency in foam formation when the Final Time of Foaming is low, also the Total Gas Volume incorporated and high the liquid incorporated, that it means, a low remaining FLV [7].
Table 1. Final Time of Foaming (FTF), Total Gas Volume (TGV) and Final Liquid volume (FLV) for untreated (Control) and HIUS treated for whey protein isolate alone (Wpi), at 2 and 6%w/w and the polysaccharides (E4M and E50lv at 0.25%w/w), addition.
System |
FTF(±10 s.) |
TGV(±5 cm3) |
FLV(±3 cm3) |
FTF(±10 s.) |
TGV(±5 cm3) |
FLV(±3 cm3) |
Wpi2% |
207 |
151.5 |
18 |
160 |
116 |
14.05 |
Wpi6% |
171.5 |
125 |
12.7 |
159.5 |
115.5 |
14.15 |
E4M0.25% |
153 |
112 |
9.8 |
152 |
110.5 |
10.3 |
E50lv0.25% |
131 |
94.5 |
8.8 |
153 |
111.5 |
10.5 |
W2%/E4M0.25% |
157.5 |
114.5 |
9.15 |
153 |
110.5 |
9.6 |
W6%/E4M0.25% |
156 |
113 |
9.55 |
153 |
111.5 |
9.65 |
W2%/E50lv0.25% |
157 |
114.5 |
12.9 |
152 |
111 |
9.45 |
W6%/E50lv0.25% |
156 |
113.5 |
8.9 |
153 |
111 |
9.95 |
The Table 1 shows that the three parameters were decreased when polysaccharides were added in general to 2 and 6% of whey protein. This implies a better performance with the polysaccharides addition, which means, a faster foam formation, with lower gas quantity needed and more solution incorporation, of untreated (Control) and HIUS treated systems. By comparing with the polysaccharides behavior alone, it could be seen that mixed systems followed the polysaccharides behavior, even with the bulk viscosity increased after the addition, it was shown that polysaccharides improve the foam formation for all protein concentration.
Perez et al. (2007) [8] determined the mixed performance of whey protein concentrate and HPMCs systems at air liquid interfaces. They studied the competitive behavior of mixed films adsorbed using E4M, E50lv and F4M with different interfacial properties, studied by measurement of the dynamics of adsorption. The interfacial behavior difference may be attributed to differences in the molecular weigh between polysaccharides.
They observed that in the presence of E4M a strong competence for the interface can be observed at short adsorption time. As E4M is more surface active than WPC, the replacement of E4M at the interface by WPC resulted in lower surface pressure. The mixture approached E4M behavior at longer adsorption time. An additive or synergistic behavior was observed for celluloses with lower surface activity (E50LV and F4M) at the lowest WPC and HPMC concentrations in the aqueous phase. A depletion mechanism in the vicinity of the interface would predominate in the presence of E50LV and F4M over the competence for the interface, giving rise to a cooperative behavior.
Previously published work, using soy protein isolate and identical polysaccharides in similar conditions, resulted in different results [7]. In that work, ultrasound led to increase the FTF and the TGV, becoming less efficient in the foam production after treatment. It could be very important the protein amount (soy soluble protein was 0.43% at this pH) and of course the different protein structure.
Effects of HIUS on other parameters for formation and stability of foams
In Figure 1 and 2 (a-c) it can be seen the HIUS effect for mixed systems with E4M and E50lv and whey protein on FE, FC, MD, Cf (%), OFC and t1/2 of liquid drainage.
Figure 1. (a) FE and FC for whey protein isolate (w) (2 and 6%w/w) with E4M, 0.25%w/w at mixed systems for treated (H) and untreated samples, (b) MD and Cf(%) and (c) OFC and t1/2 liquid drainage for identical systems.
Figure 2. (a) FE and FC for whey protein isolate (w) (2 and 6%w/w) with E50lv, 0.25%w/w at mixed systems for treated (H) and untreated samples, (b) MD and Cf(%) and (c) OFC and t1/2 liquid drainage for identical systems.
It can be seen, in general terms, that there were no changes in FE, FC, Cf% and OFC, however, there were changes for MD and t1/2 of liquid drainage. Having into account that MD did no change for components alone (data not shown) after HIUS application, it can be concluded that the MD increment was seen exclusively on the mixed system after treatment. This, obligates to have in mind the importance of inter-molecules interactions, even the non-covalent ones. The mixed system generates foams with a higher global density after HIUS treatment than the components in a separate way.
As was above mentioned, [8] observed an additive or synergistic behavior for celluloses at the lowest WPC and HPMC concentrations in the aqueous phase, which different mechanisms reaching to a cooperative behavior.
In the other hand, it can be seen also an increment of the half time to drainage (t1/2) as a consequence of HIUS application for the most of the mixed systems. Probably, the higher density of foams (MD) would be related with this fact. Thus, more solution incorporated to foam, would led to more amount of surfactant molecules present (protein and polysaccharides in this case) at air-liquid interface, promoting a better viscoelastic interfacial film formation, increasing the liquid retention and consequently, time to drainage delay [9-11]. When HIUS was applied to components alone (data not shown), it could be seen that t1/2 drainage for polysaccharides was unchanged after treatment. However, when HIUS was applied on proteins alone (2 and 6%), the t1/2 drainage was increased, which denotes a meanly behavior for mixed system leading for the protein performance.
The Table 2 shows the initial foam aspect for untreated (Control) and HIUS treated mixed systems. It can be seen that comparative size for bubbles of the initial formed foam, were decreased for most of systems after HIUS treatment, with the exception of E50lv addition. This fact, coincides with lower FLV (Table 1), higher MD parameter (Figures 1-2b) and higher t1/2 drainage (Figures 1-2c). Although, apparent responsible molecule would be different in each described measure, by comparing the bubbles carefully, it can be seen for wpi6%/E50lv0.25% mixed system foam that it was unchanged after HIUS treatment. This, could be attributed to less liquid incorporation (higher FVL, Table 1) and coincides at same time with lower t1/2 drainage (Figure 2c). As a result, it can be concluded that the initial foams aspect obtained could be related with the protein performance after the treatment.
Table 2. Initial Foam Aspect for untreated (Control) and HIUS treated mixed systems.
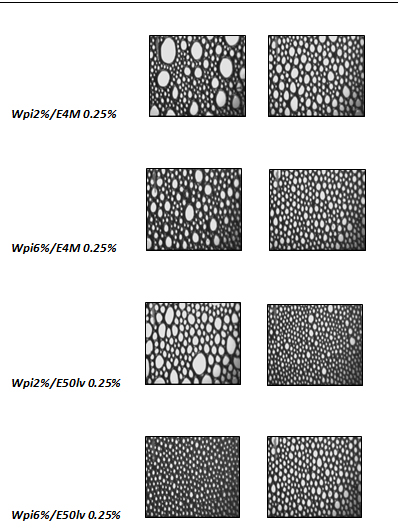
Images with at least three replicates, independently foamed. HIUS Conditions: time of treatment: 20 minutes, frequency: 20 kHz; amplitude: 20%
In a previous submitted work we observed identical behavior by using same systems, and same experimental techniques, to another pH (7). Having into account that electrostatic protein charge was the unique difference, it can be said that this characteristic would not be related with the protein-polysaccharide interactions with HIUS treatment.
In the other former works identical correlations were obtained; when size bubbles were lower after HIUS treatment, t½ liquid drainage increased o were unchanged [7,12-14]. This fact confirms that there is a relationship between the initial bubble aspect obtained from the foam and the subsequent drainage behavior whatever the protein were studied.
Thus, all these correlations between different parameters demonstrate the complexity in the foam formation and stability phenomenon by the bubbling method. It is refer to a huge number of factors; surface active behavior (diffusion velocity of adsorption at the interfacial film of protein-polysaccharides interaction, competitive character for HPMCs, penetration and rearrangement velocity of macromolecules at liquid interface), interfacial and bulk viscosity, molecular size and shape, concentration of protein between others.
Conclusions
Solution quantity inco2021 Copyright OAT. All rights reservd be depend on the polysaccharides, whereas drainage time of foams would be related with the protein performance as components alone. However, global density of foams could be leading by the mixed system, showing possible synergistic interactions.
As was previously observed at pH 7, a deep and detailed interfacial study between whey protein isolate at 6% and E50lv, 0.25% would be needed to understand the particular interaction between protein and this special polysaccharide, regardless the charge of protein.
The bubble images by the second camera during the foam formation by bubbling method could be used to predict the drainage performance of these systems studied both pH 7 as was previously observed and pH 3.
Ultrasound application would be adequate to improve protein/polysaccharides mixed systems against drainage of foams.
Acknowledgement
This research was supported by National Council of Scientific and Technical Research of the Argentine Republic (CONICET), University of Buenos Aires and Department of Chemical Engineering, Faculty of Chemistry, University of Seville.
Conflicts of Interest
The authors declare no conflict of interest.
References
- Mishra S, Mann B, Joshi VK (2001) Functional improvement of whey protein concentrate on interaction with pectin. Food Hydrocolloids 15(1), 9-15.
- Cayot P, Lorient D (1997) Structure-function relationships of whey proteins. In: Dekker, M. (Ed.), Food Proteins and their Applications, New York, USA.
- Krešic G, Lelas V, Jambrak AR, Herceg Z, Brncic SR (2008) Influence of novel food processing technologies on the rheological and thermophysical properties of whey proteins. Journal of Food Engineering 87(1), 64-73.
- Dickinson E (2003) Hydrocolloids at interfaces and the inluence on the properties of dispersed systems, Food Hydrocolloids, 17(1) 25-39.
- Knorr D, Zenker M, Heinz V, Lee D (2004) Applications and potential of ultrasonics in food processing. Trends in Food Science & Technology, 15(5), 261-266.
- Carrera C, Rodriguez Patino JM (2005) Interfacial, foaming and emulsifying characteristics of sodium caseinate as influenced by protein concentration in solution. Food Hydrocolloids, 19, 407-416.
- Martinez KD, Carrera Sanchez C (2014a) New view to obtain dryer food foams with different polysaccharides and soy protein by high ultrasound. International Journal of Carbohydrate Chemistry, 6 pgs.
- Perez OE, Carrera Sanchez C, Rodriguez Patino JM, Pilosof A (2007) Adsorption dynamics and surface activity at equilibrium of whey proteins and hydroxylpropylmethylcellulose mixtures at the air-water interface. Food Hydrocolloids, 21, 794-803.
- Dickinson E (1992) An introduction to food colloids. New York: Oxford University Press.
- Wilde PJ, Clark DC (1996) Foam formation and stability. In: Methods of testing protein functionality. London: Blackie Academic. 110-152.
- Foegeding E, Luck P, Davis J (2006) Factors determining the physical properties of protein foams. Food Hydrocolloids, 20, 284e292.
- Martínez K, Carrera Sanchez C (2014b) Ultrasound as a Method to Control Protein–Polysaccharide Foam Stability by Microscopic Parameter Alteration. Journal of Food Processing and Preservation, 39(6), 1272-1277.
- Martínez K, Sanchez C (2016a) Improved Functionality of Foamed WPI Solutions by Ultrasound Application. J Food Chem Nanotechnol, 2(2), 79-84.
- Martínez K, Sanchez C (2016b) Effects of high ultrasound intensity on foam stability and interfacial relationship of soluble soy protein isolate. Biointerface Research in Applied Chemistry, 6(6).