Purpose: The drug Zoledronic acid (ZOL) has been extensively studied as a therapeutic strategy to treat breast cancers. Previous data show the triple negative breast (TNBC) samples are particularly sensitive to killing following exposure to the drug. The goal of this current study was to examine the effect of ZOL on TNBC and identify genes that might contribute to this sensitivity.
Methods: A cell line model was used to perform experiments to determine the dose effect of ZOL on TNBC and the genes differentially expressed following drug exposure. Following treatment, the mode of death was established and the transcriptomes of the cells were examined via microarray and differentially expressed genes were identified and validated via transcript and protein expression analyses.
Results: Data show that TNBC cells are sensitive to killing following ZOL, with cell death occurring via the autophagy mechanism. Data also show an enrichment in dysregulation in signalling events related to cell cycle regulation. Previous studies have shown involvement of the cell cycle regulator CDKN1A/p21. We observed similar involvement of CDKN1A/p21, but in addition we found down-regulation of the mitotic serine/threonine kinase AURKA gene.
Conclusion: In autophagy associated cell death in TNBC, ZOL functions via cell cycle-mediated signalling events related to regulation of CDKN1A proteinase inhibitor and down-regulation of AURKA kinase.
Zoledronic acid, cell cycle, breast cancers
Zoledronic acid (ZOL) belongs to the class of nitrogenous cyclic bisphosphonate compounds [1]. The drug is approved for the treatment of a number of bone diseases including hypercalcemia occurring in cancers, osteoporosis in both the absence and presence of cancers, and Paget’s disease, a disease related to errors in the bone remodeling mechanisms [2-4]. ZOL has proven to decrease bone resorption, and thus is an effective preventative treatment against bone fractures. The drug is absorbed by osteoclast and binds to hydroxyapatite molecules in bone, eventually activating cell death mechanisms. Mechanistically, studies show that ZOL inhibits farnesyl diphosphate synthase, an enzyme in the mevalonate pathway in these cells. Dysregulation of the mevalonate pathway leads to a reduction in the post-translational prenylation of proteins which include osteoclast GTPases, and this in turn leads to disruption of cellular events and ultimately cell death [5]. In addition to its effects in osteoclasts, ZOL has an anti-cancer effect in both clinical and experimental model systems. The drug can block or inhibit cell migration, invasion, and metastasis of cancer cells [6]. Although the results are mixed, studies suggest that ZOL can be an effective therapy in different cancers, and in particular types of breast cancers [7].
The Azure and the Austrian Breast & Colorectal Cancer Study Group 12 (ABCSG12) clinical trial studies were the earliest studies designed to determine the utility of ZOL in breast cancer treatment [8,9]. Data from the studies suggest ZOL is most effective in a low estrogen cellular environment as is present in estrogen receptor-negative and/or in postmenopausal women whom are often receptor-negative. Hence, ZOL has been considered as a therapy for receptor-negative patients. These results are of particular interest because there are fewer therapies available for the treatment of receptor-negative patients and the cancers have a less favourable clinical outcome. Because the drug might be clinically useful, it is important to further characterize the mechanism of action of ZOL in TNBC and breast cancers in general.
Cell line model systems are instrumental in determining the mechanism of action of ZOL. Utilizing the MDA MB231 cells to represent TNBC, investigators show that TNBC cells are sensitive to killing by ZOL, consistent with the results observed in the clinical studies [10]. Buhler et al. [11] suggest that ZOL affects survival by reducing the metastatic potential of receptor-negative cells by decreasing their motility and cellular velocity. Rachner et al. [10] suggest the anti-tumor effects of ZOL are due to anti-proliferative signalling mechanisms related to targeting the tumor necrosis factor family of cytokine genes and other anti-inflammatory-related genes. Similarly, Morony et al. [12] showed that ZOL led to modulation of the Receptor Activator of Nuclear Factor Kappa B Ligand (RANK/OPG) and CXCR4 cytokine associated signalling pathways in tissues prepared from breast cancer patients. Altogether, data further support the effect of ZOL on MDA MB231 and other TNBC, as these cell types are known to express substantial levels of inflammatory-related genes.
ZOL can lead to cell death via dysregulation of cell cycle signalling in receptor-negative cells. Studies show that cell cycle arrest can occur via dysregulation of cyclins and the CDKN1A/p21 cyclin regulator with eventual cessation of S phase in breast and non-small cell lung cancer [13,14]. In a separate study Ottewell et al. [15] found that administration of ZOL to tumor-bearing mice reduced tumor volume and proliferation via modulation of cyclins D1, D3 via the CDKN1A/p21 cyclin regulator. The goal of this current study was to further characterize the effect of ZOL on TNBC. Under the experimental conditions defined here, ZOL led to differential gene expression of cell cycle related genes in both breast subtypes, but the pattern of expression and genes effected differed from that observed in previous studies. Data presented here support the role of AURKA kinase as a key gene effected by ZOL treatment in TNBC, with AURKA associated with up-regulation of the cyclin dependent kinase inhibitor CDKN1A/p21. Data related to ovarian cancer show that loss of AURKA leads to upregulation of CDKN1A/p21; we suggest a similar pattern of regulation in breast cancers following exposure to ZOL [16,17].
Cell line and cell culture
The MDA MB231 cell line was purchased from ATCC.org (Manassas, VA, USA). MDA MB231 was chosen to represent the basal-like/TNBC cell line. The cells were cultured in Dulbecco's Modified Eagle Minimum essential media (DMEM) (Millipore, Sigma, St. Louis, MO, USA) supplemented with 1% penicillin and 10 % serum (FBS) in a 37°C and 5% CO2. The cells were fed twice weekly and passaged when they reached 90% confluence using a 0.25% trypsin solution (Millipore, Sigma, St. Louis, MO, USA).
Zoledronic acid dose response
ZOL was purchased from Sigma Aldrich (CAS number 165800-06-6; St. Louis, MO, USA) and suspended in saline as suggested by the manufacturer. Exponentially growing cells were treated with ZOL at different concentrations ranging from zero to 500uM for times up to 72hours. The 48-hour time point was chosen for down-stream experimental analyses because a substantial number of cells remained viable and available for downstream analyses at this time point.
Cell proliferation and viability analyses
The MTT (3-(4, 5-dimethylthiazolyl-2)-2, 5-diphenyltetrazolium bromide) assay was utilized to determine cell proliferation and cytotoxicity (catalog number G400; Promega, Madison, WI, USA). The MTT stock solution was prepared according to the manufacturer’s suggestions. Briefly, 5mg/ml MTT was added without phenol red or PBS and filtered through a 0.2 um filter and stored at 2-8ºC. The final volume of the 1:10 MTT working solution was calculated. MDA MB 231 cells were plated in a 96 well plate at 4,000 - 5,000 cells per well one day preceding the experiment. The following day, the cells were treated with concentrations of ZOL including 0, 25, 35, 50, 100, 200, 300, 400 and 500ug/mL for 48hours while incubated at 37ºC; doses of 100-500uM were performed for the initial dose response assessments. A 20ul solution of the MTT solution (5mg/ml stock) was added to each well. The 96 well plates were again incubated @ 37°C with 5% CO2 for 4 hours. The medium was removed and 100 µl of DMSO was added to each well. Cell preparations were agitated on an orbital shaker (rotate plate) for 5 to 10 minutes and the absorbance was determined using a plate reader to measure the OD540 nm (reference absorbance value is 690nm).
RNA extraction and purification
Exponentially growing cells were treated with ZOL and used for the RNA analyses. Total RNA was isolated from the cells using the TrizolTM reagent (Life Technologies Inc., Grand Island, NY) as suggested by the manufacturer and further purified using the Qiagen RNeasy Mini Kit also as suggested by the manufacturer. The quantity and quality of the RNA was determined via spectrophotometer and 3-N-morpholino propanesulfonic acid (MOPS) gel electrophoresis, respectively.
Microarray and data analyses
The transcriptomes of control, 35uM and 50uM ZOL treated samples were examined using Affymetrix DNA microarray technology. The labelled aRNA preparations and microarray hybridizations were performed by the University of Texas (UT) Southwestern Medical Center Microarray Core Facility (Dallas Texas, USA) using Affymetrix U133plus 2 gene-chips and the CEL intensity files were made available to Texas Southern University for down-stream bioinformatics analyses. The quality of the hybridizations were determined using Box and Whisker plots, percent hybridization and scaling factors. All of the hybridizations demonstrated high-quality metrics as required by Affymetrix.com. CEL intensity files were uploaded into the mAdb web portal https://madb.nci.nih.gov/ for dataset analyses [18]. The mAdb is a password protected web-based bioinformatics resource supported by the National Cancer Institute at the National Institutes of Health (Bethesda MD, USA). mAdb contains bioinformatics tools which allow for analyses of the ZOL treated datasets. Genes chosen as differentially expressed demonstrated at least a 1.3-2.0 fold level of differential expression with p-values <0.05. Analyses of the protein-protein interactions and a summary of their corresponding cell signalling mechanisms were obtained via STRINGTM analyses [19].
Complementary DNA (cDNA) generation
The cDNA was generated using the iScriptTM Reverse Transcriptase kit purchased by BioRad (Hercules, CA, USA) according to the manufacturer’s suggestion. This material was used for down-stream polymerase chain reaction (PCR) reactions to determine the relative difference in gene expression levels between the various samples.
Primer design and PCR chain reaction analyses
The genes chosen for this study were based on differential expression on the DNA Microarray. The sequences corresponding to the genes were selected based on the Affymetrix probe-set sequences available at NetAffxTM (http://www.affymetrix.com/estore/analysis/index.affx). PCR primers were designed by analyzing the sequences using the Primer 3TM software (http://bioinfo.ut.ee/primer3-0.4.0/), using the default primer sequence analyses conditions. The forward primer sequence for AURKA is 5’TGACCCCGATCAGTTAAGGAG and the reverse is 5’TGCCGGACAGACACACAG3’ (Affymetrix probe-set 204092_s_at). The forward primer sequence for CDKN1A (p21) is 5’TTAGCAGCGGAACAAGGAGT3’ and the reverse is 5’GCCGAGAGAAAACAGTCCAG3’ (Affymetrix probe-set 202284_s_at). The forward primer sequence for GAPDH is 5’TCCCTGAGCTGAACGGGAAG3’ and reverse is 5’GGAGGAGTGGGTGTCGCTGT3’. The PCR was performed using the AmpliTaq GoldTM master mix reagent and the procedure was performed as suggested by the manufacturer (Thermo Fisher, Waltham MA, USA). The PCR products were analyzed on a 2% agarose gel, photographed and visualized using the LiCor (Lincoln NE, USA) gel analysis system.
Western blotting
Exponentially growing cells were treated with ZOL and used for protein analyses. Following ZOL treatments, cells were collected and lysed using RipaTM lysis buffer and protein estimates determined using Bio-Rad reagents (Bio-Rad Life Science Research, Hercules, California, USA). Thirty to fifty micrograms of protein were resolved by gel electrophoresis for downstream detection of the target proteins via antibody. The primary antibody concentrations and incubation times were determined based on the recommendation of the supplier. Results of the western analyses were determined via the ECL detection procedure also supplied by BioRad Company.
Antibodies: Antibodies used in the study were purchased from Novus Biologicals (Littleton CO): LC3 (NB600-1384), Actin (NB600-501SS), CDKN1A/p21 (MAB1047-SP) and AURKA (NBP2-22118SS) at a 1:1000 dilution. Secondary HRP conjugated anti mouse (HAF007) and anti-rabbit (NBP-2-30348H) antibodies were used at a 1:4000 dilution. Bound antibodies were visualized with the Clarity Western ECL substrate (Bio-Rad, Hercules, CA, USA) on a LICOR digital imaging system (LI-COR Biotechnology, Lincoln, NE, USA).
Assessment of autophagy cell death
The MDA MB231 cells were plated on 6-well dishes or T75 cm2 ventilated cell culture flasks, allowed to attach for 24hours, followed by the addition of ZOL (35uM and 50μM) and incubated for 48hours. Control cells were similarly incubated in medium without the drug. LC3 cleavage was assessed via the Western blot procedure as provided above.
Pan caspase inhibitory assay for assessment of caspases-dependent apoptosis
Z-VAD-FMK is a pan-caspase inhibitor. The reagent permeates the cell and irreversibly binds to and subsequently inhibits caspases. The Z-VAD-FMK molecule can therefore be used to determine the role of caspases, hence caspases-mediated apoptosis in particular cell types (AdooQ Bioscience, catalog number A12373; Irvine, CA, USA). The procedure was performed as recommended by the manufacturer. IC50 for the reagent is 0.0015 - 5.8 mM. To determine whether the mode of death in MDA MB231 following ZOL was due to apoptosis, the cells were incubated with the pan-caspase inhibitor. MDA MB231 cells were treated with 20 μM Z-VAD-FMK for 1hour prior to exposure to ZOL at various concentrations for 48hours. The cells were photographed using a Nikon Eclipse Ti camera (Nikon Corporation, Chiyoda-ku, Tokyo, Japan).
ZOL leads to cytotoxicity and decreased viability in TNBC cells.The primary goal of this study was to determine the effect of ZOL on TNBC and identify genes differentially expressed following exposure to the drug. MDA MB231 cell lines were chosen to represent the TNBC subtype. The cells were exposed to doses up to 500uM ZOL for 48 hours and the effect of the drug on cell cytotoxicity was measured using the MTT assay. Data show the drug had a drastic effect on MDA MB231 TNBC cells (Figure 1). These data were consistent with previous studies which demonstrated a pronounced effect of the drug on the TNBC cell line [20]. Utilizing the MTT assay, 50% cytotoxicity of MDA MB231 cells was observed at 35uM ZOL and approximately 70% cytotoxicity at 50uM ZOL. Results using the hemocytometer showed 35uM ZOL resulted in approximately 40% loss in viable cells and 50uM ZOL resulted in approximately 60% loss in viable cells (data not shown).
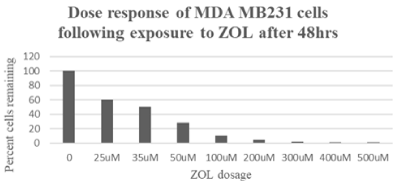
Figure 1. MTT cytotoxicity analyses to demonstrate the effect of ZOL on MDA MB231 cells. MDA MB231 show significant cell death following ZOL doses
Zoledronic acid induced cell death in TNBC did not occur via caspase-dependent apoptosis signalling
The Z-VAD-FMK pan-caspase inhibitor was used to determine the possible involvement of caspases, hence caspase-mediated apoptosis in the mode of death in MDA MB231 cells. Results showed that even when caspases were inhibited, cell death was detected (Figure 2), hence there was no evidence of the involvement of caspases-mediated apoptosis in the death of the MDA MB231 cells. There was also no evidence of appreciable levels of cleaved caspase 3 or caspase-independent apoptosis involvement (data not shown).
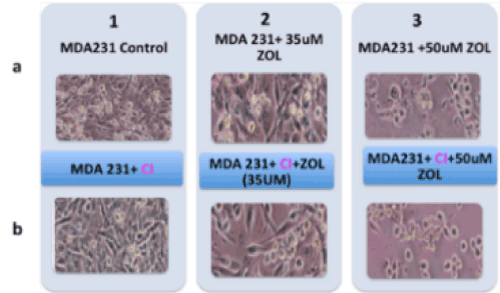
Figure 2. Effect of Z-VAD-FMK pan-caspase inhibitor on MDA MB231 cells. Lane 1A representing MDA MB231 cell (control); 1B representing MDA MB231 control cell exposed to pan caspase inhibitor; 2A, MDA MB231 treated with 35μM of ZOL; 2B, MDA MB231 cell exposed to pan caspase inhibitor then treated with 35μM of ZOL; 3A, MDA MB231 treated with 50μM of ZOL; 3B, MDA MB231 cell exposed to pan caspase inhibitor then treated with 50μM of ZOL
Cell death in TNBC via autophagy signalling mechanism
Autophagy is a survival mechanism, but when cells are unable to support homeostasis, the autophagy cell death mechanism is activated. The LC3 protein has proven to be a reliable marker for detection of autophagy signallsing. During autophagy induction, LC3I is lipidated and converted to LC3II. LC3II is a marker of autophagosome development and thus autophagy. Previous data show that ZOL can induce cell death in breast and other cancer cell types by autophagy [21,22]. Our data are consistent with these studies, as demonstrated by cleavage of LC3 protein in MDA MB231 cells with increasing doses of ZOL (Figure 3).
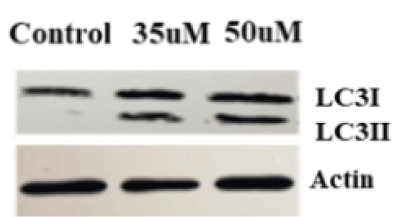
Figure 3. ZOL induced autophagy in Triple negative breast cancer. MDA MB231 cells were treated with ZOL at control, 35uM and 50uM concentrations for 48hours. Total protein was extracted from cells to perform Western blot. LC3 antibody was used to detect LC3I and LC3II
Summary of microarray values for genes chosen as differentially expressed following exposure of MDA MB231 cells to ZOL
Table 1 summarizes the DNA microarray results for the candidate genes selected as differentially expressed following exposure of MDA MB231 cells to ZOL. AURKA and CDKN1A appeared responsive to both 35uM and 50uM ZOL doses. AURKA gene was down-regulated and CDKN1A gene levels were up-regulated.
Table 1. DNA Microarray Results for genes-of-interest in MDA MB231. Data were extracted from microarray to demonstrate the fold change and significance p-value and brief description for the genes-of-interest. “↑” up arrow designates up-regulation and “↓” arrow designates down-regulation of the gene-of-interest following ZOL
Gene |
35uM ZOL |
50uM ZOL |
Description |
Fold change |
p value |
Fold change |
p value |
AURKA |
1.36 ↓ (down) |
0.02 |
2.3 ↓ (down) |
0.0096 |
Aurora A cell cycle regulated kinase |
CDKN1A(p21) |
1.68 ↑ (up) |
0.001 |
2.16 ↑ (up) |
0.0056 |
Cell cycle dependent kinase inhibitor |
Experimental validation of loss of expression of AURKA and increase in CDKN1A/p21 expression in MDA MB231 cells following exposure to ZOL
Several genes were initially selected for analyses based on the results generated utilizing DNA microarray. However, following repeated experimental analyses, only AURKA and CDKN1A/p21 genes consistently demonstrated differential expression when examined via PCR and protein analyses. These data show down-regulation of AURKA transcript (Figure 4a) and protein expression (Figure 4b) with treatment of ZOL in TNBC cells, and up-regulation of CDKN1A/p21 transcript (Figure 5a) and protein gene expression (Figure 5b) with increased doses of ZOL. AURKA is a serine-threonine kinase which is necessary for centrosome maturation and mitotic cell cycle progression and CDKN1A/p21 is a cyclin-dependent kinase inhibitor [23,24]. In an ovarian cancer cell model, data show that down-regulation of AURKA leads to restoration of CDKN1A/p21 similar to the relationship observed in this current study [16,17]. The STRINGTM analyses was utilized to demonstrate the documented interactions between the two proteins. Protein-protein interactions noted by STRINGTM were based on experimental determinations and text mining with false discovery rates ranging from 0.0029-0.0076 (Table 2).
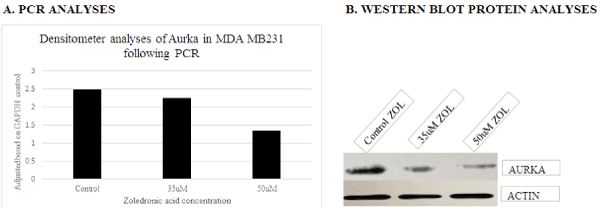
Figure 4. PCR transcript and Western blot analyses of AURKA gene expression in MDA MB231 cells lines following exposure to control, 35 and 50uM ZOL. Data show decreased expression of the transcript and protein levels of AURKA with ZOL treatment of MDA MB231 cells for 48 hours. A= transcript analyses and B=Western blot protein analyses of MDA MB231 cell preparations
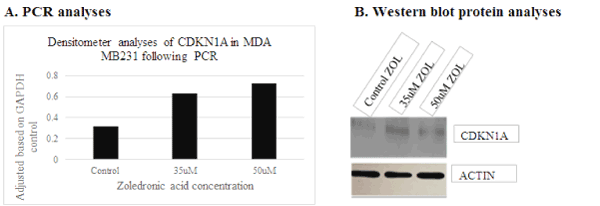
Figure 5. Increased transcript and protein expression of CDKN1A/p21 levels in MDA MB231 following 35 and 50uM ZOL 48hours. CDKN1a was analyzed for transcript and protein expression in MDA MB231 cells treated with ZOL. A= transcript analyses and B=western blot protein analyses of MDAMB231 cell preparations
Table 2. STRINGTM analyses of CDKN1A/p21 and AURKA to demonstrate protein-protein associations. Pathway analyses data show significant association of both proteins to cycle related signalling mechanisms and to each other
Biological process (GO) demonstrating relationship between AURKA and CDKNA1 |
GO term |
Description |
Count in set |
False discovery rate |
GO : 0031647 |
Regulation of protein stability |
2 of 251 |
0.005 |
GO : 0031100 |
Animal organ regeneration |
2 of 79 |
0.005 |
GO : 006977 |
DNA damage response, signal transduction by p 53 |
2 of 59 |
0.005 |
GO : 0000086 |
G2/M transition of mitotic cell cycle |
2 of 123 |
0.005 |
GO : 0043066 |
Negative regulation of apoptotic process |
2 of 859 |
0.0206 |
Results from both clinical and experimental studies show that patients with certain types of breast cancers benefit from specific ZOL treatment regimens. The results from these studies are mixed, but even though ZOL can affect some receptor positive patients, data suggest the drug demonstrates a differential pattern of killing in receptor-negative TNBC compared to other breast cancer types [7,25-28]. Breast cancers are extremely heterogeneous, so further characterization of the differential responses of particular breast cancers to the drug should lead to better understanding of breast cancers in general. The primary goal of this current study was to examine the effect of ZOL on TNBC in efforts to identify genes that might contribute to the sensitivity of the cells to the drug. We suggest the cell signalling events described as a part of this study contribute to TNBC sensitivity.
Previous studies show that ZOL can act as an anticancer drug by blocking or deregulating many of the steps involved in tumorigenesis including dysregulation of cell cycle signalling mechanisms. Changes in the regulation of cell proliferation are key to tumorigenesis, however it is still unclear as to which genes drive the aberrant processes following ZOL treatment. Animal studies by Ottewell et al. [15] show that ZOL functions by down-regulation of cyclins D1 and D3 cell cycle genes leading to reduced cell proliferation and tumor volume. Although the genes involved in the processes differ, data presented here also suggest involvement of ZOL in cell proliferation and cell cycle signalling mechanisms in TNBC cells. Data from this current study show that ZOL leads to down-regulation of AURKA expression and up-regulation of CDKN1A/p21 in MDA MB231 cells. AURKA is a serine-threonine kinase which is necessary for centrosome maturation and mitotic cell cycle progression [23]. CDKN1A/p21 inhibits the activity of cyclin-dependent kinases CDK1, CDK2 and CDK4/6 complexes, so cyclin and cyclin-dependent kinase complexes are no longer functional, leading to inhibition of cell cycle progression [29]. Similar to the experimental results described here, Ibrahim et al. [28] exposed MDA MB231 cells to 50uM ZOL and observed up-regulation of CDKN1A/p21 with subsequent slowing of cell cycle signalling. The authors, however, did not demonstrate an effect on AURKA gene expression as observed in our study. There is convincing evidence that AURKA can affect CDKN1A/p21 expression in ovarian cancers [16,17]. Previous studies went on to show that loss of AURKA restores CDKN1A/p21 expression. We suggest a similar pattern of regulation under our experimental conditions. We suggest that the AURKA gene is a principal target for ZOL and the subsequent loss of expression of AURKA leads to up-regulation of CDKN1A/p21 expression and down-regulation of the cell cycle signalling mechanisms.
In addition to the effect on CDKN1A/p21, AURKA has been shown to regulate and phosphorylate PLK1 [16,30] and activate CDK1 at the centrosome [16]. Gene-set enrichment analyses of our microarray datasets demonstrated statistically significant downregulation of CDK1 and PLK1 genes along with CCNB1 and TTK cell cycle signalling genes in MDA MB231 cells. CDK1, PLK1, CCNB1 and TTK genes however did not show consistent experimental validation via transcript and protein analyses, as a result, they were not considered as reliable gene candidates. Had CDK1 and PLK1 validated via experimental analyses of MDA MB231 cells, a more compelling argument could be made for AURKA being a key target for ZOL.
We found that prior to ZOL treatment in MDA MB231 cells, there were detectable levels of CDKN1A/p21, which only further increased with drug exposure. Oppositely, there were higher levels of AURKA prior to treatment, with substantial downregulation following ZOL. As far as we are aware, our observation that AURKA is down-regulated following exposure to ZOL has not been documented. Previous studies show that prior to exposure to drugs or any sort of manipulations, AURKA is over-expressed in some breast cancer subtypes [31-34]. AURKA gene maps to chromosome region 20q13.2 which is known to be amplified in cancers, including breast cancers where amplification is related to aggressive clinical behavior [35]. The gene is considered to be a promising therapeutic target for breast cancers, to the point that targeted inhibitors are being designed and tested [36]. As validation of the levels of AURKA and a select panel of genes in patient samples, we used the Oncomine web-based data analyses tool to examine our gene panel in the Oncomine Curtis breast cancer dataset (data not shown). The goal of this analyses was to compare the gene expression pattern of AURKA to that of CDKN1A/p21 and a short list of cell cycle related genes. Mostly, it was important to demonstrate that high levels of AURKA were present, making the gene a suitable target for down-regulation following ZOL. The Oncomine Curtis dataset includes 2,136 normal and breast cancer patient samples processed via an Illumina high-throughput microarray platform. The breast cancers were classified based on diagnosis, independent of their molecular subtype analyses. As expected, significant AURKA levels were observed in many of the breast cancers when compared to normal patient samples. Our analyses of the Oncomine dataset are not included as Results because a substantial number of publications document over-expression of AURKA in untreated breast cancers [37-39]. Analyses of the Oncomine Curtis dataset did however confirm high levels and differential expression of AURKA in breast cancer compared to normal patient samples; similar to the pattern observed in the untreated TNBC cell line. Based on their rankings, substantial and statistically significant levels of AURKA were observed in Invasive Ductal Carcinoma with even higher levels in the Medullary cancers. Medullary cancers are rare, aggressive cancers which often present as TNBC [40]. Although CDK1, PLK1, CCNB1 and TTK did not validate via transcript and protein analyses in our study, when CDK1, CCNB1 and TTK were analyzed for expression in the Oncomine Curtis dataset, all three genes demonstrated an almost exact pattern of over-expression as that observed for AURKA gene expression in the ‘normal vs breast cancer sample’ comparisons. Rankings based on the fold change and statistical significance were nearly exactly the same in all of the sample comparisons, not only in Invasive Ductal carcinomas and Medullary cancers. However, based on the comparison to all 19,273 genes on the Illumina microarray platform, only CDK1 demonstrated a relationship based on co-expression analyses, displaying a correlation coefficient of 0.727 with AURKA. CDKN1A/p21 did not show a precise inverse relationship to AURKA expression in the ‘normal vs breast cancer sample’ comparisons, however a substantial number of the cancers did demonstrate down-regulated levels of CDKN1A/p21 transcript.
CDKN1A/p21 is also controlled by p53 and mediates p53-dependent G1 growth arrest [26,41]. MDA MB231 cell lines have mutated p53, so the effect in ZOL treated cells occurs independent of these signalling mechanisms. We suggest that AURKA affects CDKN1A/p21 expression in the conditions described here.
In vitro studies show that ZOL can induce cell death in tumor cells via apoptosis [13,42,43]. Oppositely, Jiang et al. [21] found that ZOL induced cell death in a variety of different breast and glioblastoma cells via autophagy. We observed a similar effect in MDA MB231 cells, in that ZOL induced autophagy-mediated cell death. Previous reports also show that ZOL can affect cells by inhibiting the enzyme farnesyl pyrophosphate synthase (FPPS) in the mevalonate pathway [5]. FPPS is a crucial enzyme in the mevalonate pathway, whose down-stream effector genes regulate cell proliferation. We did not detect dysregulation of FPPS in the breast cell line exposed to ZOL in the current study.
In conclusion, we have identified dysregulation of AURKA and CDKN1A/p21 genes in TNBC following exposure to the ZOL drug. Previous data support upregulation of AURKA in untreated triple negative breast cancer cells, and upregulation of CDKN1A/p21 following exposure to ZOL. Contrary to these studies, the current research show upregulation of CDKN1A/p21 kinase inhibitor coupled with downregulation of the AURKA kinase following exposure to ZOL in TNBC. Our data support the observation that disruption of the cell cycle mediating events are key responses following exposure to the ZOL drug.
The author(s) received partial financial support from the Department of Environmental Health and Sciences of Texas Southern University for the research performed in this article.
The authors would like to thank the mAdb data analyses facility at the National Cancer Institutes of the National Institutes of Health (Bethesda MD, USA), for their continued support of our research efforts. This research was performed as partial requirement for the PhD for NA.
The authors declared no conflicts of interest.
- Fleisch H (2001) Zoledronic acid: an evolving role in the treatment of cancer patients with bone disease. Semin Oncol 28: 45-47. [Crossref]
- Zhao X, Hu X (2015) Dosing of zoledronic acid with its anti-tumor effects in breast cancer. J Bone Oncol 4: 98-101. [Crossref]
- Toro-Tobon D, Agosto S, Ahmadi S, Koops M, Bruder JM (2017) Chronic Myeloid Leukemia Associated Hypercalcemia: A Case Report and Literature Review. Am J Case Rep 18: 203-207. [Crossref]
- Reid IR, Lyles K, Su G, Brown JP, Walsh JP, et al. (2011) A single infusion of zoledronic acid produces sustained remissions in Paget disease: data to 6.5 years. J Bone Miner Res 26: 2261-270. [Crossref]
- Oades GM, Senaratne SG, Clarke IA, Kirby RS, Colston KW (2003) Nitrogen containing bisphosphonates induce apoptosis and inhibit the mevalonate pathway, impairing Ras membrane localization in prostate cancer cells. J Urol 170: 246-52. [Crossref]
- Coleman R, Gnant M (2009) New results from the use of bisphosphonates in cancer patients. Curr Opin Support Palliat Care 3: 213-218. [Crossref]
- Aft R, Naughton M, Trinkaus K, Watson M, Ylagan L, et al. (2010) Effect of zoledronic acid on disseminated tumour cells in women with locally advanced breast cancer: an open label, randomised, phase 2 trial. Lancet Oncol 11: 421-8. [Crossref]
- Coleman R, Cameron D, Dodwell D, Bell R, Wilson C, et al. (2014) Adjuvant zoledronic acid in patients with early breast cancer: final efficacy analysis of the AZURE (BIG 01/04) randomised open-label phase 3 trial. Lancet Oncol 15: 997-1006. [Crossref]
- Gnant M, Mlineritsch B, Schippinger W, Luschin-Ebengreuth G, Postlberger S, et al. (2009) Endocrine therapy plus zoledronic acid in premenopausal breast cancer. N Engl J Med 360: 679-691. [Crossref]
- Rachner TD, Singh SK, Schoppet M, Benad P, Bornhäuser M, et al. (2010) Zoledronic acid induces apoptosis and changes the TRAIL/OPG ratio in breast cancer cells. Cancer Lett 287: 109-116. [Crossref]
- Buhler H, Hoberg C, Fakhrian K, Adamietz IA (2016) Zoledronic Acid Inhibits the Motility of Cancer Stem-like Cells from the Human Breast Cancer Cell Line MDA-MB 231. In Vivo 30: 761-768. [Crossref]
- Morony S, Warmington K, Adamu S, Asuncion F, Geng Z, et al. (2005) The inhibition of RANKL causes greater suppression of bone resorption and hypercalcemia compared with bisphosphonates in two models of humoral hypercalcemia of malignancy. Endocrinology 146: 3235-43. [Crossref]
- Mansouri M, Mirzaei SA, Lage H, Mousavi SS, Elahian F (2014) The cell cycle arrest and the anti-invasive effects of nitrogen-containing bisphosphonates are not mediated by DBF4 in breast cancer cells. Biochimie 99: 71-76. [Crossref]
- Feng C, Liu X, Li X, Guo F, Huang C, et al. (2016) Zoledronic acid increases the antitumor effect of gefitinib treatment for non-small cell lung cancer with EGFR mutations. Oncol Rep 35: 3460-3470. [Crossref]
- Ottewell PD, Woodward JK, Lefley DV, Evans CA, Coleman RE, et al. (2009) Anticancer mechanisms of doxorubicin and zoledronic acid in breast cancer tumor growth in bone. Mol Cancer Ther 8: 2821-32. [Crossref]
- Wang Y, Sun H, Wang Z, Liu M, Qi Z, Meng J, et al. (2014) Aurora-A: a potential DNA repair modulator. Tumour Biol 35: 2831-2836. [Crossref]
- Yang G, Chang B, Yang F, Guo X, Cai KQ, et al. (2010) Aurora kinase A promotes ovarian tumorigenesis through dysregulation of the cell cycle and suppression of BRCA2. Clin Cancer Res 16: 3171-3181. [Crossref]
- Greene JM, Asaki E, Bian X, Bock C, Castillo S, et al. (2003) The NCI/CIT microArray database (mAdb) system - bioinformatics for the management and analysis of Affymetrix and spotted gene expression microarrays. AMIA Annu Symp Proc 2003: 1066. [Crossref]
- Szklarczyk D, Morris JH, Cook H, Kuhn M, Wyder S, et al. (2017) The STRING database in 2017: quality-controlled protein-protein association networks, made broadly accessible. Nucleic Acids Res 45(D1): D362-D368. [Crossref]
- Ibrahim T, Mercatali L, Sacanna E, Tesei A, Carloni S, et al. (2012) Inhibition of breast cancer cell proliferation in repeated and non-repeated treatment with zoledronic acid. Cancer Cell Int 12: 48. [Crossref]
- Jiang P, Zhang P, Mukthavaram R, Nomura N, Pingle SC, et al. (2016) Anti-cancer effects of nitrogen-containing bisphosphonates on human cancer cells. Oncotarget 7: 57932-57942. [Crossref]
- Wang IT, Chou SC, Lin YC (2014) Zoledronic acid induces apoptosis and autophagy in cervical cancer cells. Tumour Biol 35: 11913-11920. [Corssref]
- Carmena M, Ruchaud S, Earnshaw WC (2009) Making the Auroras glow: regulation of Aurora A and B kinase function by interacting proteins. Curr Opin Cell Biol 21: 796-805. [Crossref]
- Karimian A, Ahmadi Y, Yousefi B (2016) Multiple functions of p21 in cell cycle, apoptosis and transcriptional regulation after DNA damage. DNA Repair (Amst) 42: 63-71. [Crossref]
- Fournier A, Mesrine S, Gelot A, Fagherazzi G, Baglietto L, et al. (2017) Use of Bisphosphonates and Risk of Breast Cancer in a French Cohort of Postmenopausal Women. J Clin Oncol 35: 3230-3239. [Crossref]
- Giannakeas V, Cadarette SM, Ban JK, Lipscombe L, Narod SA, et al. (2018) Denosumab and breast cancer risk in postmenopausal women: a population-based cohort study. Br J Cancer 119: 1421-1427. [Crossref]
- Chlebowski RT, Chen Z, Cauley JA, Anderson G, Rodabough RJ, et al. (2010) Oral bisphosphonate use and breast cancer incidence in postmenopausal women. J Clin Oncol 28: 3582-3590. [Crossref]
- Ibrahim T, Liverani C, Mercatali L, Sacanna E, Zanoni M, et al. (2013) Cisplatin in combination with zoledronic acid: a synergistic effect in triple-negative breast cancer cell lines. Int J Oncol 42: 1263-1270. [Crossref]
- Lee MH, Cho Y, Kim DH, Woo HJ, Yang JY, et al., (2016) Menadione induces G2/M arrest in gastric cancer cells by down-regulation of CDC25C and proteasome mediated degradation of CDK1 and cyclin B1. Am J Transl Res 8: 5246-5255. [Crossref]
- Asteriti IA, De Mattia F, Guarguaglini G (2015) Cross-Talk between AURKA and Plk1 in Mitotic Entry and Spindle Assembly. Front Oncol 5: 283. [Crossref]
- Nadler Y, Camp RL, Schwartz C, Rimm DL, Kluger HM, et al. (2008) Expression of Aurora A (but not Aurora B) is predictive of survival in breast cancer. Clin Cancer Res 14: 4455-4462. [Crossref]
- Kim J, Kim A, Kim C (2019) Examination of the Biomark assay as an alternative to Oncotype DX for defining chemotherapy benefit. Oncol Lett 17: 1812-1818. [Crossref]
- Li M, Gao K, Chu L, Zheng J, Yang J (2018) The role of Aurora-A in cancer stem cells. Int J Biochem Cell Biol 98: 89-92. [Crossref]
- Liao Y, Liao Y, Li j, Li J, Fan Y, et al. (2018) Polymorphisms in AURKA and AURKB are associated with the survival of triple-negative breast cancer patients treated with taxane-based adjuvant chemotherapy. Cancer Manag Res 10: 3801-3808. [Crossref]
- Tanner MM, Tirkkonen M, Kallioniemi A, Holli K, Collins C, et al., (1995) Amplification of chromosomal region 20q13 in invasive breast cancer: prognostic implications. Clin Cancer Res 1: 1455-1461. [Crossref]
- Kai K, Kondo K, Wang X, Xie X, Pitner MK, et al. (2015) Antitumor Activity of KW-2450 against Triple-Negative Breast Cancer by Inhibiting Aurora A and B Kinases. Mol Cancer Ther 14: 2687-2699. [Crossref]
- Li MX, Jin LT, Wang TJ, Feng YJ, Pan CP, et al. (2018) Identification of potential core genes in triple negative breast cancer using bioinformatics analysis. Onco Targets Ther 11: 4105-4112. [Crossref]
- Gupta I, Sareyeldin RM, Al-Hashimi I, Al-Thawadi HA, Al Farsi H, et al. (2019) Triple Negative Breast Cancer Profile, from Gene to microRNA, in Relation to Ethnicity. Cancers (Basel) 11: E363. [Crossref]
- Zhang W, Xia D, Li Z, Zhou T, Chen T, et al. (2019) Aurora-A/ERK1/2/mTOR axis promotes tumor progression in triple-negative breast cancer and dual-targeting Aurora-A/mTOR shows synthetic lethality. Cell Death Dis 10: 606. [Crossref]
- Zangouri VM, Akrami M, Tahmasebi S, Talei A, Hesarooeih AG, et al. (2018) Medullary Breast Carcinoma and Invasive Ductal Carcinoma: A Review Study. Iran J Med Sci 43: 365-371. [Crossref]
- Brugarolas J, Chandrasekaran C, Gordon JI, Beach D, Jacks T, et al. (1995) Radiation-induced cell cycle arrest compromised by p21 deficiency. Nature 377: 552-557. [Crossref]
- Lee MV, Fong EM, Singer FR, Guenette RS (2001) Bisphosphonate treatment inhibits the growth of prostate cancer cells. Cancer Res 61: 2602-2608. [Crossref]
- Shipman CM, Rogers MJ, Apperley JF, Russell RG, Croucher PI (1997) Bisphosphonates induce apoptosis in human myeloma cell lines: a novel anti-tumour activity. Br J Haematol 98: 665-672. [Crossref]