Background: GI (glycemic index) is used to show the potency of foods to increase blood glucose. No research has been carried out about gender differences of GI of foods of distinct structures such as glucose and sucrose. We wanted to know if there is a big difference in GI depending upon sex to take foods.
Methods: We gave 50 gm of either glucose or sucrose in a cross over study to two groups of healthy men (n=36, mean age=20.6 ± 1.6) and women (n=35, mean age: 21.2 ± 0.7).
Results: There are no statistical differences in GI of glucose and sucrose in young men. Although glucose administration did not result in different glucose levels between men and women, sucrose administration caused lower glucose levels in women compared with men. Since AUC (area under the curve) of insulin of women who took sucrose was not necessarily high, women may have higher sensitivity to insulin. upon the administration of sucrose. In fact, basic levels of blood glucose of all women were lower than basic blood glucose levels of men. HDL cholesterol levels were higher in women than men but LDL cholesterol levels were higher in men.
Conclusion: GI of sucrose was not significantly lower than GI of glucose in men. In women GI of sucrose was 66% of glucose. These results suggest that GI of substances of distinct structures such as glucose and sucrose was different between men and women. Young men seem to have more LDL, but less HDL-cholesterol compared with women, suggesting that men may be more atherosclerogenic from young age.
sucrose, glucose, BMI, insulin, glycemic index, glycemic load, lipids
Dietary carbohydrate clearly influences plasma glucose levels, but dietary fat and protein can also influence plasma glucose levels [1,2]. The total carbohydrate intake from a meal is a good indicator of postprandial plasma glucose [3-7], but gender and age differences have not been examined yet. Term of glycemic index (GI) has been introduced by Jenkins and coworkers in 1981 [7,8] and is defined as the area under the blood glucose curve measured two hours after consuming 50 g of test carbohydrates in relation to 50 g of glucose [9,10]. In 1997 [8,9], the term glycemic load (GL) was introduced to quantify the overall glycemic effect of food as to its specific carbohydrate content.
GL equals GI multiplied by the carbohydrate density of the food which is usually given as g carbohydrate per 100 g serving. Research on GI indicates that even when foods contain the same amount of carbohydrate, there are up to fivefold differences in glycemic impact [8-10]. In addition, several studies have found that the overall GI and glycemic load (GI × g carbohydrate) of the diet, but not total carbohydrate content, are independently related to the risk of developing type 2 diabetes [8,9], cardiovascular disease [11], and some cancers [12,13].
There were many reports about gender differences of glycemic index, glycemic loads and their relationship to mortality risks [14-20]. We recently reported [8] that there were big age differences in glycemic index when glucose or sucrose were given to young and aged men. When the amounts of blood glucose and insulin after the administration of glucose or sucrose were measured, glucose increased more despite increase in insulin old men in young men, nearly same amounts of insulin caused smaller increase in blood glucose levels. These results seem to indicated that glycemic index (GI) is very much different between old and young men even if the same foods with distinct structures are given, and insulin release to increase in glucose in young men is more sensitive than old men. There seems to be gender and age difference in foods uptakes, plasma levels of carbohydrates, lipids, and amino acids.
In this paper, we report differences in various foods uptakes, glycemic index, plasma levels of carbohydrates, lipids, and amino acids in young Japanese men and women.
Male and female college students were requested to participate in the experiments. We carefully assessed their health and allowed those who do not smoke, with no sign of health problems such as diabetes and hypertension, as well as no history of serious disease, to participate. Participants were provided with a questionnaire relating to self-administered diets they may have followed in the past. From these completed questionnaires, we calculated their past intakes of energy, carbohydrate, fat, and protein. We did not calculate energy uptake related to alcohol drinks, but young men drink alcohol more than young women.
Measurements of blood variables: After fasting overnight, participants were randomly assigned to groups. Depending on their group, each participant received a 550 mL solution containing 50 g of glucose or sucrose (or 500 mL water as a control). Either 50 g of glucose or sucrose was added and dissolved in each bottle containing 500 mL of water.
Participants were requested not to eat anything after 09:00 PM on the previous night and not eat anything for breakfast the following morning. Between 9:00 AM and 10:00 AM, blood was sampled using a syringe, and participants were given either glucose or sucrose solution or water as a control. We measured blood glucose using a finger stick (TERUMO kit) before and 120 min after the administration of glucose or sucrose. Furthermore, other plasma factors were measured after plasma was separated from blood. Ethylene diamine tetra acetic acid (EDTA) was used as an anticoagulant. Insulin was measured by the CLEIA (chemiluminescent immunoassay) method.
Lipid and lipoprotein concentrations (total cholesterol, HDL, TG) were determined using a Polychem Chemistry Analyzer (Polymedco Inc.). FFA concentrations were measured by a gas chromatography.
Ethics: This work was approved by the ethical committees of Showa Women’s University (15-02) and the NPO “International projects on food and health” (15-01) and was conducted in accordance with The Code of Ethics of the World Medical Association (Declaration of Helsinki) for experiments.
Statistics: The results are presented as means ±SEM. Statistical significance of the differences between groups was calculated according by one-way ANOVA. When ANOVA indicated a significant difference (P<0.05), the mean values of the treatment were compared using Tukey's least significant difference test at P<0.05.
Table 1 shows basic parameters of BMI, food uptakes, glucose and insulin levels and plasma levels of various lipids. Generally young men take more energy and various foods. Basic levels of blood glucose levels are lower in women than men. Plasma levels of LDL-cholesterol and TG are higher in men, but plasma levels of HDL-cholesterol are higher in women. Young men take more lipids from foods, but higher levels of LDL-cholesterol and lower levels of HDL-cholesterol may not be due to higher uptakes of lipids alone because there were no differences in TG levels between men and women.
Table 1. Basic parameters of participants
|
Male(n=36) |
Female (n= 35) |
Significant difference |
Age |
20.8 ± 1.6 |
21.2 ± 0.7 |
|
Length (m) |
1.72 ± 0.06 |
1.58 ± 0.05 |
** |
Weight (kg) |
65.5 ± 10.2 |
51.4 ± 5.8 |
** |
BMI |
22.2 ± 3.3 |
20.4 ± 1.6 |
** |
Energy intake (kcal/day) |
1989 ± 592 |
1392 ± 372 |
** |
Protein intake (g/day) |
69.3 ± 25.1 |
52.8 ± 19.1 |
** |
Lipid intake (g/day) |
60.4 ± 24.8 |
45.4 ± 14.5 |
** |
Carbohydrate intake (g/day) |
271.5 ± 91.3 |
179.6 ± 47.7 |
** |
blood glucose (mg/dl) |
78.9 ± 13.1 |
68.5 ± 5.6 |
** |
Insulin (μIU/ml) |
6.87 ± 4.19 |
6.98 ± 2.82 |
|
HDL-Chol. (mg/dl) |
61.0 ± 11.7 |
66.3 ± 7.9 |
* |
LDL-Chol. (mg/dl) |
104.6 ± 24.4 |
88.9 ± 15.8 |
** |
T-Chol. (mg/dl) |
174.4 ± 25.5 |
171.3 ± 20.9 |
|
TG (mg/dl) |
75.1 ± 31.9 |
58.7 ± 19.7 |
* |
Dihomo-gamma-linolenic acid (μg/ml) |
34.4 ± 8.3 |
27.9 ± 6.9 |
** |
Arachidonic acid (μg/ml) |
170.3 ± 38.4 |
159.9 ± 26.3 |
|
EPA (μg/ml) |
27.5 ± 18.1 |
30.8 ± 14.9 |
|
DHA (μg/ml) |
78.3 ± 20.6 |
85.4 ± 17.7 |
|
EPA/AA |
0.16 ± 0.11 |
0.20 ± 0.10 |
|
Table 2 shows changes in lipids levels after the administration of glucose or sucrose to young men and women. Lipids levels did not change after the administration of glucose or sucrose.
Table 2. Lipids levels after the administration of glucose or sucrose to young men and women
Lipids |
Male |
Female |
0min. |
120min. |
0min. |
120min. |
Control |
Glucose |
Sucrose |
Control |
Glucose |
Sucrose |
HDL-Chol. (mg/dl) |
61.0 ± 11.7 |
65.9 ± 11.6 |
63.9 ± 9.1 |
58.5 ± 12.0 |
66.3 ± 7.9 |
70.1 ± 10.1 |
62.3 ± 7.5 |
65.4 ± 5.2 |
LDL-Chol. (mg/dl) |
104.6 ± 24.4 |
98.6 ± 27.2 |
104.3 ± 25.2 |
99.7 ± 17.0 |
88.9 ± 15.8 |
88.5 ± 17.0 |
78.3 ± 12.0 |
95.5 ± 13.4 |
T-Chol. (mg/dl) |
174.4 ± 25.5 |
175.9 ± 29.0 |
176.5 ± 27.1 |
165.6 ± 19.8 |
171.3 ± 20.9 |
175.4 ± 24.0 |
157.3 ± 15.8 |
176.1 ± 17.8 |
TG (mg/dl) |
75.1 ± 31.9 |
83.9 ± 39.0 |
60.4 ± 26.6 |
63.5 ± 22.9 |
58.7 ± 19.7 |
53.1 ± 20.0 |
48.2 ± 12.7 |
56.3 ± 25.5 |
Dihomo-gamma-linolenic acid (μg/ml) |
34.4 ± 8.3 |
36.2 ± 9.5 |
34.3 ± 8.6 |
32.1 ± 6.8 |
27.9 ± 6.9 |
27.9 ± 6.7 |
25.2 ± 7.6 |
30.7 ± 6.4 |
Arachidonic acid (μg/ml) |
170.3 ± 38.4 |
177.7 ± 33.4 |
175.0 ± 42.9 |
158.8 ± 38.0 |
159.9 ± 26.3 |
162.2 ± 20.3 |
148.9 ± 25.1 |
165.1 ± 30.1 |
EPA (μg/ml) |
27.5 ± 18.1 |
27.0 ± 14.5 |
24.9 ± 15.2 |
27.5 ± 22.7 |
30.8 ± 14.9 |
30.5 ± 13.5 |
28.5 ± 14.7 |
31.2 ± 17.1 |
DHA (μg/ml) |
78.3 ± 20.6 |
82.6 ± 21.6 |
77.2 ± 22.0 |
73.0 ± 20.5 |
85.4 ± 17.7 |
89.3 ± 14.5 |
82.7 ± 18.9 |
86.2 ± 19.4 |
EPA/AA |
0.16 ± 0.11 |
0.16 ± 0.09 |
0.15 ± 0.09 |
0.17 ± 0.12 |
0.20 ± 0.10 |
0.19 ± 0.08 |
0.20 ± 0.10 |
0.19 ± 0.11 |
Figure 1 shows changes of blood glucose levels in young men when 50 gms of glucose or sucrose were given. There was no statistical difference in blood glucose levels (thus GI) between the administrations of glucose and sucrose.
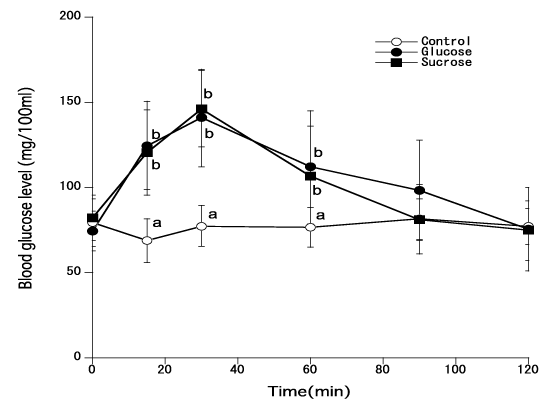
Figure 1. Blood glucose levels of young men when 50 gms of glucose or sucrose were administered [Different marks show statistical significance of p<0.05]
Figure 2 shows changes of blood glucose levels in young men when 50 gms of glucose or sucrose were given. There was statistical difference in blood glucose levels (thus GI) between the administrations of glucose and sucrose in women. Sucrose administration resulted in lower levels of blood glucose (67%) compared to glucose administration。
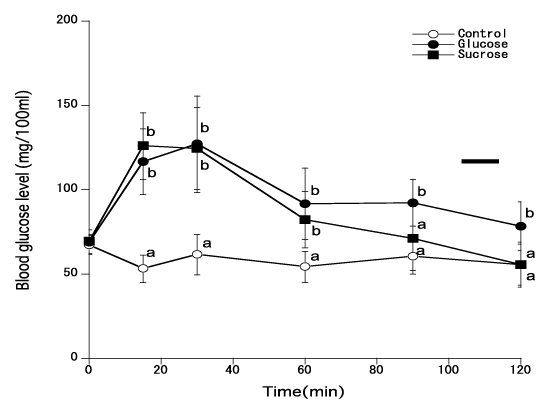
Figure 2. Blood glucose levels of young women when 50 gms of glucose or sucrose were administered [Different marks show statistical significance of p<0.05]
Figure 3 shows that changes in blood glucose levels in young men or women after the administration of glucose. Although there was no statistical significance, blood glucose levels of young women tended to be lower than glucose levels of men.
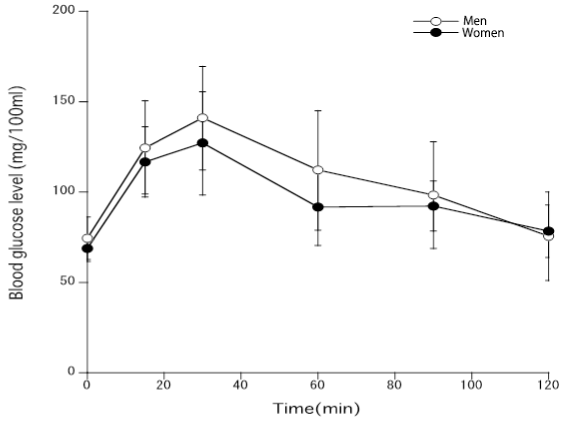
Figure 3. Blood glucose levels after the administration of glucose to young men and women
Figure 4 shows that changes in blood glucose levels in young men or women after the administration of sucrose. Blood glucose levels were statistically significantly lower in young women compared with men.
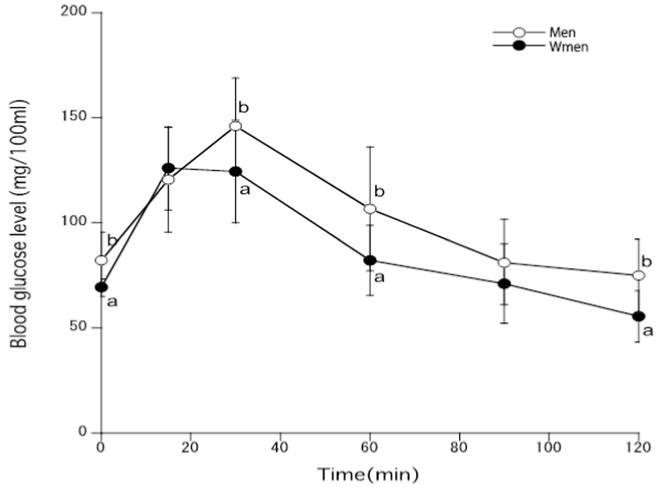
Figure 4. Blood glucose levels after the administration of sucrose to young men and women [Different marks p<0.05, glucose vs. sucrose].
Figure 5 shows AUC of insulin levels of men and women who took glucose or sucrose. There are no statistical differences glucose and sucrose levels after the administration of glucose and sucrose in men and women.
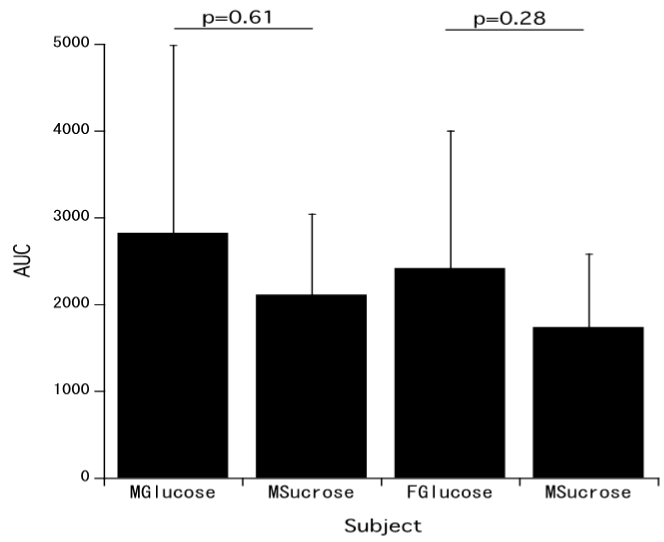
Figure 5. AUC of insulin levels of men or women who took glucose or sucrose [MGlucose: Men who took glucose; MSucrose: Men who took sucrose; FGlucose: Women who took glucose; FSucrose: Women who took sucrose; Men: Glucose n=6, Sucrose n=7; Women: Glucose and Sucrose n=12].
There are many trials as to what kind of diets are healthier in terms of decrease in body weight and mortality.
We recently reported [8] that there were big age differences in glycemic index when glucose or sucrose were given to young and aged men.
To study effects of various dietary prescriptions on body weight or mortality, we must know gender differences in foods uptakes and plasma factors such as glucose, insulin levels, or lipids levels in healthy people.
Oba et al. [19] reported the relationship among dietary glycemic index, glycemic load and carbohydrate uptakes and the risk of mortality from strokes and indicated that the hazard ratios increased in high dietary GI in women. On the other hand, Fan et al. [20] reported that gender significantly modified the effects of glycemic index and glycemic load on cardiovascular risk, and high glycemic load level was associated with higher risk of cardiovascular disease in women, but not in men. It has been recognized that diet plays a major role in increasing the risks of cardiovascular diseases. Dietary GI and dietary GL are used to evaluate the glycemic properties of the diet. The dietary GL was shown by Nurses Health Study to be associated with the risk of cardiovascular disease [21] and later with hemorrhagic stroke [22] and these associations were shown to be the most evident in overweight women in both studies. Later, similar findings for CVD risk have been reported in several, but not all studies [23-25].
These controversial results may have been obtained because basic studies of age or gender differences were not well performed. For example, GI of sucrose is theoretically 50% of glucose for all the populations. But our results [8] indicated that GI in response to sucrose was 82% compared with that of glucose in young men and 73.6% in older men.
In the present research, we showed that GI of sucrose in young men was not significantly different from GI of glucose in men, but GI of sucrose in young women was 67.8% of GI of glucose. We used substances of distinct structures such as glucose or sucrose which has 50% of glucose in the structure. Even substances of such distinct structure were used GI was different depending upon age and gender of persons who took such substances.
We should study more precisely roles of sex and ages in the determinations of GI. In Japan, there are larger numbers of type 2 diabetes mellitus (T2DM) patients in men than women. National Survey of Health and Nutrition 2015 in Japan indicated that the number of T2DM patients are 15.5% in men and 9.8% in women [25]. Probably higher sensitivity to insulin upon sucrose and sweet beverage as shown in the present research may be one of the reasons.
2021 Copyright OAT. All rights reserv
Experiments were designed and performed by all the authors. AT wrote a manuscript. Statistical analyses were done by TT. All authors read the manuscript and approved the final version. All the authors had responsibilities for the final content.
None.
This study was supported by grants by Ito Memorial Foundation and NPO “International Projects on Food and Health”.
- Schenk S, Davidson CJ, Zderic TW, Byerley LO, Coyle EF (2003) Different glycemic indexes of breakfast cereals are not due to glucose entry into blood but to glucose removal by tissue. Am J Clin Nutr 78: 742-748. [Crossref]
- DeFronzo RA, Ferrannini E (1982) Influence of plasma glucose and insulin concentration on plasma glucose clearance in man. Diabetes 31: 683-688. [Crossref]
- Franz MJ, Bantle JP, Beebe CA, Brunzell JD, Chiasson JL, et al. (2002) M: Evidence-based nutrition principles and recommendations for the treatment and prevention of diabetes and related complications. Diabetes Care 25: 148-198.
- Institute of Medicine (2002) Dietary Reference Intakes: Energy, Carbohydrate, Fiber, Fat, Fatty Acids, Cholesterol, Protein, and Amino Acids. Washington, DC, National Academies Press.
- Gannon MC, Nuttall FQ, Westphal SA, Fang S, Ercan-Fang N (1998) Acute metabolic response to high-carbohydrate, high-starch meals compared with moderate-carbohydrate, low-starch meals in subjects with type 2 diabetes. Diabetes Care 21: 1619-1626.
- Wolever TM, Bolognesi C (1996) Source and amount of carbohydrate affect postprandial glucose and insulin in normal subjects. J Nutr 126: 2798-2806. [Crossref]
- Jenkins DJ, Wolever TM, Taylor RH, Barker H, Fielden H, et al. (1981) Glycemic index of foods: a physiological basis for carbohydrate exchange. Am J Clin Nutr 34: 362-366. [Crossref]
- Salmerón J, Manson JE, Stampfer MJ, Colditz GA, Wing AL, et al. (1997) Dietary fiber, glycemic load, and risk of non-insulin-dependent diabetes mellitus in women. JAMA 277: 472-477. [Crossref]
- Foster-Powell K, Holt SH, Brand-Miller JC (2002) International table of glycemic index and glycemic load values: 2002. Am J Clin Nutr 76: 5-56. [Crossref]
- Liu S, Willett WC, Stampfer MJ, Hu FB, Franz M, et al. (2000) A prospective study of dietary glycemic load, carbohydrate intake, and risk of coronary heart disease in US women. Am J Clin Nutr 71: 1455-1461. [Crossref]
- Augustin LS, Dal Maso L, La Vecchia C, Parpinel M, Negri E, et al. (2001) Dietary glycemic index and glycemic load, and breast cancer risk: a casecontrol study. Ann Oncol 12: 1533-1538.
- Franceschi S, Dal Maso L, Augustin L, Negri E, Parpinel M, et al. (2001) Dietary glycemic load and colorectal cancer risk. Ann Oncol 12: 173-178.
- Rasmussen OW, Gregersen S, Dørup J, Hermansen K (2005) Blood glucose and insulin responses to different meals in non-insulin-dependent diabetic subjects of both sexes. Cancer Epidemiol Biomarkers Prev 14: 138-147.
- Michaud DS, Fuchs CS, Liu S, Willett WC, Colditz GA, et al. (2005) Dietary glycemic load, carbohydrate, sugar, and colorectal cancer risk in men and women. Cancer Epidemiol Biomarkers Prev 14: 138-147. [Crossref]
- Oxlund AL, Heitmann BL (2006) Glycaemic index and glycaemic load in relation to blood lipids - 6 years of follow-up in adult Danish men and women. Public Health Nutr 9: 737-745. [Crossref]
- Hayashi T, Kawashima S, Nomura H, Itoh H, Watanabe H, et al. (2010) Age, gender, insulin and blood glucose control status alter the risk of ischemic heart disease and stroke among elderly diabetic patients. Gend Med 7: 593-599.
- Göbl CS, Brannath W, Bozkurt L, Handisurya A, Anderwald C, et al. (2010) Sex-specific differences in glycemic control and cardiovascular risk factors in older patients with insulin-treated type 2 diabetes mellitus. Metabolism 59: 1574-1582.
- Oba S, Nagata C, Nakamura K, Fujii K, Kawachi T, et al. (2010) Dietary glycemic index, glycemic load, and intake of carbohydrate and rice in relation to risk of mortality from stroke and its subtypes in Japanese men and women. Metabolism 59: 1574-1582. [Crossref]
- Fan J, Song Y, Wang Y, Hui R, Zhang W (2012) Dietary glycemic index, glycemic load, and risk of coronary heart disease, stroke, and stroke mortality: a systematic review with meta-analysis. PLoS One 7: e52182.
- Takao T, Ogawa M, Ishii Y, Shimizu F, Takada A (2016) Different glycemic resposes to sucrose and glucose in old and young male adults. J Nutr Food Sci 6: 460.
- Oh K, Hu FB, Cho E, Rexrode KM, Stampfer MJ, et al. (2005) Carbohydrate intake, glycemic index, glycemic load, and dietary fiber in relation to risk of stroke in women. Am J Epidemiol 161: 161-169. [Crossref]
- Sieri S, Krogh V, Berrino F, Evangelista A, Agnoli C, et al. (2010) Dietary glycemic load and index and risk of coronary heart disease in a large italian cohort: the EPICOR study. Arch Intern Med 170: 640-647. [Crossref]
- van Dam RM, Visscher AW, Feskens EJ, Verhoef P, Kromhout D (2000) Dietary glycemic index in relation to metabolic risk factors and incidence of coronary heart disease: the Zutphen Elderly Study. Eur J Clin Nutr 54: 726-731. [Crossref]
- Levitan EB, Mittleman MA, Håkansson N, Wolk A (2007) Dietary glycemic index, dietary glycemic load, and cardiovascular disease in middle-aged and older Swedish men. Am J Clin Nutr 85: 1521-1526. [Crossref]
- Hamasaki T, Kitamura M, Kawashita Y, Ando Y, Saito T (2016) Periodontal disease and percentage of calories from fat using national data. J Periodontal Res Epub ahead of print. [Crossref]


