Background & Aims: Hepatocellular carcinoma (HCC) is a global challenge due to rising incidence and high mortality rate among the affected individuals. Establishing successful animal models of HCC is, therefore, crucial for basic and translational studies of HCC. Present study was undertaken to develop orthotopic syngeneic rat HCC model to study new diagnostic and therapeutic strategies for human HCC research.
Methods: Rat Novikoff hepatoma cells were injected beneath the capsule of left lobe of liver in fifty-five sprague dawley rats. Study was divided in three phases, 15 Animals in phase-I were injected with 4x10⁶ cells in 100µl DMEM, 15 animals in phase-II with 2x10⁶ cells in 50µl and 30 animals in phase-III with 3 x10⁶ cells in a 100µl DMEM. Tumor induction rate, tumor size and progression and mortality rate was evaluated and assessed using serial µPET-CT imaging till four weeks. F-18 Flurodeoxyglucose was used as metabolic imaging radiotracer and imaging findings were correlated grossly and histologically.
Results: Phase-I animals showed 100% tumor induction rate but multiple intrahepatic and intra peritoneal masses with 100% mortality observed. Phase-II animals did not show any tumor. Phase-III animals showed 100% induction rate with controlled and diffused progression of hepatic tumor. CT images and sequential higher flurodeoxyglucose uptake in liver confirmed the progression of tumor. Gross examination and histology confirmed the presence of HCC. Conclusions: N1S1 cell induced orthotopic syngeneic HCC rat model with progressive controlled tumor growth and least mortality rate can be used to study new diagnostic techniques and plan new therapeutic strategies against HCC.
Hepatocellular carcinoma, orthotopic, Positron Emission Tomography (PET), Computed Tomography (CT), N1S1
Hepatocellular carcinoma (HCC) is the fifth most serious type of cancer and second most common cause of death from cancer worldwide and incidence is predicted to increase in coming years [1,2]. Prognosis for liver cancer is very poor with overall ratio of mortality to incidence of 0.95 and as such geographical patterns in incidence and mortality are similar [3-5]. The highest incidence of HCC is found in Asia and sub-Saharan Africa. The etiological factors include hepatitis B and C virus infections (80%), alcoholism, obesity (non-alcoholic fatty liver disease) and aflatoxicosis.[6,7] In Indian population chronic Hepatitis B virus infection, with tumors developing more often in a cirrhotic (76%) than in a non-cirrhotic liver has been reported [8]. It usually gets initiated following a chronic liver injury where surgical resection or transplantation is the primary line of treatment although systemic and local deliveries of chemotherapeutics have been reported for later stage of the disease [9,10]. Even though the study of HCC invasiveness has advanced at the molecular level with overall sophisticated breakthroughs in knowledge of HCC, it has not translated to improved HCC patient care.
Establishing successful animal models of HCC is, therefore, crucial for both basic and translational studies of HCC. Chemically induced murine hepatocellular carcinoma models have been developed since long time but it does not give localized tumor induction on liver with relative high toxicity to animals. Subcutaneous xenograft has been widely used since two decades as a technique of xenograft tumor induction. It has advantages that it is rapid, and inexpensive technique, easy to reproduce, tumor is visible to the necked eyes and does not lead to mortality of the animals. Subcutaneous xenograft lack the microenvironment for proper tumor growth and also failed to delineate the efficacy of therapeutic agents in preclinical trials due to lack of drug responses [11,12]. The main drawback of subcutaneous HCC model is its inability to explore novel therapeutic radioisotope strategies, when agent needs to be administered via hepatic artery. Orthotopic tumor model are making presence in cancer research as they mimic the micro-environment of the original tumor and also accurately reflects the effectiveness of treatment delivery mode, hence is more predictive of responses than the subcutaneous xenograft models [13]. Researchers have started developing orthotopic human HCC models since a decade, but these models are difficult to develop and requires skilled person, also the mortality rate is higher in such animals.The lack of well-developed tools for the assessment of treatment response beyond the evaluation of tumor burden have hampered progress in testing and validating new tumor therapies [14,15]. This lacking can be solved by developing the syngeneic orthotopic animal models which doesn’t show immune rejection when tumor cells are implanted in target organ. This model is cost effective, reproducible, growth of tumor in immunocompetent hosts, long history of use and therefore has strong baseline of drug response data and feasibility to conduct experiments with statistically meaningful number of animals per group [16]. This model even does not require more sterile environment as compared to the immunocompetent animals, due to which frequent non-invasive imaging is feasible. There are reported models in earlier studies such as Morris hepatoma model using McA-RH7777 cells in Buffalo rat and N1S1 cells for Novikoff hepatoma model in Sprague-Dawley (SD) rats [17,18]. The suitability of N1S1, which is chemically induced cell line using SD rats has been explored commonly due to ready availability of cell line as well as animal strain [19].
Efforts are being directed to develop more effective radiotheragnostic and chemotherapeutic agents, which has boosted search for appropriate and relevant animal model system as well as sensitive non-invasive imaging modalities such as computed tomography (CT), positron emission tomography (PET), single photon emission computed tomography (SPECT), and bioluminescence imaging (BLI) [20-25]. BLI which is a sensitive bio-imaging method have been used by the researchers for monitoring progression of the liver tumors but have limitations in providing functional details of tumor and also estimating actual tumor burden so has limited utility in preclinical trials [26].
While majority of studies involve orthotopic xenograft immunocompetent animals, we have focused our aim to develop syngeneic hepatocellular carcinoma model in rats which can be used to study new diagnostic and therapeutic strategies for further human hepatocellular cancer research. We have thus developed following protocol to efficiently establish murine HCC models in Sprague-Dawley (SD) rats using N1S1 murine HCC cells and validated using µPET-CT as an advanced functional imaging technique.
Cell lines
Rat Novikoff hepatoma (N1-S1) cells procured from American Type Culture Collection (ATCC-CRL1604™) were grown in Dulbecco’s Modified Eagle’s Medium (DMEM) with 10% heat inactivated Fetal Bovine Serum (FBS) and 1% penicillin, 100 μg/mL streptomycin at 37°Cin a humidified atmosphere containing 95% air and 5% CO2. Up to twenty passages were performed till attaining 70-80% confluency in T-75 culture flask, cells were pelleted down and resuspended in little amount of media. Cells were counted using heamocyotometer chamber and Cell viability was assessed. Final concentration of cells was adjusted as per the protocol and the cells were taken into a 1.5ml capacity eppendorf vials and temporarily stored in ice till it was transplanted.
Animal studies
Animals: Experimental protocol was approved by our institutional animal ethics committee (IAEC) before the start of study, and we ensured that all animals received humane care and that study protocols complied with the institution’s guidelines (IAEC/22/2012). Male Sprague-Dawley (SD) rats weighing 150 ± 50 g supplied by Laboratory Animal Facility, ACTREC (Navi Mumbai, India) were used in this study. All the animals were housed in central animal care facility with 12-hours light and 12-hours dark cycle. They were fed with pellet feed, ad libitum water and maintained in pathogen free environment.
Experimental design: In this pilot study total 55 SD rats were used and divided in three phases to standardize the concentration of cells required for uniform tumor induction. All the rats were injected with N1S1 cell lines below the capsule of left liver lobe. The rats in phase I (n=15) were injected with 4 x10⁶ N1S1 cells suspended in a 100 µl DMEM. In phase II (n=10) rats were injected with 2 x10⁶N1S1 cells suspended in 50 µl DMEM and rats in phase III (n=30) were injected with 3 x10⁶N1S1 cells suspended in a 100 µl DMEM. In phase III fifteen animals were injected from posterior aspect whereas other fifteen animals were injected from anterior side of animal without exteriorizing the liver. Diagrammatic sketch representation of the procedure is shown in (Figure 1).
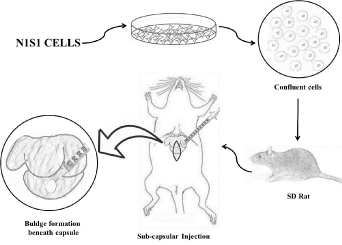
Figure 1. Diagrammatic sketch representation of the steps followed during orthotopic murine HCC tumor induction on liver.
Orthotopic transplantation: The rats were anesthetized with 4% isoflurane and 1l/min of O2 prior to surgery and maintained with 3% Isoflurane anesthesia during entire surgical procedure. Abdominal region of all the animals were shaved and prepared aseptically with 70% alcohol. Animals were kept on experimental platform in supine position. Mini laparotomy was performed by making a longitudinal sub-xiphoid incision of approximately 1-1.5 cm to expose the liver lobes (Figure 2a). After proper mixing of the cells from eppendorf tube containing the cell suspension, cells were drawn into an insulin syringe with 30-gauge needle. Under direct visualization cells were injected beneath the capsule of the left lateral liver lobe (Figure 2b). White bulge at the site indicates successful injection (Figure 2c). Injection site was pressed with sterile cotton swab to avoid cell leakage or bleeding from liver. Muscle suturing was done with sterile absorbable chromic catgut no. 3-0 and skin was sealed with tissue adhesive (VetbondTM). Following surgery animals were kept on heating pad for recovery. Postoperatively all animals received oral antibiotics and wound dressing was carried out for next five days.
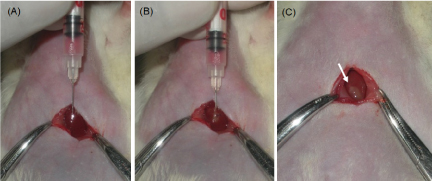
Figure 2. Images during surgical laparotomy (A) Insertion of 30G needle beneath liver capsule (B) Injection of cell suspension (C) White bulge confirming successful injection of cells.
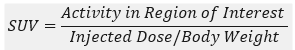
Imaging studies: MicroCT scan and microPET scan was performed using PET/SPECT/CT preclinical system FLEXTM TRIUMPHTM (TriFoil Imaging Inc, CA, USA). Scans were taken one week after intra-hepatic injection and then every week till four weeks. Rats were fasted for 3h and anesthetized with 4% Isoflurane (Forane® Abbot India LTD., India) in 1litre/min of oxygen in air for imaging procedure. µCT scan was performed with animal in prone position using parameters 50kV voltage, 500 μA current,1.3 magnification and exposure time of 400 ms. Images were reconstructed in VIVID software and analyzed in MicroView software for tumor characteristics and volume. For PET imaging 300 to 450 µCi of [18F]-Flurodeoxyglucose (FDG) was injected via tail vein and scan was performed 60 min post injection. PET Images were reconstructed using 2d-mlem algorithm with no attenuation correction and analyzed in PMOD software (PMOD Technologies LLC, Zurich, Switzerland) for standardized uptake value (SUV) as SUVmax and SUVmean.
PET and CT images were superimposed using fusion tool in software and Region of Interest (ROI) was drawn around the tumor to get the average count rate (counts/sec per pixel) within the ROI and SUV was calculated as,
Study end point
Initially in phase I and II, animals were sacrificed every week using standard euthanasia procedure and abdominal cavity was explored for tumor on liver as well as ectopic and distant metastasis. In phase III animals were sacrificed at 4th week of transplantation and gross morphology was compared with PET-CT images. Gross tumor size measured with vernier calipers and weight of the tumor was recorded. Blood was collected for hemato-biochemical examinations including Serum Glutamic Oxaloacetic Transaminase (SGOT) and Serum Glutamic Pyruvic Transaminase (SGPT). Tumors were collected in 10% formalin and sent for histology studies.
Histopathology study
Formalin fixed tumor was embedded in paraffin block, and small sections were cut and stained with hematoxylin and eosin (H&E) as previously described.
Statistical analysis
All the data were expressed as the mean ± standard error of the mean (SEM). Statistical significance was accepted at the level of P < 0.05.
Initially injection of cells was difficult as the capsule of liver being very thin. Spillage of the cells occurred due to respiratory movement of the animals but, gradually the spillage reduced after acquiring the skills of injecting the cell beneath the capsule. None of the animals showed bleeding during or after the injection and also there was no infection or mortality observed 2-3 days after the implantation procedure. The gaseous anaethesia could induce sufficient amount and depth of anesthesia required for the procedure of 2-3 minutes without any complications.
Serial PET-CT imaging was performed at different time point till 4th week. Phase I animals showed 100% (15/15) tumor occurrence rate at 1st week with high uptake of FDG at tumor site (Figure 3A) but, the tumor size increased invariably till 3rd week and mortality rate was found to be 60% (9/15) with FDG uptake noticed all over abdomen in 70% of animals (Figure 3B). 3 animals also showed uptake in lungs which indicated local and distant metastasis of tumor. In phase II showed 0% (0/10) tumor occurrence rate till 4th week after transplantation with no mortality. Initially some FDG uptake was noticed at tumor site as well as on skin near suture area (Figure 4A) but from 2nd week onwards very negligible/none uptake was seen (Figure 4B). This initial uptake in liver as well as surgical site may be due to inflammatory changes at injection site and surgery. The abnormal uptake of tracer can be very well differentiated in three dimensional imaging. All the animals in phase III showed uptake in liver at 1st week that means 100 % success rate (Figure 5A). Twenty-six animals (26/30) in phase III showed sequentially increased FDG uptake in tumor every week till 4th week (Figure 5B). At 1st week PET images showed uptake at injection site as well as at surgical suture site, but from 2nd week onwards only uptake in tumor was noted. Diffused tumor was seen on day 14 in all animals with mean tissue specific uptake of 220 KBq/ml. Maximum mean tissue uptake of 152 KBq/ml was found on day 28. Three animals showed reduction of tumor size after 2nd week scan. Whereas one animal at day 21 showed uptake all over in abdominal cavity which may be due spillage of cells or infiltration of tumor in peritoneal cavity during injection. Only 20% mortality was found after 4th week of transplantation.
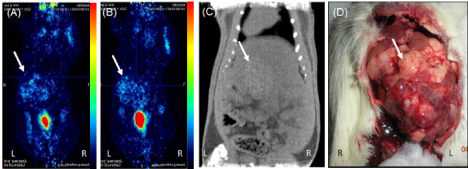
Figure 3. PET-CT images from phase I in prone position showing (A) tumor uptake at 1st week (B) high uptake at 4th week with metastatic foci in peritoneum (C) CT image at 4th week confirming the grown tumor (D) gross image at 4th week showing overgrown tumor covering whole lobe of liver (tumor area shown with white arrow)
Imaging results were confirmed by gross examination during sacrifice of animals. Phase I animals sacrificed at 1st week showed large lobulated irregular tumor covering whole left lobe of liver (Figure 3C,3D). Whereas animals sacrificed after 2nd week showed infiltration of tumor near suture line, in abdominal cavity and distant metastatic lesion in lungs. Phase II animals sacrificed at 1st week did not show any local tumor on liver or ectopic tumor in peritoneum. Animals observed till 4th week but only scar tissue was noticed (Figure 4C,4D). In phase III study, animals showed localized solid tumor on left lobe of liver at 1st week with progressive increase in size of tumor till 4th week after transplantation (Figure 5C,5D). Grossly all the tumors at 4th week were uniform and localized to left liver lobe (Figure 6).
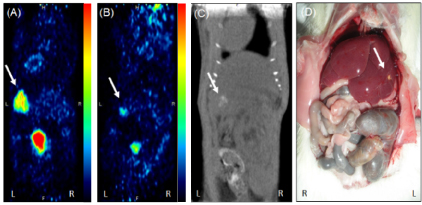
Figure 4. PET-CT images of animal from phase II study in prone position showing (A) slight tumor uptake at 1st week (B) reduction in uptake of FDG at 4th week (C) CT image showing negligible tumor at liver lobe (D) gross image at 4th week showing scar like lesion on liver lobe.
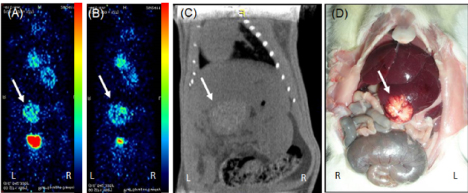
Figure 5. PET-CT images of animal from phase III study in prone position showing (A) good tumor uptake at 1st week (B) increased uptake of FDG at 4th week (C) CT image showing diffused tumor on liver lobe (D) gross image at 4th week confirming the tumor.
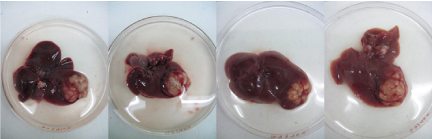
Figure 6. Representative gross images of liver showing uniform induction of localized orthotopic HCC tumor at 4th week.
Further gross pathology of tumor was confirmed by histological examination of liver tissue. H & E staining of tumors showed distorted growth of hepatocytes as compared to normal liver parenchyma. (Figure 7A) A typical trabecular growth pattern with atypical cytoplasm and high mitotic index with pleomorphic and prominent nucleoli, which confirmed that the tumors are similar in histology to those of the original rat hepatocellular carcinoma cells (Figure 7B,7C).
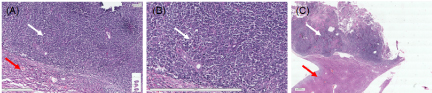
Figure 7. Microphotograph represents (A) hepatocellular carcinoma cells with adjacent normal hepatic cell. (B) cells arranged in sheet with high NC ratio with pleomorphic and prominent nucleoli. (Captured at 9.97x and zoomed @ 63.44%; scale bar 20 µm) (C) tumor with normal adjacent liver (captured at 9.97x and zoomed @ 4.84%; scale bar 2 µm)
Biochemical parameters were determined to evaluate relation between tumor growth and levels of serum AST/ALT and compared in tumor bearing and non-tumor bearing animals. Levels were significantly increased in tumor bearing animals as compared with non-tumor bearing animals which supports the development of tumor on liver (Figure 8).
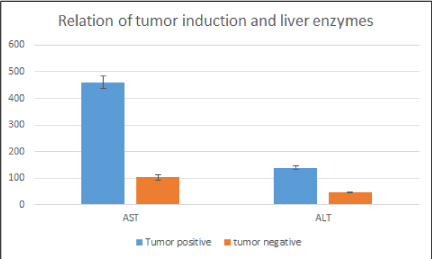
Figure 8. Bar graph depicting liver enzyme levels in tumor bearing and non-tumor bearing animals. Liver enzymes were significantly increased in tumor bearing animals. Mean± standard error of the mean (SEM); p˂0.05, versus tumor bearing group.
Considering the increased incidence and mortality rate caused due to hepatocellular carcinoma in human there is need to study the disease progression of HCC. A subcutaneous HCC tumor model doesn’t mimic the properties of original HCC cancer which necessitates the development of orthotopic HCC animal model showing similar disease progression.
In our study, rat hepatoma cell line (N1S1) successfully induced required volume of tumor on liver, which is sufficient to study long term response of the anticancer agents. At 1st week solid tumors were seen on subcapsular liver injection, Chan et.al, 2010 also obtained similar results during their orthotropic model development after injection of 5X10⁶ N1S1 cell line but, they did not study the progression for long period of time. Guo et al. 2011 reported similar progressive solid tumor formation after injection of N1S1 cell line. Quantity of cell suspension and spillage during injection makes more difficult to establish orthotopic HCC model. In phase I study increased tumor size, higher FDG uptake and mortality rate led us to infer that N1S1 being an aggressively growing cell line capable of developing intrahepatic masses and metastatic lesion in other organs at higher concentration. The quantity of cell suspension was reduced from 100µl to 50µl in phase II but, there was clogging of cells in needle and difficulty during injection, so 100µl was used further as standard cell suspension amount. There was no surgery related infection or mortality due to bleeding in whole study, indicates suitability of syngeneic SD rats for orthotopic model development.
Knowing the progression of tumor growth without sacrificing the animals is challenging but, nowadays preclinical imaging techniques help in monitoring of the disease. Bioluminescence imaging have been used by different researcher during development of HCC model which, detects the signal emitted from the cells but, tumor volume and characteristics are not determined [27]. µCT and PET imaging are successfully used for preclinical diagnosis of orthotopic HCC [28,29]. F-18-FDG-PET along with µCT imaging provided functional and anatomical monitoring of the tumor progression in animals without sacrificing them. Similarly, Lee et. al, 2014 reviewed different articles where PET imaging was used during orthotopic model development and found to be very excellent tool to study HCC tumor progressionnon-invasively [30]. Initial higher uptake at tumor site and surgical site may be due to inflammation which becomes less as inflammation get reduced. FDG being a glucose analogue shows uptake at inflammatory region as well as tumor, so can lead to false results in early stage. We observed that clear CT images determine the accurate size and shape of the tumors in vivo. Prabhu et.al. in their orthotopic glioblastoma establishment study found that µCT scan is the appropriate tool to know the progression of orthotopic tumor in mice. PET images helped us to know the progression of tumor, tumor activity and also small metastatic lesion in other parts of body. Uniform induction of solid tumor with sequential increase in FDG uptake in phase I animals concludes that 3x10⁶ cell suspension of N1S1 in 100µl is sufficient to develop the desired size of localized tumor on liver for further studies.
We have successfully developed and established orthotopic HCC rat model using 3 x10⁶ N1S1 cells suspended in a 100 µl DMEM. The controlled tumor growth up to 4-6-week time period with least mortality rate will help in evaluating the new treatment strategies against hepatocellular carcinoma. Rat is a good model for HCC and PET-CT imaging found to be suitable for monitoring in vivo tumor progression. This model can be used commonly by researchers and surgeons for further radiopharmaceutical or trans-arterial chemoembolization (TACE) studies as it does not require immunocompromised animals and also the related sterile environment.
- Wrzesinski SH, Taddei TH, Strazzabosco M (2011) Systemic therapy in hepatocellular carcinoma. Clinics in liver disease 15: 423-441.
- Brown KS (2006) Chemotherapy and other systemic therapies for hepatocellular carcinoma and liver metastases. Semin Intervent Radiol 23: 99-108. [Crossref]
- Siegel RL, Miller KD, Jemal A (2016) Cancer statistics, 2016. CA Cancer J Clin 66: 7-30. [Crossref]
- Jemal A, Bray F, Center MM, Ferlay J, Ward E, et al. (2011) Global cancer statistics. CA Cancer J Clin 61: 69-90. [Crossref]
- Njei B, Rotman Y, Ditah I, Lim JK (2015) Emerging trends in hepatocellular carcinoma incidence and mortality. Hepatology 61: 191-199. [Crossref]
- Ferlay J, Soerjomataram I, Ervik M, Dikshit S, Eser C, et al. (2012) V1. 0, cancer incidence and mortality worldwide: IARC CancerBase No. 11. 2013. Lyon, France: International Agency for Research on Cancer.
- Chisari FV, Klopchin K, Moriyama T, Pasquinelli C, Dunsford HA, et al. (1989) Molecular pathogenesis of hepatocellular carcinoma in hepatitis B virus transgenic mice. Cell 59: 1145-1156. [Crossref]
- Idilman R, De Maria N, Colantoni A, Van Thiel D (1998) Pathogenesis of hepatitis B and C‐induced hepatocellular carcinoma. J Viral Hepat 5: 285-299. [Crossref]
- Ferenci P, Fried M, Labrecque D, Bruix J, Sherman M, et al. (2009) Hepatocellular carcinoma (HCC). a global perspective 2010: 44. [Crossref]
- Kerbel RS (2003) Human tumor xenografts as predictive preclinical models for anticancer drug activity in humans: better than commonly perceived—but they can be improved. Cancer Biol Ther 2: S134-139. [Crossref]
- John T, Kohler D, Pintilie M, Yanagawa N, Pham NA, et al. (2011) The ability to form primary tumor xenografts is predictive of increased risk of disease recurrence in early-stage non–small cell lung cancer. Clin Cancer Res 17: 134-141. [Crossref]
- Pocard M, Muleris M, Hamelin R, Salmon RJ, Dutrillaux B, et al. (1998) Growth dependency of human colon cancer xenograft on organ environment is related with their original clinical stage. Anticancer res 18: 2743-2747. [Crossref]
- Lencioni R, Llovet JM (2010) Modified RECIST (mRECIST) assessment for hepatocellular carcinoma. Semin Liver Dis 30: 52-60. [Crossref]
- Zhu AX, Duda DG, Sahani DV, Jain RK (2011) HCC and angiogenesis: possible targets and future directions. Nat Rev Clin Oncol 8: 292-301. [Crossref]
- Addley HC, Griffin N, Shaw AS, Mannelli L, Parker RA, et al. (2011) Accuracy of hepatocellular carcinoma detection on multidetector CT in a transplant liver population with explant liver correlation. Clin Radiol 66: 349-356. [Crossref]
- Faqi AS (2016) A comprehensive guide to toxicology in nonclinical drug development. Academic Press.
- Thompson SM, Callstrom MR, Knudsen B, Anderson JL, Carter RE, et al. (2012) Development and preliminary testing of a translational model of hepatocellular carcinoma for MR imaging and interventional oncologic investigations. J Vasc Interv Radiol 23: 385-395. [Crossref]
- Chan HH, Chu TH, Chien HF, Sun CK, Wang EM, et al. (2010) Rapid induction of orthotopic hepatocellular carcinoma in immune-competent rats by non-invasive ultrasound-guided cells implantation. BMC Gastroenterol 10: 83. [Crossref]
- Novikoff AB (1957) A transplantable rat liver tumor induced by 4-dimethylaminoazobenzene. Cancer Res 17: 1010-1027. [Crossref]
- Ma X, Liu Z, Yang X, Gao Q, Zhu S, et al. (2011) Dual-modality monitoring of tumor response to cyclophosphamide therapy in mice with bioluminescence imaging and small-animal positron emission tomography. Mol imaging 10: 278-283. [Crossref]
- Thompson SM, Callstrom MR, Knudsen B, Anderson JL, Butters KA, et al. (2013) AS30D model of hepatocellular carcinoma: tumorigenicity and preliminary characterization by imaging, histopathology, and immunohistochemistry. Cardiovasc Intervent Radiol 36: 198-203. [Crossref]
- Oliva MR, Saini S (2004) Liver cancer imaging: role of CT, MRI, US and PET. Cancer imaging 4: S42-46. [Crossref]
- Prabhu S, Goda JS, Mutalik S, Mohanty BS, Chaudhari P, et al. (2017) A polymeric temozolomide nanocomposite against orthotopic glioblastoma xenograft: tumor-specific homing directed by nestin. Nanoscale 9: 10919-10932. [Crossref]
- Chandrani P, Prabhash K, Prasad R, Sethunath V, Ranjan M, et al. (2017) Drug-sensitive FGFR3 mutations in lung adenocarcinoma. Ann Oncol 28: 597-603. [Crossref]
- Chaudhari P (2015) Preclinical animal model and non-invasive imaging in apoptosis. In: Proteases in Apoptosis: Pathways, Protocols and Translational Advances. Springer: 203-237.
- Sarraf-Yazdi S, Mi J, Dewhirst MW, Clary BM (2004) Use of in vivo bioluminescence imaging to predict hepatic tumor burden in mice. J Surg Res 120: 249-255. [Crossref]
- Guo Y, Klein R, Omary RA, Yang GY, Larson AC (2010) Highly malignant intra-hepatic metastatic hepatocellular carcinoma in rats. Am J Transl Res 3: 114-120. [Crossref]
- Zhao G-J, Xu L-X, Chu ES, Zhang N, Shen J-Y, et al. (2012) Establishment of an orthotopic transplantation tumor model of hepatocellular carcinoma in mice. World J Gastroenterol 18: 7087-7092. [Crossref]
- Hwang GL, Van den Bosch MA, Kim YI, Katzenberg R, Willmann JK, et al. (2015) Development of a High-Throughput Molecular Imaging-Based Orthotopic Hepatocellular Carcinoma Model. Cureus 7.
- Lee TK, Na KS, Kim J, Jeong HJ (2014) Establishment of animal models with orthotopic hepatocellular carcinoma. Nucl Med Mol Imaging 48: 173-179. [Crossref]