2021 Copyright OAT. All rights reserv
The figures show a microscopic immunofluorescent images of mouse hippocamal tissue, labeled with antibodies against specific neuronal marker neurofilament H (red) and astrocytic marker glial fibrillary acidic protein (GFAP, green). Astrocytes are particularly abundant in the periventricular and perivascular areas, where they are one of the key components that form a blood-brain barrier (figure a; magnification x 100). Interweaving of axons and astrocytic processes can be seen at larger magnification (figures b and c; magnification x 1000). Recent researches clearly show active regulatory role of astrocytes in various homeostatic and adaptive processes, such as neuronal firing, neurotransmitter metabolism, synaptogenesis and neuroplasticity [1].
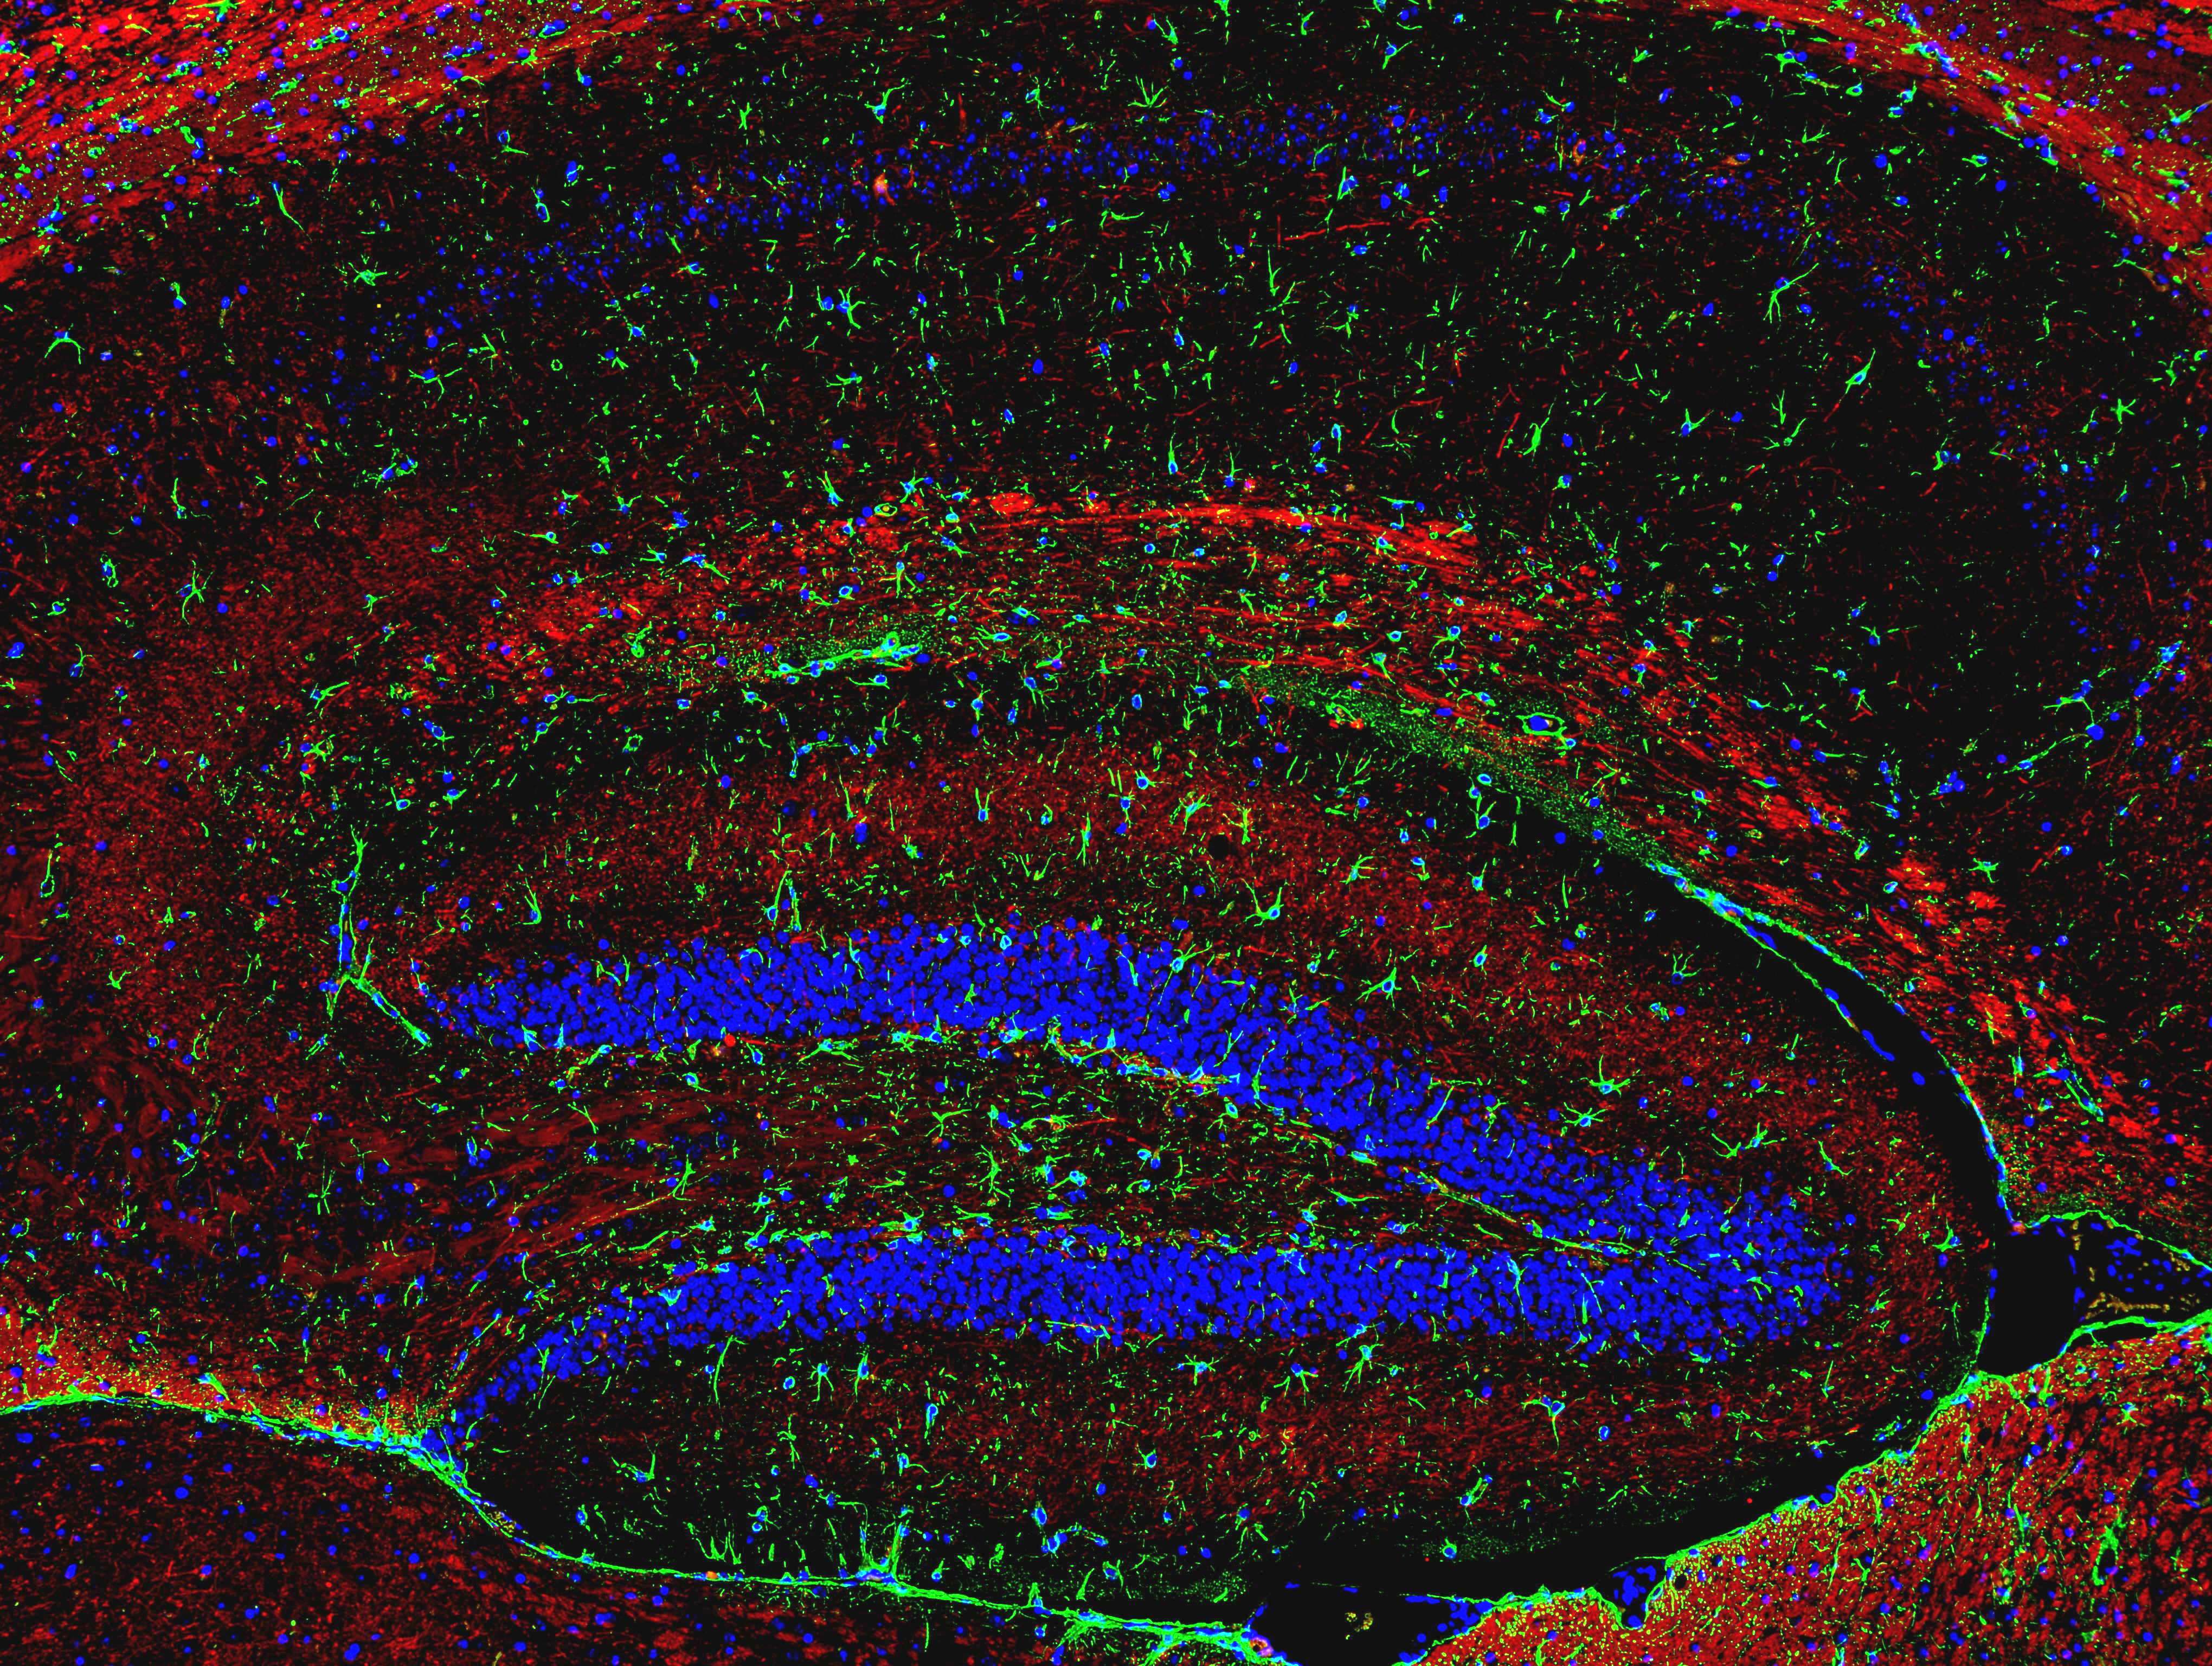
figure a
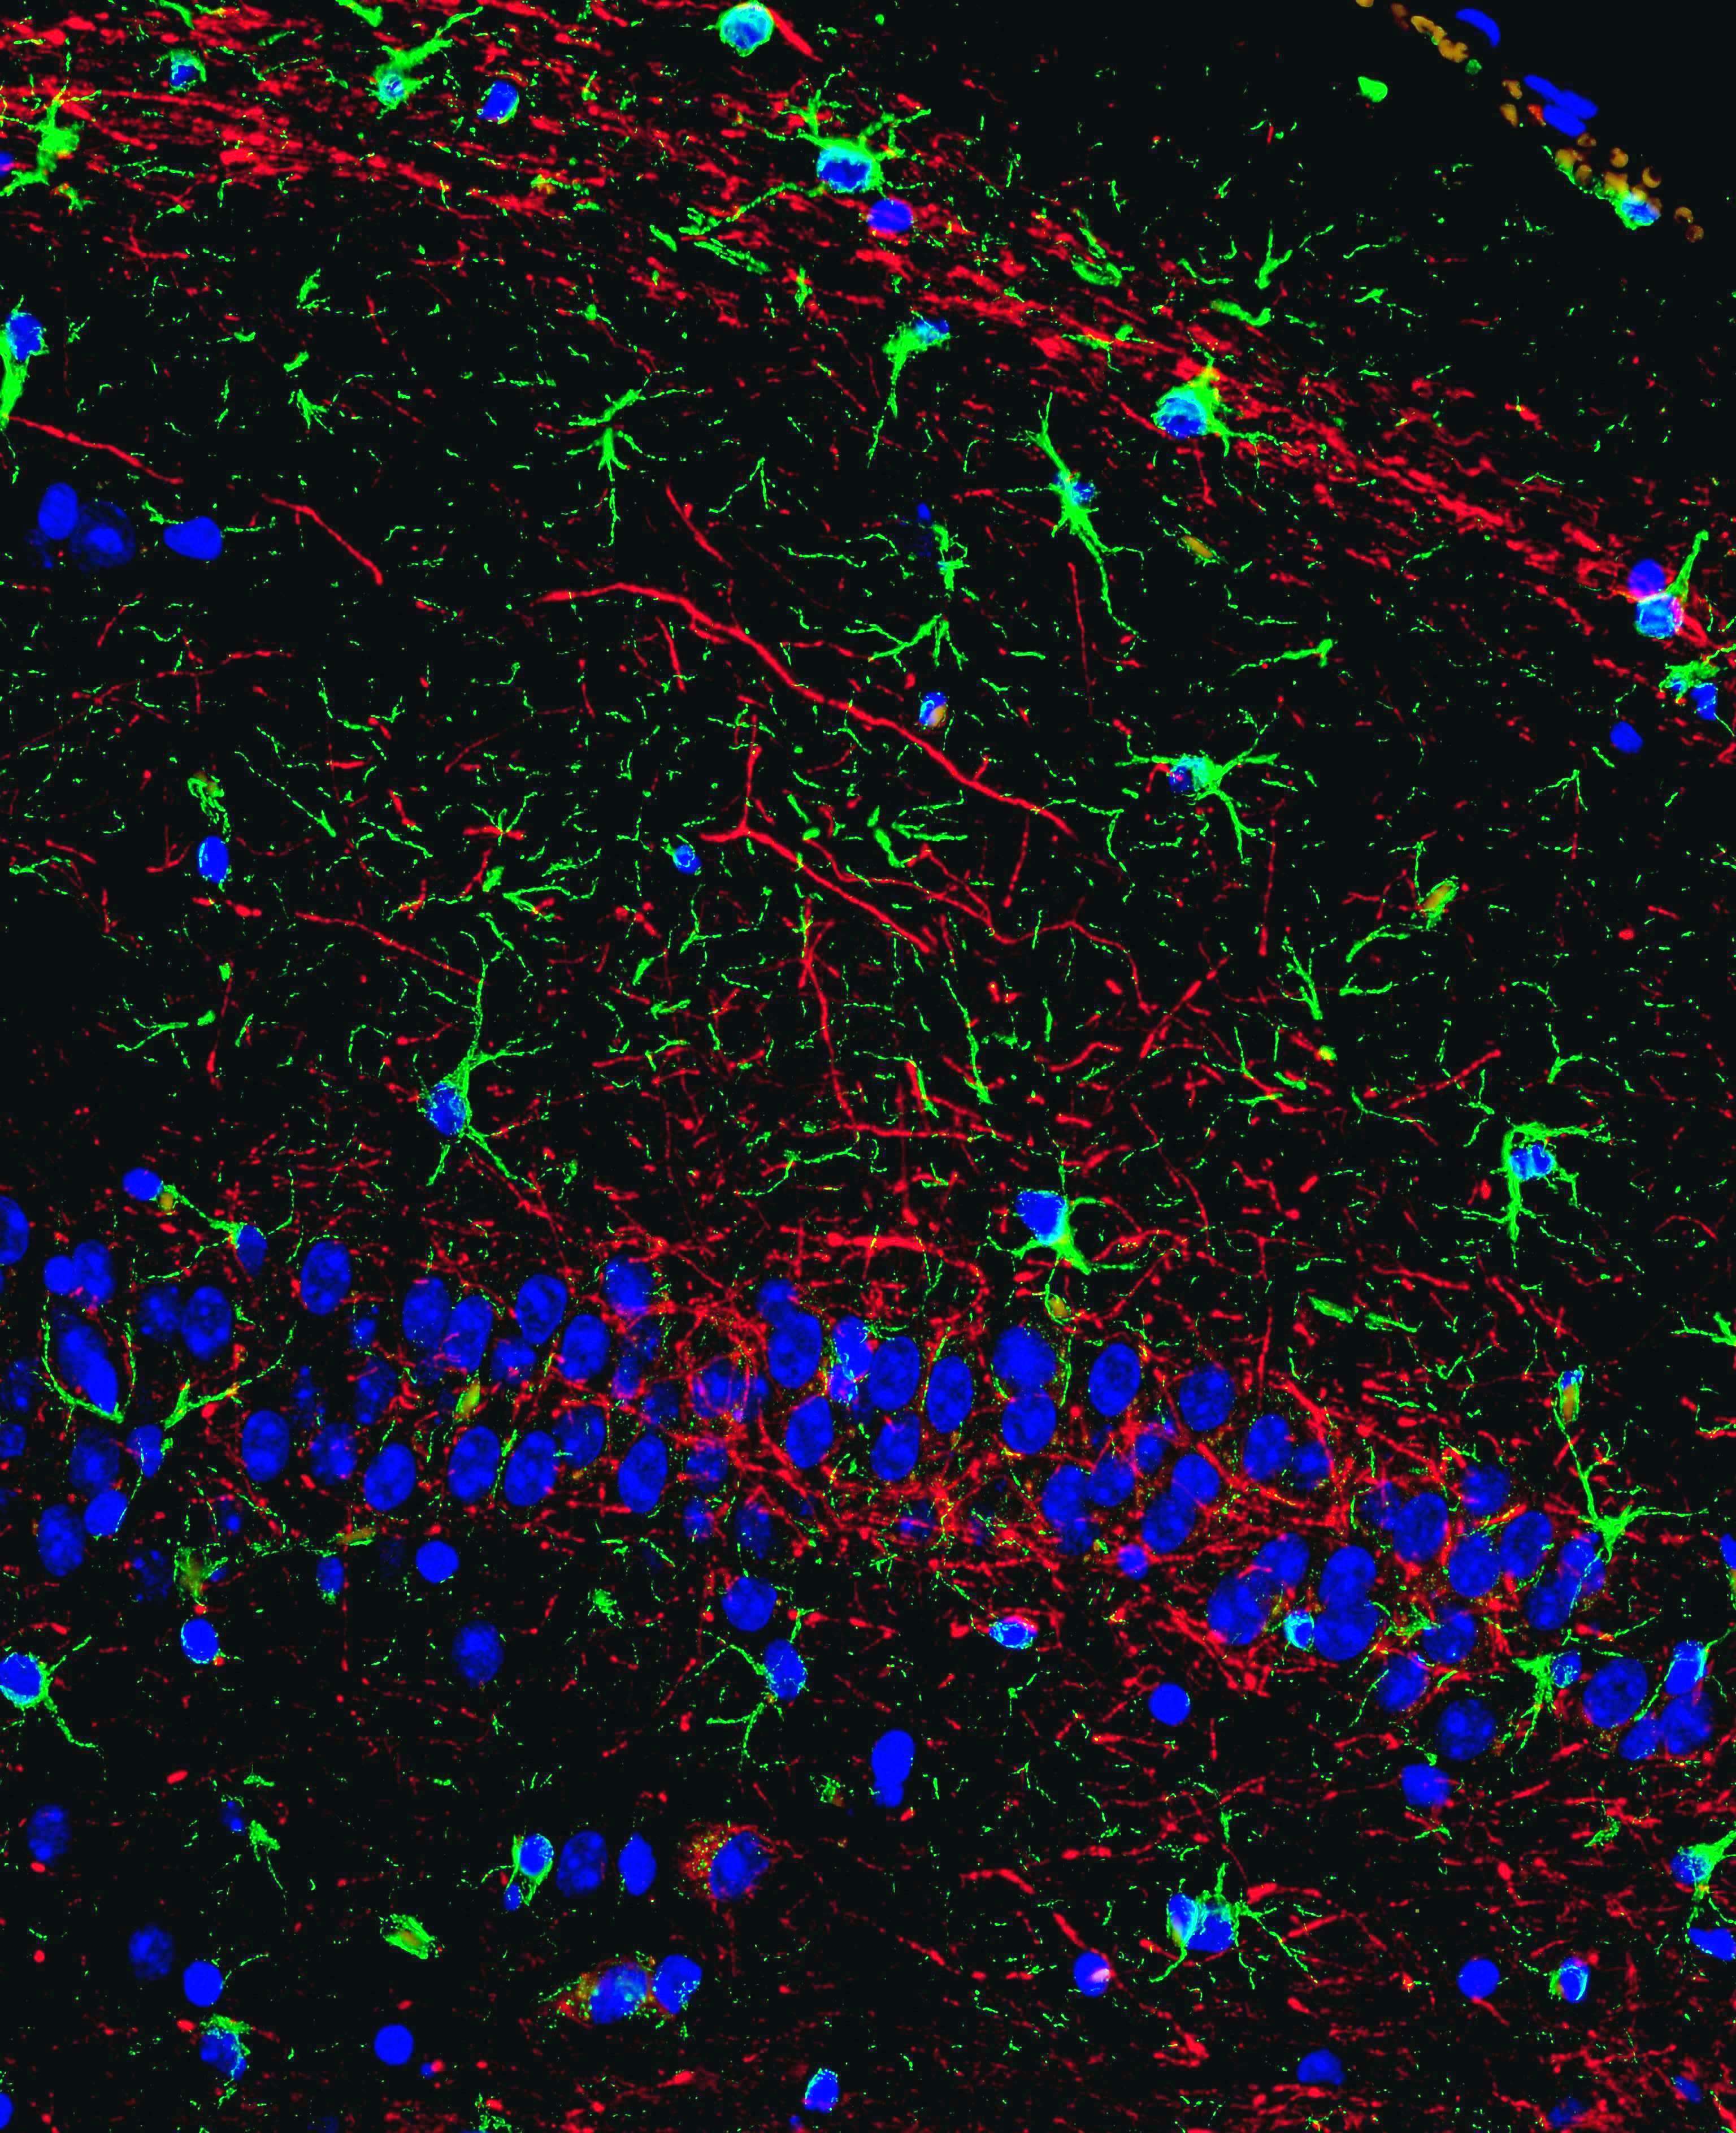
figure b
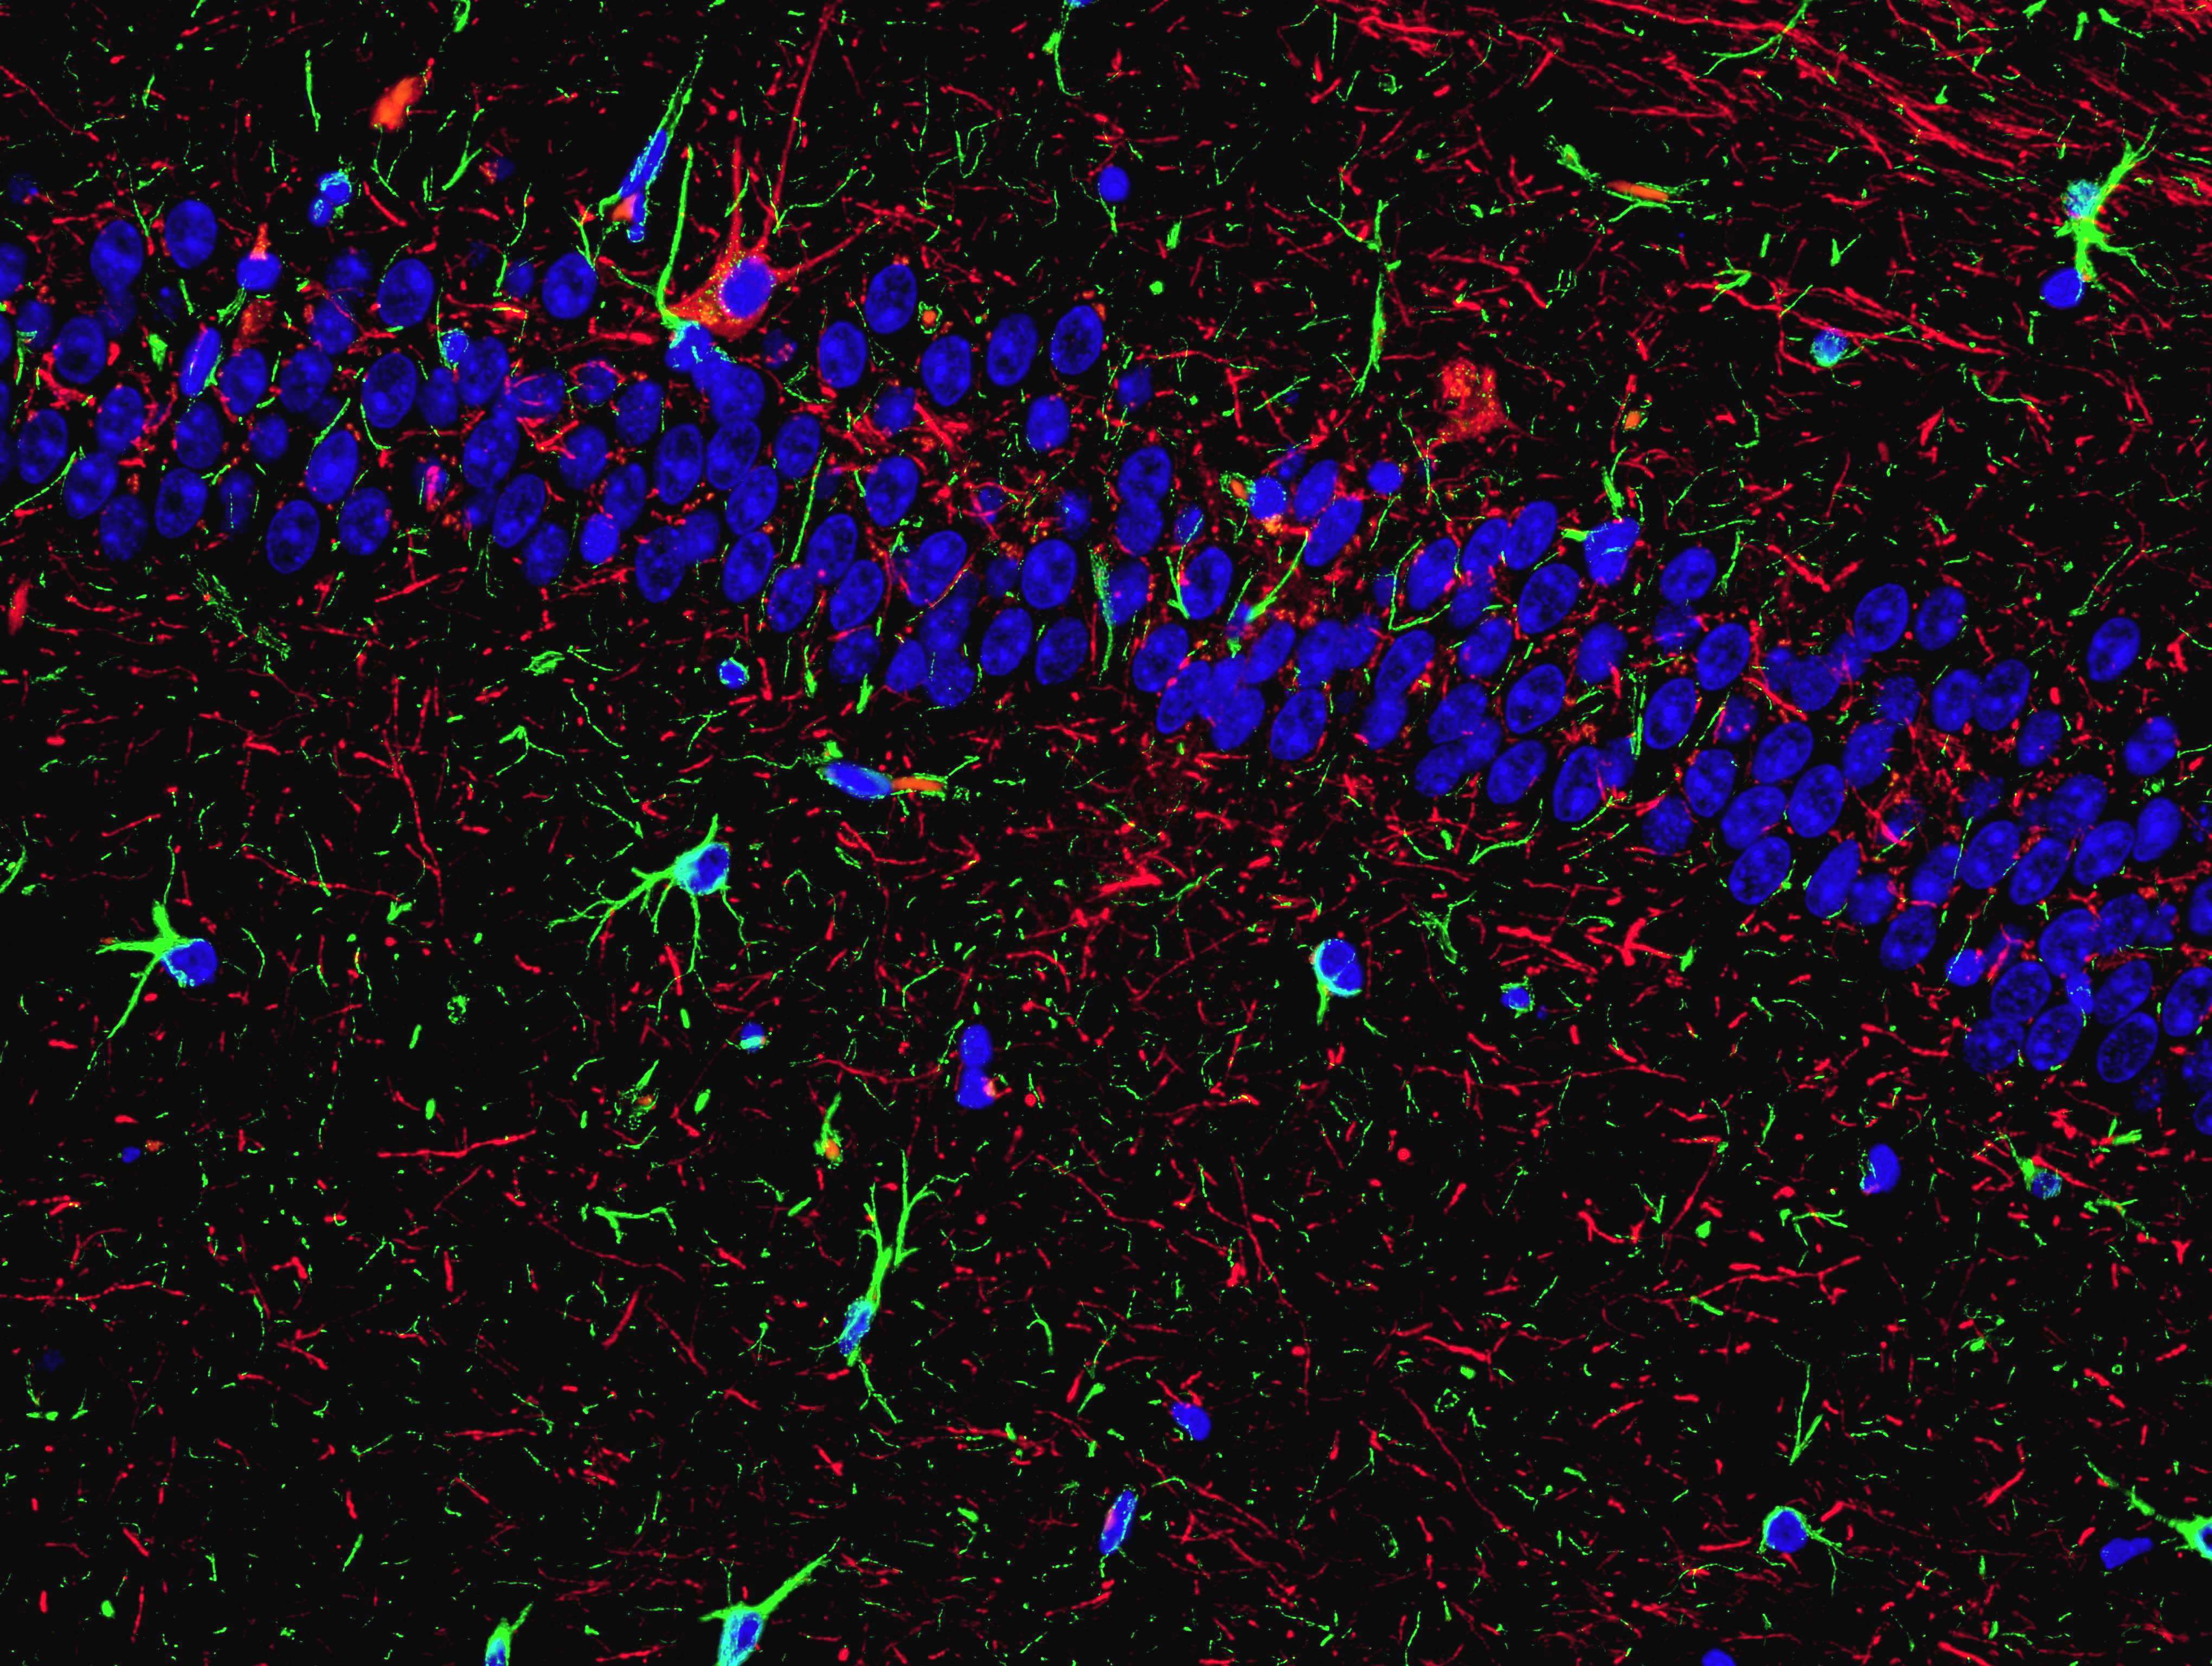
Figure c
References
- Blanco-Suárez E, Caldwell AL, Allen NJ (2017) Role of astrocyte-synapse interactions in CNS disorders. J Physiol 595: 1903-1916. [Crossref]
Editorial Information
Editor-in-Chief
Article Type
Image Article
Publication history
Received: March 20, 2018
Accepted: April 17, 2018
Published: April 19, 2018
Copyright
©2018 Jakovac H. This is an open-access article distributed under the terms of the Creative Commons Attribution License, which permits unrestricted use, distribution, and reproduction in any medium, provided the original author and source are credited.
Citation
Jakovac H (2018) Neuronal-astrocytic network of the mouse hippocampus. Glob Imaging Insights 3: DOI: 10.15761/GII.1000152
Corresponding author
Hrvoje Jakovac
Department of Physiology and Immunology, Medical Faculty, University of Rijeka, Brace Branchetta 20, 51000 Rijeka, Croatia