Wine is an alcoholic beverage made from fermented fruit juice. The study about wine production is known as Oenology. Wine making or vinification begins with the selection of the fruit, its fermentation into alcohol, and the bottling of the finished liquid. In the present study, Musa acuminata and Ananas comosus were used for the wine production under controlled fermentation for 20 days using Saccharomyces cerevisiae. The aliquots from both the wine mixture and control were taken under sterilized condition for various physico-chemical analyses at an interval of 5 days. The yeast cell viable count in the wine sample was estimated and it was found to rise initially during fermentation and then declined (17.7×10⁶ to 10.1×10⁶ cells/ml). The alcohol content of the wine sample was found to be 8%. The amount of reducing sugar was estimated using DNS reagent and it was found to decline gradually from 12.3-7.759 mg/ml. The antioxidant property of the samples was estimated using the radical scavenging activity (DPPH assay) and it was found to be about 22.64%. The specific gravity for the wine sample was estimated to be 0.902 g/cm3. The polyphenol content was estimated using Folin-Ciocalteus method (25.8-17.8786 mg/ml). The acidity of the wine increased as fermentation proceeded. The pH of the sample decreased to 2.5 from 4. The electrical conductivity was found to be 1.98 mS. The temperature ranged between 25-30.2℃. The FTIR was done with wine sample and the main functional group was found to be OH group.
wine, Saccharomyces cerevisiae, Ananas comosus, alcohol, banana, acidity
India is one of the largest producers of fruits in the world. Fruits are one of the most important food of mankind. They are indispensable for the maintenance of health and improve the quality of our diet. Fruits provide essential ingredients like vitamins, minerals, carbohydrates, etc. Fruit juices are fermented to produce wine, an alcoholic beverage which are also nutritive and tastier. Wine will have a flavour like fresh fruit which could be stored and transported under the existing conditions. Being fruit based fermented and undistilled product, wine contains most of the nutrients present in the original fruit juice. The nutritive value of wine is increased due to release of amino acids and other nutrients from yeast during fermentation. Fruit wines contain 8 to 11 per cent alcohol and 2 to 3 percent sugar with energy value ranging between 70 and 90 kcal per 100 ml.
Grapes are usually preferred because of the natural chemical balance of the grape juice which aids their fermentation process without the addition of sugars, acids, enzymes, or other nutrients. However, fruits such as banana, cucumber, pineapple and other fruits are used in wine production [1-3]. Home-made wine production has been practiced with various fruits such as apple, pear and strawberry, cherries, plum, banana, pineapple, oranges, cucumber, watermelon, guava, etc. using species of Saccharomyces cerevisiae which converts the sugar in the fruit juices into alcohol and organic acids, that later react to form aldehydes, esters and other chemical compounds which also help to preserve the wine [4-6]. Yeasts from other sources such as palm wine has also been used [7] in the production of fruit wine.
Banana (Musa acuminata) serves as good nutritional sources of carbohydrates, minerals such as potassium and vitamins such as B1, B2, B3, B12, C and E. Following the high nutritional content of banana, it is consumed in large quantity all over the world. The banana fruit can be eaten raw or cooked, processed into flour or fermented for the production of beverages such as banana juice, beer, vinegar and wine [8-10]. However, banana has a short shelf-life under the prevailing temperature and humidity condition. This results to wastage of the fruits as a result of poor handling and inadequate storage facilities [11,12]. Moreover, fermenting banana juice into wine is considered to be an attractive means of utilizing surplus banana, since the consumption of banana wine provides a rich source of vitamins and ensures harnessing of the fruits into a useful by-product [1].
In the present study, pineapple and banana were chosen for wine preparation as both the fruits contain high amount of sugar content. The pineapple consists of vitamins, and minerals, including potassium, copper, manganese, calcium, magnesium, vitamin C, β-carotene, thiamin, B6, folate, as well as soluble and insoluble fiber and bromelain [13]. Pineapples contain good sugar proportion which makes it suitable for wine making [14]. Considering the important properties of these fruits, it is of more advantage to have blends of the fruits for wine production. It will enhance and improve the properties of the wine. Therefore, the present study focused on the production and determination of physicochemical and sensory properties of pineapple banana wine.
Collection of fruits
Mature and ripened Musa acuminata and Ananas comosus fruits were purchased from local market, Cherthala, Alappuzha district, Kerala state, India and brought to the laboratory, washed and cleaned. The fruits were chopped into small pieces.
Yeast strain
Yeast strain Saccharomyces cerevisiae, from the culture collection of Department of Biotechnology and Research, K.V.M. College of Science and Technology, Kerala, India was used for fermentation process.
Preparation of yeast starter culture
Saccharomyces cerevisae was cultured in sterilized glucose yeast extract broth (glucose 1%, yeast extract 0.3%, malt extract 0.3%, peptone 0.5% and pH 4.5) for 24 hours at 30℃ on a rotary shaker at 60 rpm. The cells were then separated by centrifugation at 6000 rpm at 4℃ for 10 min. The cells were washed twice and resuspended in normal saline to obtain a concentration of 108 cells/ml and this was used as the pre-inoculum. The inoculum was prepared by transferring 10 ml of pre-inoculum in 250 ml erlenmeyer flask containing 100 ml mixture of Musa acuminata and Ananas comosus fruit juice. The mixture was then incubated overnight at 30℃ in shaking incubator at 60 rpm.
Preparation of must and fermentation
The substrates used for the production of wine, was a mixture of chopped pineapple and banana fruits (each of 1 Kg). A sugar solution was prepared with 100 g of sugar and 250 ml of water. The crushed fruits and the sugar solution were added into a wine making jar and mixed well. A control was also made from the crushed fruit of pineapple and banana, and sugar solution. Both control as well as the must for fermentation were sterilized and cooled.
The fermentation was initiated by the addition of the starter culture, into the prepared must. The must was mixed well and kept for fermentation in a cool dry place. Fermentation was done for 20 days in dark. Aliquots were taken from both the sample as well as control for various analytical tests at an interval of 5 days. This was achieved by filtering the samples using muslin cloth, sieve and syphon tubes sterilized by 70 % alcohol. The wines were syphoned into the sieve containing four layers of muslin cloth. The residues were removed, and the filtrates were used for the various analytical tests. After 20 days the fermentation was stopped by immersing the jar in 68-70°C water bath. The wine was filtered as mentioned above and with this the sensory evaluation was conducted.
Measurement of yeast cell growth
Cell propagation (i.e. growth) was determined spectrophotometrically by measuring the optical density at 600 nm, of samples taken from re-suspended cell cultures during the fermentation period.
Estimation of alcohol
The estimation of alcohol was done using the Iodoform test [15]. About 1 ml of the wine sample containing alcohol was taken in a test tube and 4 drops of 1 N sodium hydroxide (NaOH) was added. The concentrated solution of iodine was added drop by drop until the faint yellow colour persisted. The tubes were allowed to stand for a minute and excess amount of NaOH solution was added if excess colour developed. The mixture was shaken well and allowed to stand for 2-3 minutes. A yellow coloured precipitate was formed. This precipitate was removed at room temperature and weighed to calculate the amount of alcohol present in the sample.
Determination of reducing sugars by 3, 5-dinitrosalicylic acid (DNS) method
The concentration of reducing sugar was measured using DNS method [16]. DNS reagent was prepared by adding 1 g of DNS and 30 g of sodium potassium tartaric acid to 80 ml of 0.5 N NaOH. The solution was kept at 45°C for the complete dissolution of reagents and then cooled down to room temperature and diluted with distilled water to 100 ml. The solution was stored for two weeks at 4°C. For the measurement of wine sample, 0.4 ml of DNS reagent was added to 0.1 ml of sample and test tubes were kept at 95°C for 5 min in a water bath and after incubation the absorbance was measured at 540 nm.
Titratable acidity
Titratable acids represent the sum of all acids in wine. Titratable acidity as percentage of citric acid was determined by the method of AOAC [17].
Determination of specific gravity
The specific gravity of the wine sample was determined using specific gravity bottle [18]. The specific gravity bottle (50 ml) was cleaned with distilled water and drained. It was then dried in an oven and was cooled. The dried bottle was weighed, and the value was recorded as W1. The bottle was then filled with distilled water and surface of the bottle was cleaned using cotton and was weighed. The value was recorded as W2. The bottle was emptied and washed with 10 ml of the wine sample. After which the bottle was filled to the brim with the wine sample and was weighed and recorded as W3. The specific gravity of the sample was calculated with the following equation,
Specific Gravity = (W3-W1)/(W2+W1)
Determination of total phenolic content
Total phenolic content (TPC) in the wine sample was determined using the Folin–Ciocalteu (FC) method [19]. The calibration curve was established using gallic acid (0–60 μg/ml). The wine sample and the gallic acid (1.6 ml) was added to 0.2 ml FC reagent and mixed thoroughly for 3 minutes. The sodium carbonate (0.2 ml, 10% weight/volume) was added to the mixture and it was allowed to stand for 30 minutes at room temperature. The absorbance was measured at 760 nm using a UV–VIS spectrophotometer. The TPC was calculated using the gallic acid calibrated graph.
Determination of pH
pH of the wine samples were checked using a digital pH meter (Eutech Cyber Scan
pH 510) pre-calibrated with buffers of pH 4.0 and 7.0 [20].
Measurement of temperature
One hundred and twenty (120℃) mercury bulb thermometer was inserted to the side arm of the fermentation flask through a sterile rubber cork. The periodic temperature change during fermentation was recorded.
Antioxidant assay using DPPH method
The Radical Scavenging Activity (RSA) of the wine was estimated using the DPPH (2,2-diphenyl-1-picrylhdrazyl) assay [21] with some modifications. The decrease in the absorption of the DPPH solution after the addition of wine was measured at 520 nm. About 5 ml of the wine sample was mixed with 5 ml of 0.06 mM DPPH in methanol. The mixture was incubated in dark for 30 minutes. The absorbance was measured at 520 nm.

Where Abs control is the absorbance of DPPH radical plus distilled water, Abs sample is the absorbance of DPPH radical plus wine sample.
FTIR spectroscopy
Fourier Transform Infrared Spectrophotometer (FTIR) is the powerful tool for identifying the types of chemical bonds (functional groups) present in compounds. The spectrum displays the specific light wavelengths absorbed by chemical bonds which can characterize them. Thus, the various chemical bonds present in a molecule can be analysed through interpretation of the obtained infrared spectrum. Tablets for FTIR spectroscopy (FTIR Shimadzu Prestige 21) were prepared in agate mortars, by mixing a drop of wine sample with KBr (1:100 p/p). The absorbance spectra were measured between 400 and 4000 cm-1.
Electrical conductivity
The electrical conductivity (EC) was determined using electrical conductivity meter (Systronics 308).
Sensory evaluation
The wine produced were compared for colour, flavour, taste, clarity, and overall acceptability (OA) were carried out of a 5 point hedonic scale [22,23]. Of the 5 point hedonic scale, the score below 2.5 was considered to be very poor and above 3 was considered to be of better acceptance.
Wine is a healthful beverage which has been used as a natural remedy for human sickness from historic times and have been said to be an aid in recovery during recuperating period [24,25]. There were fluctuations in the temperature of the mixed fruit wine throughout the period of fermentation. This could be as a result of biochemical changes occurring during the metabolism of the substrates by the fermenting organism. Temperature of the final mixed fruit wine ranged from 27°C to 30°C. The pH in the mixed fruit wine was acidic throughout the period of fermentation. The pH ranged from 4.0 to 2.5 (Figure 1). A steady increase in alcohol content was observed in the wine sample throughout the period of fermentation (Figure 2). The concentration of alcohol in the mixed fruit wine at the end of fermentation were observed to range from 0 to 8.1%.
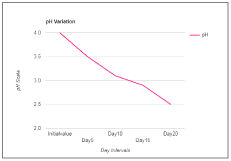
Figure 1. pH of wine sample.
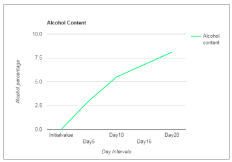
Figure 2. Alcohol Content of wine sample.
The present study also revealed a consistent increase in the total acidity in the wine sample throughout the period of fermentation. The total acidity of final wine is expected to be between 0.5 and 1.0 % [2]. In this study, the result of the total acidity in the mixed fruit wines fell within this limit ranging from 0.291 to 0.476 g/L. The concentration of the yeast cell increases initially and then decrease gradually as the fermentation proceeds. At Day 5, the concentration was found to be 17.7×10⁶ cells/ml, and 10.1×10⁶ cells/ml at day 20. The initial value for the specific gravity was found to be about 1.210 g/cm3 and the final value at Day 20 was found to be 0.902 g/cm3 (Table 1). The concentration of the reducing sugar declines as the fermentation proceeds. This reduction occurs due to the utilization of the sugar by the yeast cells to produce alcohol. The initial value for the reducing sugar was estimated to be 12.3 mg/ml as fermentation proceeds by Day 20 the value declines to 7.76 mg/ml (Figure 3).
Table 1. Results of physicochemical analysis
Physicochemical parameters |
Days |
0 |
5 |
10 |
15 |
20 |
pH |
4 |
3.5 |
3.1 |
2.9 |
2.5 |
Yeast viable cell count (Cells/ml) |
Nil |
17.7×10⁶ |
16.8×10⁶ |
13.4×10⁶ |
10.1×10⁶ |
Alcohol content (%) |
Nil |
3 |
5.5 |
6.8 |
8.1 |
Specific gravity (g/cm3) |
1.21 |
1.025 |
1.02 |
1.015 |
0.902 |
Reducing sugar analysis (mg/ml) |
12.3 |
9.46 |
9.05 |
8.67 |
7.76 |
Total phenolic content (mg/ml) |
25.8 |
22.032 |
20.78 |
19.28 |
17.87 |
Titratable acidity (g/L) |
0.291 |
0. 302 |
0. 307 |
0. 401 |
0.476 |
Temperature (°C) |
27 |
25 |
26 |
28 |
30.2 |
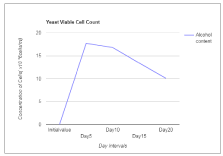
Figure 3. Concentration of yeast cells.
The total phenolic content also gradually decreases as the fermentation proceeds, with an initial concentration of 25.8 mg/ml and a final concentration of 17.87 mg/ml. The acidity of the wine sample increases, in accordance with the rise in the alcohol content as the fermentation proceeds. Initially the concentration was estimated to be 0.291 g/l but at Day 20 it was increased to 0.476 g/l (Table 1). The changes observed with the pH in the wines could be due to the acid production during the fermentation by the microorganism [26]. The specific gravity decreases due to the microbial utilization of nutrients primarily sugars in the sample for metabolic activities along with the evolution of CO2 and heat [25,27]. The titratable acidity increased due to the increase in the alcohol concentration [26]. The electrical conductivity of the wine sample was found to be 1.98 mS. The antioxidant content in the wine sample was estimated to be about 22.64%.
The sensory evaluation conducted proves that the wine produced from the mixtures of pineapple and banana can be considered to be a good quality wine as its acceptance is mostly over 3 (Figure 4). The flavour of alcoholic beverages is due to numerous volatile and non-volatile compounds which confer the typical taste and odour of the beverage. The volatile compounds of wine perceived by the olfactory system are greatly dependent on the concentration of ethanol [28].
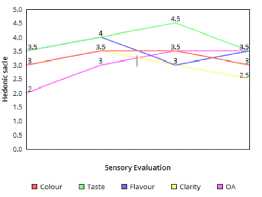
Figure 4. Results of sensory evaluation
The fresh non-fermented fruit juice mixture contains glucose, fructose and sucrose. The marker bands of these carbohydrates are identified in the spectral range between 900 and 1400 cm inverse. The bands in the region 900-1153 cm inverse are assigned to C-O and C-C stretching modes, while those in the 1400-1199 cm inverse region are due to O-C-H, C-C-H and C-O-H bending vibrational modes of the carbohydrates. Higher sucrose level corresponds to intense band at 995 cm inverse. Traces of proteins are found as is evidenced by the amide I band and amide II bands corresponding to 1635 cm inverse and 1579 cm inverse respectively. Amide I bands are due to C=O stretch weakly coupled with C-N stretch and N-H bonding. Amide II region corresponds to C-N stretch strongly coupled with N-H bending (Figure 5).
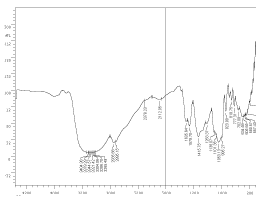
Figure 5. FTIR spectrum of non-fermented fruit juice
The fermented fruit juice mixture shows an abundance of ethyl alcohol as is evidenced from the typical C-O stretches at 1102 cm inverse and 1102 cm inverse along with the presence of O-H stretch at 3391 cm inverse and C-H stretch at 2961 cm inverse respectively (Figure 6). Also, it is to be noted that correspondingly the bands due to carbohydrates (glucose, fructose and sucrose) became weak after fermentation. At the same time the amide bands showed prominence after fermentation (1647 cm inverse and 1575 cm inverse).
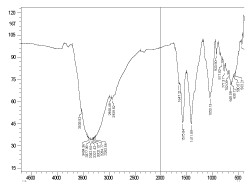
Figure 6. FTIR spectrum of wine sample
Broader bands present in both samples before and after fermentation, peaks between 2000 cm inverse and 3000 cm inverse could be due to traces of amino acids exhibiting C-H and N-H bonds. Bands between 2000-3500 cm inverse present in both samples (before and after fermentation) correspond due to -O-H groups of free amino acids or from water which enters into strong hydrogen bonding. The presence of ethyl alcohol is evidenced from C-O stretches at 1102 cm inverse and 1055 cm inverse.
Wine produced from mixed fruits possess beneficial properties of both fruits pineapple and banana, hence considered to be more efficient than single fruit wine. Being fruit based fermented and undistilled product, wine contains most of the nutrients present in the original fruit juice. The nutritive value of wine is increased due to release of amino acids and other nutrients from yeast during fermentation. The present study which was based on the evaluation of two indigenous fruits as substrates for wine production has revealed that the two fruits are good substrates for wine production. The sensory evaluation revealed the wine was of good quality. It can be concluded that this study using mixed fruits pineapple and banana was found to be a good alcoholic beverage with high nutritional value and beneficial health properties.
The authors sincerely thank Dr. V.V. Pyarelal, Director, K.V.M. Science & Technology, Cherthala for providing necessary facilities for conducting this research work.
- Obaedo ME, Ikenebomeh MJ (2009) Microbiology and production of banana (Musa sapientum) wine. Niger J Microbiol 23: 1886–1891.
- Chilaka CA, Uchechukwu N, Obidiegwu JE, Akpor OB (2010) Evaluation of the efficiency of yeast isolates from palm wine in diverse fruit wine production. Afr J Food Sci 4: 764–774.
- Noll RG (2008) The wines of West Africa: history, technology and tasting notes. J Wine Econ 3: 85–94.
- Fleet GH (2003) Yeast interactions and wine flavour. Int J Food Microbiol 86: 11-22. [Crossref]
- Duarte WF, Dias DR, Oliveira MJ, Teixeira JA, Silva JD, et al. (2010) Characterization of different fruit wines made from Cocoa, Cupuassu, Gabiroba, Jaboticaba and Umbu. Food Sci Technol 30: 1–9.
- Isitua CC, Ibeh IN (2010) Novel method of wine production from banana (Musa acuminata) and pineapple (Ananas cosmosus) waste. Afr J Biotechnol 9: 7521–7524.
- Ayogu TE (1999) Evaluation of the performance of yeast isolate from Nigeria palm wine in wine production from pineapple fruits. Bioresour Technol 69: 189–190.
- Pillay M, Tenkouano A, Ude G, Irtiz R (2004) Molecular characterization of genomes in Musa and its application, Banana improvement: cellular molecular biology and induced mutations. Science Publishers Inc pp: 124–185.
- Nelson SC, Ploetz RC, Kepler AK (2006) Musa species (bananas and plantains). Species Profiles for Pacific Island Agroforestry 22: 1-28.
- Pillay M, Tripathi L, Berlin V (2007) Banana. In: Kole C (ed) Genome mapping and molecular breeding in plants, fruits and nuts. Springer 4: 281–301.
- Akubor PJ, Obio SO, Nwadomere KA, Obiomah E (2003) Production and quality evaluation of banana wine. Plant Food Hum Nutr 58: 1–6.
- Wall MM (2006) Ascorbic acid, vitamin A and mineral composition of banana (Musa spp.), papaya (Carica papaya) cultivars grown in Hawaii. J Food Compos Anal 19: 434–445.
- Hossain FM, Akhtar S, Anwar M (2015) Nutritional Value & Medicinal Benefits of Pineapple. Int J Nutr Food Sci 4: 84-88.
- Adaikan P, Ganesan AA (2004) Mechanism of the Oxytoxic activity of Comosus proteinases. J Pharm Biol 42: 646-655.
- Kulandaivel S, Janarthanan S (2012) Practical manual on fermentation technology. IK International Publishing House Pvt. Ltd. New Delhi, pp: 116-117.
- Saqib AAN, Whitney PJ (2011) Differential behaviour of the dinitrosalicylic acid (DNS) reagent towards mono- and di-saccharide sugars. Biomass Bioenergy 35: 4748–50.
- AOAC (1995) Official Method of Analysis. Washington, pp: 3–16.
- Ranganna S (1986) Handbook of analysis and quality control for fruit and vegetable products. Tata Mc. Graw-Hill Publishing Co-Ltd., New Delhi, India.
- McDonald S, Prenzler PD, Autolovich M, Robards K (2001) Phenolic content and antioxidant activity of olive extracts. Food Chem 73: 73-84.
- Ochai JO, Kolhatkar A (2008) Medical Laboratory Science and Practice. Tata McGrew Hill Publishing Limited New Delhi, New York, pp: 50-53, 803.
- Yamasaki K, Hashimoto A, Kokusenya Y, Miyamoto T, Sato T (1994) Electrochemical method for estimating the antioxidative effects of methanol extracts of crude drugs. Chem Pharm Bull (Tokyo) 42: 1663-1665. [Crossref]
- Espinoza YR, Lopez EV, Sanchez HH (2005) Characterization of a wine-like beverage obtained from sugarcane juice. World J Micro Biotech 21: 447–452.
- Tzeng DI, ChaoYing T, YiChen C, YeuPyng L, Ou SMA (2009) Investigation of fermenting conditions for sugarcane (SaccharumofficinarumL.) wine using response surface methodology. J Food Processing and Preservation 33(3): 330-346.
- Jay JM, (1996) Modern Food Microbiology. 5th Edn., Chapman and Hall, New York.
- Okafor N(2007) Modern industrial microbiology and biotechnology science publishers 1.
- Idise, Emmanuel O, Odum (2011) Studies of wine produced from Banana. Intl J Biotech and Mol Bio Research 2 (12): 209-214.
- Uraih N(2003) Public health, food and industrial microbiology 6: 196-198.
- Rothe M, Schrodter R (1996) Flavour contribution of ethanol, a neglected aroma compound. Flavour Science. The Royal Society of Chemistry, Cambridge, UK: 348- 349.


