A popular weight loss strategy is to consume foods deemed “negative-calorie”. These are foods, in theory, for which more energy is expended to digest and assimilate than is consumed, thereby generating an energy deficit. Although the existence of “negative-calorie” foods has been debated, no empirical study has fully addressed the validity of any food being “negative-calorie”. We conducted such a study using the omnivorous bearded dragon (Pogona vitticeps) and raw celery, a frequently cited “negative-calorie” food. Following their consumption of celery meals (5% of body mass), we measured postprandial metabolic rates to determine the cost of digestion and assimilation (i.e., specific dynamic action) and collected feces and urate to determine the energy lost to excretion. The specific energy of celery, feces, and urate was quantified by bomb calorimetry. Lizards lost on average 33%, 29% and 14% of the meal’s energy to specific dynamic action, feces, and urate, respectively, leaving a net gain of 24% of ingested energy. Theoretically, this gain is greater given that only a portion of fecal energy stems from the celery meal. Although refuting the validity of celery and other proposed foods as “negative-calorie”, this study identifies that such foods do contribute to a negative energy budget and thus weight loss.
apparent assimilation efficiency, dieting, energy budget, “negative-calorie”, specific dynamic action, weight loss
A dieting and weight loss scheme that has populated the internet, social media, and dieting and nutrition books is a diet that includes “negative-calorie” foods [1-6]. These are foods, in theory, for which more energy is expended in their digestion, assimilation, and nutrient storage than is gained. Hence, their consumption results in a caloric deficit due to both the lack of net energy gained and that stored energy (i.e., fat) must therefore be utilized in order to fuel the completion of their digestion and processing. Additional benefits noted for “negative-calorie” foods is that they boost metabolism, control appetite, improve glycemic control, and cleanse your colon and liver [1,7]. Diets that include “negative-calorie” foods therefore result in a “win-win situation” given the multiple benefits to your health and improved weight control [8].
The existence of “negative-calorie” foods has been questioned by nutritionists and physicians whom have stated that the accumulative cost of meal digestion, absorption, and assimilation is equivalent to only 5-15% of the meal’s energy, thereby there is a net gain of 85-95% of the energy from any meal [6,9-11]. The only published study (an abstract) that tested the validity of “negative-calorie” foods was conducted on 15 female subjects each of whom consumed 100 g of raw celery [3]. Noted in that study was that the cost of digesting the celery meals was equivalent to 86% of the meals’ energy [3]. However, this study failed to account for the additional loss of energy excreted in feces and urine. Given its relatively high fiber content, celery may inherently be characterized by relatively low digestive and assimilation efficiencies [12,13]. Therefore, when accounting for the combined energy expended on digestion and assimilation and lost to feces and urine, it becomes more theoretically plausible for celery consumption to result in an energy deficit and celery to be a valid “negative-calorie” food [14].
The absence any empirical studies that have tested in an integrative manner the validity of “negative-calorie” foods, encouraged us to undertake such a study using a lizard model, the bearded dragon (Pogona vitticeps) and raw celery meals [9,10,15,16]. Although far removed from humans evolutionarily, bearded dragons share with humans an omnivorous diet and nearly identical sets of morphological and physiological mechanisms used to digest, absorb, and assimilate food [17-19]. In this study, we quantified for each lizard the energy of their celery meal, the energy expended digesting that meal, and the energy lost in feces and urate. By evaluating these energy tradeoffs, we found bearded dragons to experience a net gain in energy from their celery meals. A gain that is however rapidly abolished by the lizard’s own resting metabolism.
Bearded dragons and their maintenance
Although it would have been ideal to conduct this study on humans, it was institutionally prohibitive for the undergraduate co-authors (KMB and AEA) to collect and process human feces and urine. We therefore took advantage of a captive-raised laboratory colony of bearded dragons (Pogona vitticeps), a medium-sized lizard native to arid and semi-arid regions of central Australia [17,20]. Bearded dragons are naturally omnivorous (as are humans), possess a digestive tract that is similar in form (relative to size) and function as the human digestive system [18,19]. In addition, bearded dragons have been used to quantify the energy saved in the consumption of cooked versus raw root vegetables to test hypotheses on the role of cooking in human evolution [21,22].
Lizards were housed in 76-L aquariums with sand substrate, rocks for basking, and water available ad libitum. Room temperature was maintained at 26-29°C and light was provided by fluorescent and UVA/UVB bulbs set on a 12L:12D cycle. Lizards were raised on a variety of greens (e.g., kale, collard, mustard), vegetables (e.g., carrots and squash), and calcium/vitamin dusted crickets, mealworms, and cockroaches. The nine lizards (two females, seven males) used in this study were 4-6 years of age and weighed 190.1 – 234.1 g (mean ± SE = 217.9 ± 4.9 g) at the beginning of the study. Lizard care and experimentation were conducted under an approved protocol (#14-06-0077) from the University of Alabama Institutional Animal Care and Use Committee.
Experimental procedure
We selected celery as the test diet for this study because it tops many of the lists of reported “negative-calorie” foods and bearded dragons will voluntarily eat celery [7,8,15,23]. We standardize meal size to 5% of lizard body mass because it is a meal size that is easily consumed by bearded dragons and one that will generate a significant postprandial metabolic response [11,21]. Prior to metabolic and feeding trials, lizards were fasted for a minimum of 10 days to ensure that they were postabsorptive. Celery was purchased locally fresh and used within 24 hours. To test the validity of celery as a “negative-calorie” food, we compared the gross energy of celery meals to the energy expended on celery digestion and assimilation (specific dynamic action [SDA]) and that lost in feces and urate.
Determination of the standard metabolic rate, postprandial metabolic response, and specific dynamic action
We used closed-system respirometry to quantify for each lizard their standard metabolic rate (SMR) and postprandial metabolic response [24,25]. Fasted lizards were placed into individual respirometry chambers (2.5-3 L) and maintained at 30°C in an environmental chamber. An initial and second air sample (50 mL) taken an hour apart from each respirometry chamber (during which individual chambers were sealed) were pumped into an O2 analyzer (S-3A/II, AEI Technologies). We calculated for each lizard whole animal (mL·h-1) rates of oxygen consumption ( O2) from the change in percent oxygen over the one-hour trial [11,24,26]. From O2 measurements taken in the morning and evening over four consecutive days, we assigned for each fasted lizard its SMR as the mean of its two lowest measured O2 [27]. Following SMR trials, lizards were returned to their cages, fed their pre-weighed celery meals, and then returned to their respirometry chambers. We resumed measurements of O2 at 6-h intervals for 2.5 days and thereafter at 12-h intervals for the following 2.5 days. We calculated for each lizard the cumulative cost (kJ) of meal digestion and assimilation (SDA) by summing the extra O2 consumed (mL) above SMR during the time span that O2 was significantly greater than SMR and multiplying that total by 20.9 J [11]. We assumed for this study that 20.9 J is expended per mL of O2 consumed given that the nutrient dry matter of celery is approximately 15% protein, 5% fat, and 80% carbohydrate, and generates a respiratory quotient of 0.95 [13,28].
Collection of feces and urate
We collected feces and urate from lizards housed individually in 76-L glass aquariums lined with laboratory bench protector (VWR International, Radnor, PA) with the non-absorbent side facing upward. Prior to feeding, we lavage each lizard’s large intestine with water to remove any residual feces and urate. After lizards had finished eating their celery meals, cages were checked twice daily and any deposited feces or urate was removed and dried (55°C). After one week, each lizard’s large intestine was lavage again and any residual feces and urate were collected and dried. For each lizard, we combined and weighed separately their dried feces and urate.
Energy content of food, feces, and urate
Energy content of celery, feces, and urate were determined by bomb calorimetry. Over the course of this study, we used five different batches of celery. For each batch, five samples of diced celery were weighed, dried (55°C), reweighed, and ground to a homogenous fine powder. A subsample of the powder from each of each of the five samples was placed into a pre-weighed gelatin capsule, reweighed, and the capsule and powdered celery were ignited in a bomb calorimeter (model 1266; Parr Instruments, Moline, Illinois, USA) to determine total energy content. For each subsample, we subtracted capsule energy (19.48 kJ g-1 * capsule mass) from total energy to determine celery energy (kJ g-1 dry mass). For each batch we averaged the energy of the five subsamples to determine the dry mass energy for that batch. Specific wet mass energy content of the celery (kJ g-1) was determined as the product of dry mass energy content (13.67 ± 0.24 kJ g-1) and the celery’s dry mass percentage (5.3 ± 0.4%). Among the five batches, wet mass energy content ranged from 0.615 to 0.933 kJ g-1, averaging 0.722 ± 0.057 kJ g-1. We calculated the energy content of each ingested meal as the product of meal mass and wet mass energy content (0.722 kJ g-1) [27]. Samples of feces and urate for each lizard was bombed in triplicate in similar fashion using gelatin capsules. For each lizards, fecal and urate total energy was calculated as the product of their dry mass and dry mass energy equivalent determined as the mean of the triplicate values.
Statistical analyses
We combined repeated-measures analysis of variance (ANOVA) with Tukey pairwise mean comparison to demonstrate the statistical effects of sampling time on metabolic rates and to identify the time point that postprandial metabolic rates returned to values that did not differ significantly from prefeeding rates. This time point identified the duration of significantly elevated postprandial metabolism therefore enabling us to calculate SDA. Statistical analyzes were performed using SAS 9.1.3 (SAS Institute, Cary, NC, USA). We designate the level of significance as P<0.05 and report means with their standard errors (± 1SE).
The cost of meal digestion
Standard metabolic rates of fasted bearded dragons (30°C) averaged 6.44 ± 0.34 mL O2 h-1 (Table 1). Feeding induced a significant (P<0.0001) increase in metabolic rate that peaked within 12 – 24 hours postfeeding, at values that averaged 66 ± 6% greater than SMR (Table 1, Figure 1). Lizards maintained significantly (Ps<0.05) elevated rates of metabolism for up to 3 days postfeeding. For these 3 days, lizards expended 2.64 ± 0.22 kJ digesting and assimilating their celery meals (i.e., SDA) which was equivalent to 33.1 ± 2.4% of the energy of the ingested celery meals (i.e., SDA coefficient [11]) (Table 1).
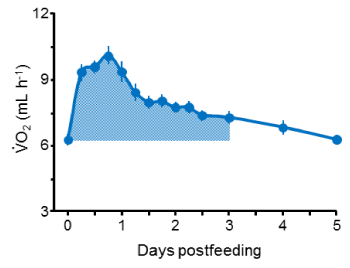
Figure 1. Postprandial profile of oxygen consumption (mean and SE bars) for nine adult bearded dragons at 30°C for five days after consuming a meal of diced raw celery equivalent in mass to 5% of lizard mass. Oxygen consumption rates peaked at 18 hours post feeding at a mean value that was 66% greater than standard metabolic rate (time = 0). The shaded area below the profile represents the extra oxygen consumed above standard metabolic rate for the three-day duration of significantly elevated metabolism from which SDA was quantified for each lizard
Table 1.Body mass, standard metabolic rate (SMR), postprandial peak O2, scope of peak O2, specific dynamic action (SDA), and SDA coefficient (SDA as a percentage of meal energy) of nine adult bearded dragons (Pogona vitticeps) that had consumed celery meals equaling in mass to 5% of lizard body mass
Lizard ID |
Mass
(g) |
SMR
(mL O2 h-1) |
Peak O2
(mL h-1) |
Scope
(peak/SMR) |
SDA
(kJ) |
SDA coefficient
(%) |
PV08 |
212.8 |
6.70 |
10.63 |
1.59 |
2.54 |
33.2 |
PV20 |
228.1 |
5.47 |
9.92 |
1.81 |
2.99 |
36.5 |
PV55 |
210.3 |
6.73 |
10.62 |
1.58 |
3.00 |
39.6 |
PV55,7 |
201.8 |
4.44 |
7.93 |
1.79 |
3.27 |
39.3 |
PV64 |
236.2 |
6.61 |
10.47 |
1.58 |
3.29 |
38.8 |
PV70 |
220.8 |
7.51 |
12.74 |
1.70 |
2.62 |
33.0 |
PV72 |
190.1 |
7.03 |
11.97 |
1.70 |
1.35 |
19.7 |
PV73 |
224.7 |
5.84 |
11.85 |
2.03 |
2.87 |
35.5 |
PV74 |
229.9 |
7.59 |
10.30 |
1.36 |
1.85 |
22.4 |
Mean |
217.2 |
6.44 |
10.72 |
1.68 |
2.64 |
33.1 |
SE |
4.9 |
0.34 |
0.47 |
0.06 |
0.22 |
2.4 |
Energy lost to feces and urate
Feces and urate began to appear in cages within 2 days after feeding. Over the one-week period, lizards produced 0.14 ± 0.02 g dry of feces and 0.11 ± 0.02 g dry of urate (Table 2). Bomb calorimetry determined that the dry mass-specific energy content of feces and urate averaged 16.81 ± 0.56 kJ g-1 and 11.06 ± 0.38 kJ g-1, respectively (Table 2). Total energy of feces and urate produced from the single celery meal averaged 2.29 ± 0.33 kJ and 1.06 ± 0.13 kJ, respectively (Table 2).
Table 2. Dry mass, specific energy, and total energy of feces and urate produced by bearded dragons (Pogona vitticeps) within one week after consuming celery meals equaling 5% of body mass
Lizard ID |
Body mass (g) |
Meal mass (g) |
Feces mass
(g) |
Feces specific energy (kJ g-1) |
Feces energy (kJ) |
Urate mass
(g) |
Urate specific energy (kJ g-1) |
Urate energy (kJ) |
PV08 |
206.8 |
10.34 |
0.07 |
17.00 |
1.19 |
0.10 |
11.00 |
1.10 |
PV20 |
229.7 |
11.48 |
0.15 |
16.41 |
2.46 |
0.08 |
11.52 |
0.92 |
PV55 |
209.4 |
10.47 |
0.07 |
14.52 |
1.02 |
0.13 |
9.12 |
1.19 |
PV55,7 |
202.4 |
10.12 |
0.08 |
19.64 |
1.57 |
0.07 |
10.87 |
0.76 |
PV64 |
231.2 |
11.56 |
0.13 |
18.30 |
2.38 |
0.09 |
12.65 |
1.14 |
PV70 |
224.0 |
11.20 |
0.19 |
14.30 |
2.66 |
0.13 |
9.79 |
1.27 |
PV72 |
196.2 |
9.08 |
0.15 |
17.23 |
2.59 |
0.14 |
11.00 |
1.54 |
PV73 |
223.5 |
11.20 |
0.14 |
16.45 |
2.37 |
0.12 |
11.10 |
1.37 |
PV74 |
244.1 |
12.21 |
0.25 |
17.39 |
4.35 |
0.02 |
12.53 |
0.26 |
Mean |
218.6 |
10.85 |
0.14 |
16.81 |
2.29 |
0.11 |
11.06 |
1.06 |
SE |
5.2 |
0.31 |
0.02 |
0.56 |
0.33 |
0.02 |
0.38 |
0.13 |
Net energy retained
The celery meals provided lizards with 7.83 ± 0.23 kJ of energy, of which 2.53 ± 0.25 kJ was expended on meal digestion and assimilation, 2.29 kJ ± 0.33 was lost as feces, and 1.06 kJ ± 0.13 was excreted as urate (Table 3). Therefore, the net gain in energy from these meals averaged 1.89 ± 0.17 kJ, which was equivalent to 23.4 ± 2.1% of the ingested energy (Table 3). In this study, lizards retained on average nearly a quarter of their meal’s energy.
Table 3.Total food energy, energy expended on specific dynamic action (SDA) and lost to feces and urate, and remaining net energy (absolute and as a percentage of meal energy) for nine bearded dragons (Pogona vitticeps) that had consumed celery meals equaling in mass to 5% of lizard mass. Body and meal masses are the same as for Table 2
Lizard ID |
Food energy
(kJ) |
SDA
(kJ)* |
Feces energy (kJ) |
Urate energy (kJ) |
Net energy
gained (kJ) |
Net gain as % of food energy |
PV08 |
7.47 |
2.48 |
1.19 |
1.10 |
2.70 |
36.2 |
PV20 |
8.29 |
3.02 |
2.46 |
0.92 |
1.89 |
22.7 |
PV55 |
7.56 |
2.99 |
1.02 |
1.19 |
2.37 |
24.9 |
PV55,7 |
7.31 |
2.87 |
1.57 |
0.76 |
2.10 |
28.7 |
PV64 |
8.35 |
3.24 |
2.38 |
1.14 |
1.59 |
19.0 |
PV70 |
8.09 |
2.67 |
2.66 |
1.27 |
1.48 |
18.3 |
PV72 |
6.56 |
1.29 |
2.59 |
1.54 |
1.14 |
17.4 |
PV73 |
8.09 |
2.87 |
2.37 |
1.37 |
1.48 |
18.3 |
PV74 |
8.82 |
1.97 |
4.35 |
0.26 |
2.23 |
25.3 |
Mean |
7.83 |
2.53 |
2.29 |
1.06 |
1.89 |
23.4 |
SE |
0.23 |
0.25 |
0.33 |
0.13 |
0.17 |
2.1 |
*SDA was calculated as the product of meal energy and SDA coefficient of Table 1.
We tested the claim that the cost of digestion and absorption of celery, the most cited example of a “negative-calorie” food, exceeds the gain in assimilated energy. To do so, we used the omnivorous bearded dragon and compared the energy of their celery meals to that lost to SDA, feces, and urate to determine whether lizards experienced a net loss or gain in energy from these meals. Although inherently low in energy and with a relatively high fiber content, the celery meals did generate a net gain in energy for the lizards. While this study seemingly debunks the claim of celery as a “negative calorie” food, three questions remain to be asked: (1) does the cost of celery digestion and the energy lost via excretion for the lizards approximates the equivalent cost and losses for humans?; (2) if not celery, are there other foods that potentially result in a net loss of energy if consumed?; and, (3) if “negative-calorie” foods provide a net gain in energy, to what extent could they contribute to a negative energy budget and weight loss?
Costs and efficiencies of meal digestion and assimilation
The postprandial metabolic response and SDA of the P. vitticeps used in this study are within the range of published increases of 30 – 340% in postprandial metabolism and SDAs equivalent to 5 – 21% of meal energy observed for other lizard species [11]. Humans tend to exhibit a relatively more modest postprandial response noted by a 20-40% increase in metabolic rate with SDAs equivalent to 7-13% of meal energy [11]. However for the 15 female subjects that had each consumed 100 g of celery (67 kJ) in the Clegg and Cooper [3] study, metabolic rates increased by 33% and SDA (57.7 kJ) was equivalent to 86% of ingested meal energy. Although sharing similar profiles of their postprandial metabolic responses, lizards experience a longer duration of the response compared to humans due to consuming relatively larger meals (5% versus 0.17% of body mass) and possessing a lower body temperature and thus requiring more time to digest and assimilate their meals.
In neither this study nor that of Clegg and Cooper [3] was the cost of chewing taken in account, a cost that further reduces the net gain of assimilated energy. For adult humans, the chewing of gum increases metabolic rate by 46 kJ per hour [29]. It took eight women (coauthor AEA and lab students of SMS, mean age of 21.3 years) an average of 5.4 minutes to chew (~400 chews) and swallow 100 g (four intact pieces) of raw celery. Subjects of the Clegg and Cooper [3] study potentially expended an additional 4.1 kJ chewing their 100-g celery meal thus further reducing the net gain (to 7.8% of meal energy) assumed in that study.
The Clegg and Cooper [3] study as well as the numerous discussions on the legitimacy of “negative-calorie” foods have focused only on the cost of digestion and assimilation without considering the efficiency at which these food items are digested. Although humans consume foods that are easily digested and absorbed and unabsorbed components (e.g., fiber) can be acted upon by the resident microbes (e.g., fermentation of residual carbohydrates), there are remnants of the diet that are eventually voided in feces. A traditional approach to quantify the efficiency of digestion (“apparent digestive efficiency”) has been to subtract fecal energy from meal energy and divide by meal energy [30,31]. Taking this one step further and also subtracting the energy lost in urine before dividing by meal energy provides an efficiency index of gained assimilated energy from any meal (“apparent assimilation efficiency”). However, there is an inherent error to this approach because it assumes that all fecal energy is derived from the undigested remnants of the meals, thus the header of “apparent” for these efficiency terms [30,31]. Minus its water content (~75% of fecal mass), human of feces are largely (75% dry mass) composed of bacteria, other microbes (e.g., fungi, virus, protists), and sloughed intestinal epithelial cells [12,32]. What remains after that includes lipids (e.g., bacterial produced short-chain fatty acids) and undigested fiber; therefore, high fiber diets generate more fecal matter due to the accumulation of undigested fiber [12]. Celery is approximately 40% fiber (dry mass) and expectedly for lizards and humans a portion of that fiber is excreted in feces [13].
For a back-of-the-envelope calculation, if we assume that lizard feces (dry mass) is 40% undigested fiber (~ 30% of the ingested fiber) and add to that the energy lost in urate (1.06 kJ) and SDA (2.60 kJ), lizards therefore achieve an assimilated gain of 39.9% of meal energy. This calculated gain is 70% higher than that presented in Results (Table 3), and theoretically could be considered more accurate. For the only human study to assess the cost of celery digestion [3], the projected excreted energy of undigested fiber (8 kJ) combined with SDA (57.7 kJ) and any cost of chewing (4.1 kJ) would theoretically exceed the gross energy of the celery meals (67 kJ), and hence support a “negative-calorie” label to celery (~ minus 3 kJ). However, we should note that this study reports an extremely large SDA relative to meal energy (86%) compared to other human studies (8-12%) [11].
Theoretically, are there negative calorie foods?
An alternative to undertaking empirical studies, similar to our lizard study, is to employ a theoretical approach based on several assumptions to assessing the validity that the most common cited “negative-calorie” foods are as claimed. First, we selected an SDA that is equivalent to 25% of meal energy, a coefficient significantly lower than that noted by Clegg and Cooper [3], however one that is more than twice that reported for human studies, and includes the added cost of chewing [11,29]. Second, we set the energy excreted in urine as 5% of meal energy [30,31,33]. Third, we standardized the energy lost in feces as 30% of ingested fiber energy. For celery and nine other “negative-calorie” foods, consuming 100 g of each generates a net energy gain of approximately 64% of the ingested energy (Table 4). Even if we assume that 100% of meal fiber is lost in feces, which is very unlikely, nearly 49% of the ingested energy is still retained. Changing the parameters further by doubling SDA and urine loss, still results in net gain of about 19%. This budgeting exercise echoes the sentiments of nutritionists, trainers, physicians, and bloggers whom have criticized the labeling of low calorie foods as “negative-calorie” [9,14,16,23].
Table 4. Tabulated for ten commonly listed “negative-calorie” foods is their percent water content, total energy per 100 g, total energy partitioned for carbohydrates, fiber, protein and fat, predicted specific dynamic action (SDA), energy loss in urine and feces, net gain of energy, and net gain as a percent of total ingested energy
Food |
Celery |
Broccoli |
Apple |
Carrot |
Grapefruit |
Tomato |
Cucumber |
Watermelon |
Green leaf lettuce |
Blueberries |
% water |
95.4 |
89.3 |
85.6 |
88.3 |
88.1 |
94.5 |
96.7 |
91.5 |
95.0 |
84.2 |
kJ*/100 g |
71.5 |
182.4 |
254.7 |
195.0 |
207.2 |
92.3 |
55.0 |
149.9 |
81.0 |
281.7 |
Carbs (kJ) |
52.2 |
116.7 |
242.7 |
168.4 |
187.3 |
68.4 |
38.0 |
132.7 |
50.4 |
254.6 |
Fiber (kJ) |
28.2 |
45.8 |
42.3 |
49.3 |
28.2 |
21.1 |
12.3 |
7.1 |
22.9 |
42.3 |
Protein (kJ) |
12.4 |
50.7 |
4.7 |
16.7 |
13.8 |
15.8 |
10.6 |
11.0 |
24.5 |
13.3 |
Fat (kJ) |
6.8 |
14.7 |
6.7 |
9.5 |
5.6 |
7.9 |
6.4 |
6.0 |
6.0 |
13.1 |
SDA (kJ) † |
17.9 |
45.6 |
63.7 |
48.8 |
51.8 |
23.1 |
13.8 |
37.5 |
20.3 |
70.4 |
Loss in urine (kJ)‡ |
3.6 |
9.1 |
12.7 |
9.8 |
10.4 |
4.6 |
2.8 |
7.5 |
4.1 |
14.1 |
Loss in feces (kJ)§ |
8.4 |
13.7 |
12.7 |
14.8 |
8.5 |
6.3 |
3.7 |
2.1 |
6.9 |
12.7 |
Net gain (kJ) |
41.6 |
113.9 |
165.6 |
121.7 |
136.6 |
58.3 |
34.8 |
102.8 |
49.8 |
184.5 |
Net gain % of food kJ |
58.2 |
62.5 |
65.0 |
62.4 |
65.9 |
63.1 |
63.3 |
68.6 |
61.5 |
65.5 |
Source of data for percent water content, energy per 100 g, and energy partitioned for carbohydrates, fiber, protein, and fat is U.S. Department of Agriculture (2018)
*Energy is presented in kilojoules.To convert to kilocalories, divide by 4.18.†SDA was calculated as 25% of meal energy. ‡Urine energy was calculated as 5% of ingested energy. §Energy lost in feces assumes that all ingested sugars, protein, and fat are absorbed and that 30% of fiber energy is lost in feces.
Positive energy gained, negative energy budget
As modeled, “negative-calorie” foods provide a net gain of energy, stemming from the pluses and minuses specific to a meal’s digestion and assimilation. However, this budgeting does not account for any other metabolic expenses (e.g. basal and activity expenditures). The bearded dragons of this study theoretically gain 3.26 kJ from their celery meal over a three-day period during which they expended 9 kJ (assuming a standard metabolic rate of 0.124 kJ hr-1) to fuel their basal metabolism. Hence for those three days, lizards experienced a negative energy budget of nearly 6 kJ (at a minimum) (Figure 2). Bearded dragon enthusiasts would never consider celery as a stable diet, instead feed them higher quality vegetables, greens, and insects [34].
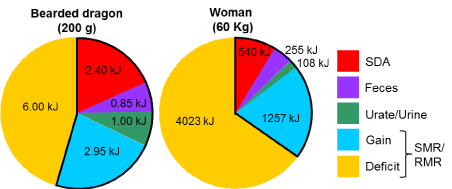
Figure 2. Pie charts illustrating the energy partitioned to SDA, feces, urate/urine, and remaining gain (outlined in black) for raw celery meals equaling in mass to 5% of body mass over a 3-day period for 200-gram bearded dragon and over a 1-day period for a 60-kg woman. The total energy of each chart represents the predicted expenditure on standard metabolic rate (SMR, at 30°C) for the bearded dragon for 3 days and on resting metabolic rate (RMR) for a woman for 1 day. The noted deficit for each is the amount of additional energy needed to fuel SMR or RMR for 3 days and 1 day, respectively, for lizards and women, beyond that gained from the celery meal (deficit+gain = SMR or RMR). Endogenous energy stores (e.g., fat) provide the fuel to cover this deficit
Similarly for humans, any net gain in energy from a “negative-calorie” diet is quickly abolished by the body’s own basal rate of metabolism. The resting metabolic rate of a 60-kg woman is approximately 220 kJ/h [35]. If we apply the assumptions above for the loss to SDA, chewing and excretion, a celery meal of 5% of body mass (3 kg) would only provide the net energy to cover a little less than six hours of her resting metabolism (Figure 2). Cut that time in half if she is active. Another way to look at this is, a 60-kg woman would need to consume daily 9100 kJ or 12.6 kg (~28 lbs) of raw celery, or 9 kg of tomatoes, or 4.3 kg of raw carrots, just to fuel her resting metabolism, certainly not an appealing diet in any case.
The central tenet of most weight loss programs is to achieve a negative energy balance; thereby one’s daily energy expenditure (DEE) exceeds their daily metabolizable energy intake (MEI; meal energy minus energy lost in feces and urine). As empirically demonstrated in this study, there is a net energy gained from a celery meal, and theoretically from other “negative-calorie” foods. However, such foods contribute modestly to daily MEI, and if MEI is unable to match DEE, the deficit is sourced from the catabolism of endogenous energy stores, chiefly fat, resulting in weight loss [1,4,7,8,15,23]. Rather than touting such foods as “negative-calorie” a more accurate label would be “negative-budget”, given the favoring for a daily negative energy budget and weight loss.
All authors contributed to the design of the project, K.M.B. and A.E.A. conducted the majority of data collecting and tabulation, S.M.S analyzed data and performed statistical analyses, S.M.S wrote the initial draft of the manuscript, with edits provided by K.M.B. and A.E.A. The final version was approved by all authors and all authors agree to act as guarantor of the published work.
This study was conceived following the introduction of the concept of negative calorie foods to the senior author by his son (a sophomore and English major at the time) who proposed to conduct a human study with his friends. However, when it was explained to him the additional need to collect, dry, and determine the energy content by bomb calorimetry of his friend’s feces, he declined. For assistance with this study, we thank Mimi Bach, Kellen Cowen, Tori Fields, Georgia Gamble, Ayla Jones, Mackenzie Kyler, Alexis McGraw, Zoe Nichols, Anna Reding, and Amanda Shoemaker. The authors declare that there are no conflicts of interest.
This work was supported in part by a grant (IOS-0466139) from the National Science Foundation to S.M.S.
The authors declare that there are no competing interests.
- Barnard N (2016) Foods that cause you to lose weight, the negative calorie effect. William Morrow, New York, NY.
- Boldt A (2017) What is the negative calorie diet? [online] 20 October. Available at https://www.workingmother.com/momlife/13527533/what-is-the-negative-calorie-diet/.
- Clegg ME, Cooper C (2012) Exploring the myth: Does eating celery result in negative energy balance? Proc Nutr Soc 71: E217.
- Dispirito R (2016) The negative calorie diet. Harper Collins, New York, NY.
- O’Connor A (2006) The claim: some foods have negative calories [online] 25 July. Available at https://www.nytimes.com/20006/07/25/health/25real.html [Accessed 3 March 2019].
- Wilson C (2016) “Negative-calorie foods” still count [online] 26 August. Available at https://www.eatright.org/health/weight-loss/fad-diets/negative-calorie-foods-still-count [Accessed 3 March 2019).
- Biswas C (2018) Negative calorie foods - what are they, how they work, and benefits [online] 13 November. Available at https://www.stylecraze.com/articles/negative-calorie-foods-list/#gref [Accessed 3 March 2019].
- Sengupta S (2018) Negative calorie foods: you can eat these 11 foods & not gain weight [online] 26 March. Available at https://food.ndtv.com/food-drinks/11-foods-that-burn-more-calories-than-they-contain-1679965 [Accessed 3 March 2019].
- Langer A (2017) Negative calorie foods don’t exist, so forget that nonsense and get on with your life [online] 8 August. Available at https://abbylangernutrition.com/diet-review-negative-calorie-foods-dont-exist-forget-nonsense-get-life/ [Accessed 3 March 2019].
- Nelson J (2015) Do negative-calorie foods really exist? [online] 9 June. Available at https://mnn.com/food/healthy-eating/stories/do-negative-calorie-foods-really-exist [Accessed 3 March 2019].
- Secor SM (2009) Specific dynamic action, a review of the postprandial metabolic response. J Comp Physiol 179: 1-56.
- Rose C, Parker A, Jefferson B, Cartmell E (2015) The characterization of feces and urine: A review of the literature to inform advanced treatment technology. Crit Rev Environ Sci Tech 45: 1827-1879.
- U.S. Department of Agriculture, Agricultural Research Service. 2018. USDA National Nutrient Database. Nutrient Data Laboratory [online]. Available from http://ndb.nal.usda.gov.
- Dunning B (2012) Negative calorie food myths [online] 7 August. Available at: https://skeptoid.com/episodes/4322 [Accessed 3 March 2019].
- Lall A (2018) 7 'negative-calorie' foods that help you stay satisfied while dieting [online] 16 Auguts. Available at https://www.firstforwomen.com/posts/negative-calorie-foods-164691 [Accessed 3 March 2019].
- Pike A (2016) Mythbuster: negative calorie foods [online] 11 October. Available at https://www.foodinsight.org/myth-zero-calorie-foods [Accessed 3 March 2019].
- Cogger HG (2014) Reptiles and Amphibians of Australia. 7th ed. CSIRO Publishing, Clayton, Australia.
- Hernandez RA, Secor SM, Espinoza RE (2005) Is a dietary jack of all trades a master of none? Adaptability of gut form and function in an omnivorous lizard. Integr Comp Biol 45: 1011.
- Oonincx DG, van Leeuwan JP, Hendriks WH, van der Poel AFB (2015) The diet of free-roaming Australian central bearded dragons (Pogona vitticeps). Zoo Biol 34: 271-277.
- Wilson S (2013) Australian lizards: A natural history. CSIRO Publishing, Clayton, Australia.
- Alexander AE, Buddemeyer KM, Secor SM (2015) Testing the cooking hypothesis in human evolution. Integr Comp Biol 55: e212.
- Wrangham R (2009) Catching fire: How cooking made us human. Basic Books, New York, New York.
- Dunford L (2018) Negative calorie foods are a myth - here’s why [online] 22 August. Available at https://www.independent.co.uk/life-style/food-and-drink/calorie-foods-counter-myth-healthy-eating-weight-loss-negative-a8500021.html [Accessed 3 March 2019].
- Crocker-Buta SP, Secor SM (2014) Determinants and repeatability of the specific dynamic action of the corn snake, Pantherophis guttatus. Comp Biochem Physiol 169A: 60-69.
- Secor SM, Diamond J (1997) Determinants of post-feeding metabolic response in Burmese pythons (Python molurus). Physiol Zool 70: 202-212.
- Vleck D (1987) Measurement of O2 consumption, CO2 production, and water vapor production in a closed system.J Appl Physiol (1985)62: 2103-2106. [crossref]
- Bessler SM, Stubblefield MC, Ultsch GR, Secor SM (2010). Determinants and modeling of specific dynamic action for the garter snake, Thamnophis sirtalis. Can J Zool 88: 808-820.
- Gessaman JA, Nagy KA (1988) Energy metabolism: errors in gas-exchange conversion factors. Physiol Zool 61: 507-513.
- Levine J, Baukol P, Pavlidis I (1999) The energy expended in chewing gum.N Engl J Med341: 2100.
- Cox CL, Secor SM (2007) Effects of meals size, clutch, and metabolism on the energy efficiencies of juvenile Burmese pythons, Python molurus. Comp Biochem Physiol 148A: 861-868. [crossref]
- McConnachie S, Alexander GJ (2004) The effect of temperature on digestive and assimilation efficiency, gut passage time and appetite in an ambush foraging lizard, Cordylus melanotus melanotus. J Comp Physiol B 174: 99-105.
- Bojanova DP, Bordenstein SR (2016) Fecal Transplants: What Is Being Transferred?PLoS Biol14: e1002503. [crossref]
- Brody S (1945) Bioenergetics and Growth. Hafner, New York, NY.
- de Vosjoil P, Sommella TM, Mailloux R, Donoghue S, Klingenberg R, Cole J (2016) The bearded dragon manual: Expert advice for keeping and caring for a healthy bearded dragon. Companion House Books, East Petersburg, Pennsylvania.
- Siervo M, Boschi V, Falconi C (2003) Which REE prediction equation should we use in normal-weight, overweight and obese women?Clin Nutr22: 193-204. [crossref]