Abstract
Background and Aim: A metabolic “hypo-methylation” is associated with elevated plasma levels of homocysteine. This hyperhomocysteinemia has been connected with various lifestyle diseases like cancer, cardiovascular diseases or stroke which originates in reduced methylation processes. Often, an increased homocysteine content (tHcy) is correlated with B vitamin deficiencies.
The present study investigates whether a B (multi)vitamin supplementation at almost physiological concentrations is able to reduce blood homocysteine levels. Additionally, the effect of plant-based (N) food supplements will be compared with synthetic (S) ones.
Methods: In a double-blind randomized clinical trial 30 healthy subjects were randomly allocated to either group N or to group S. For a period of six weeks, a B vitamin preparation was taken daily. Subject serum was analyzed at three different times: T1 (baseline), T2 (after the six-week supplementation period) and T3 (after the subsequent two-week wash-out phase). Blood samples were determined for their pyridoxine (B6), folate (B9), cobalamin (B12) and homocysteine content.
Results: In both groups vitamin levels were increased after T2 (B6: Nà+101%, Sà+101%; B9: Nà+86%, Sà+153%; B12: Nà+16%, Sà+15%). Simultaneously, tHcy was reduced in both groups (Nà−13%; Sà−32%). However, a significant decrease was only observed in group N (p < 0.05). Even after T3, tHcy remained at a low level (Nà−11%; Sà−29%), but again the difference was only significant in group N.
Conclusions: Primary outcome of the study was that B vitamin supplementation, even in low concentrations, can lower homocysteine levels. The comparative bioavailability of natural and synthetic B vitamins showed no statistically relevant differences between the groups. Nevertheless, some positive trends in the group of the plant-based supplement could be shown.
Keywords
homocysteine, B vitamins, supplementation, pyridoxine, folate, cobalamin, methylation pathway.
Introduction
Methylations are central biochemical metabolism processes within the scope of energetic, regenerative, eliminating and epigenetic processes. Methylations are indispensable for haem synthesis (endogenic synthesis of the respiratory chain cytochromes, catalases, cyclooxygenases, cytochrome P450, hemo- and myoglobins), for DNA and RNA synthesis, for the synthesis of cellular biomembranes, as well as histone modelling in the DNA [1-5]. These methylations are catalyzed mainly through methyl transferases. The main co-factors of these enzymes are vitamin B6, folic acid and vitamin B12. Homocysteine as a non-proteinogenic amino acid is an intermediate metabolite of the methionine and cysteine metabolism. Homocysteine, when catalyzed via folic acid and vitamin B12, is methylated into methionine or, depending on vitamin B6, demethylated to cysteine [6] (Figure 1).
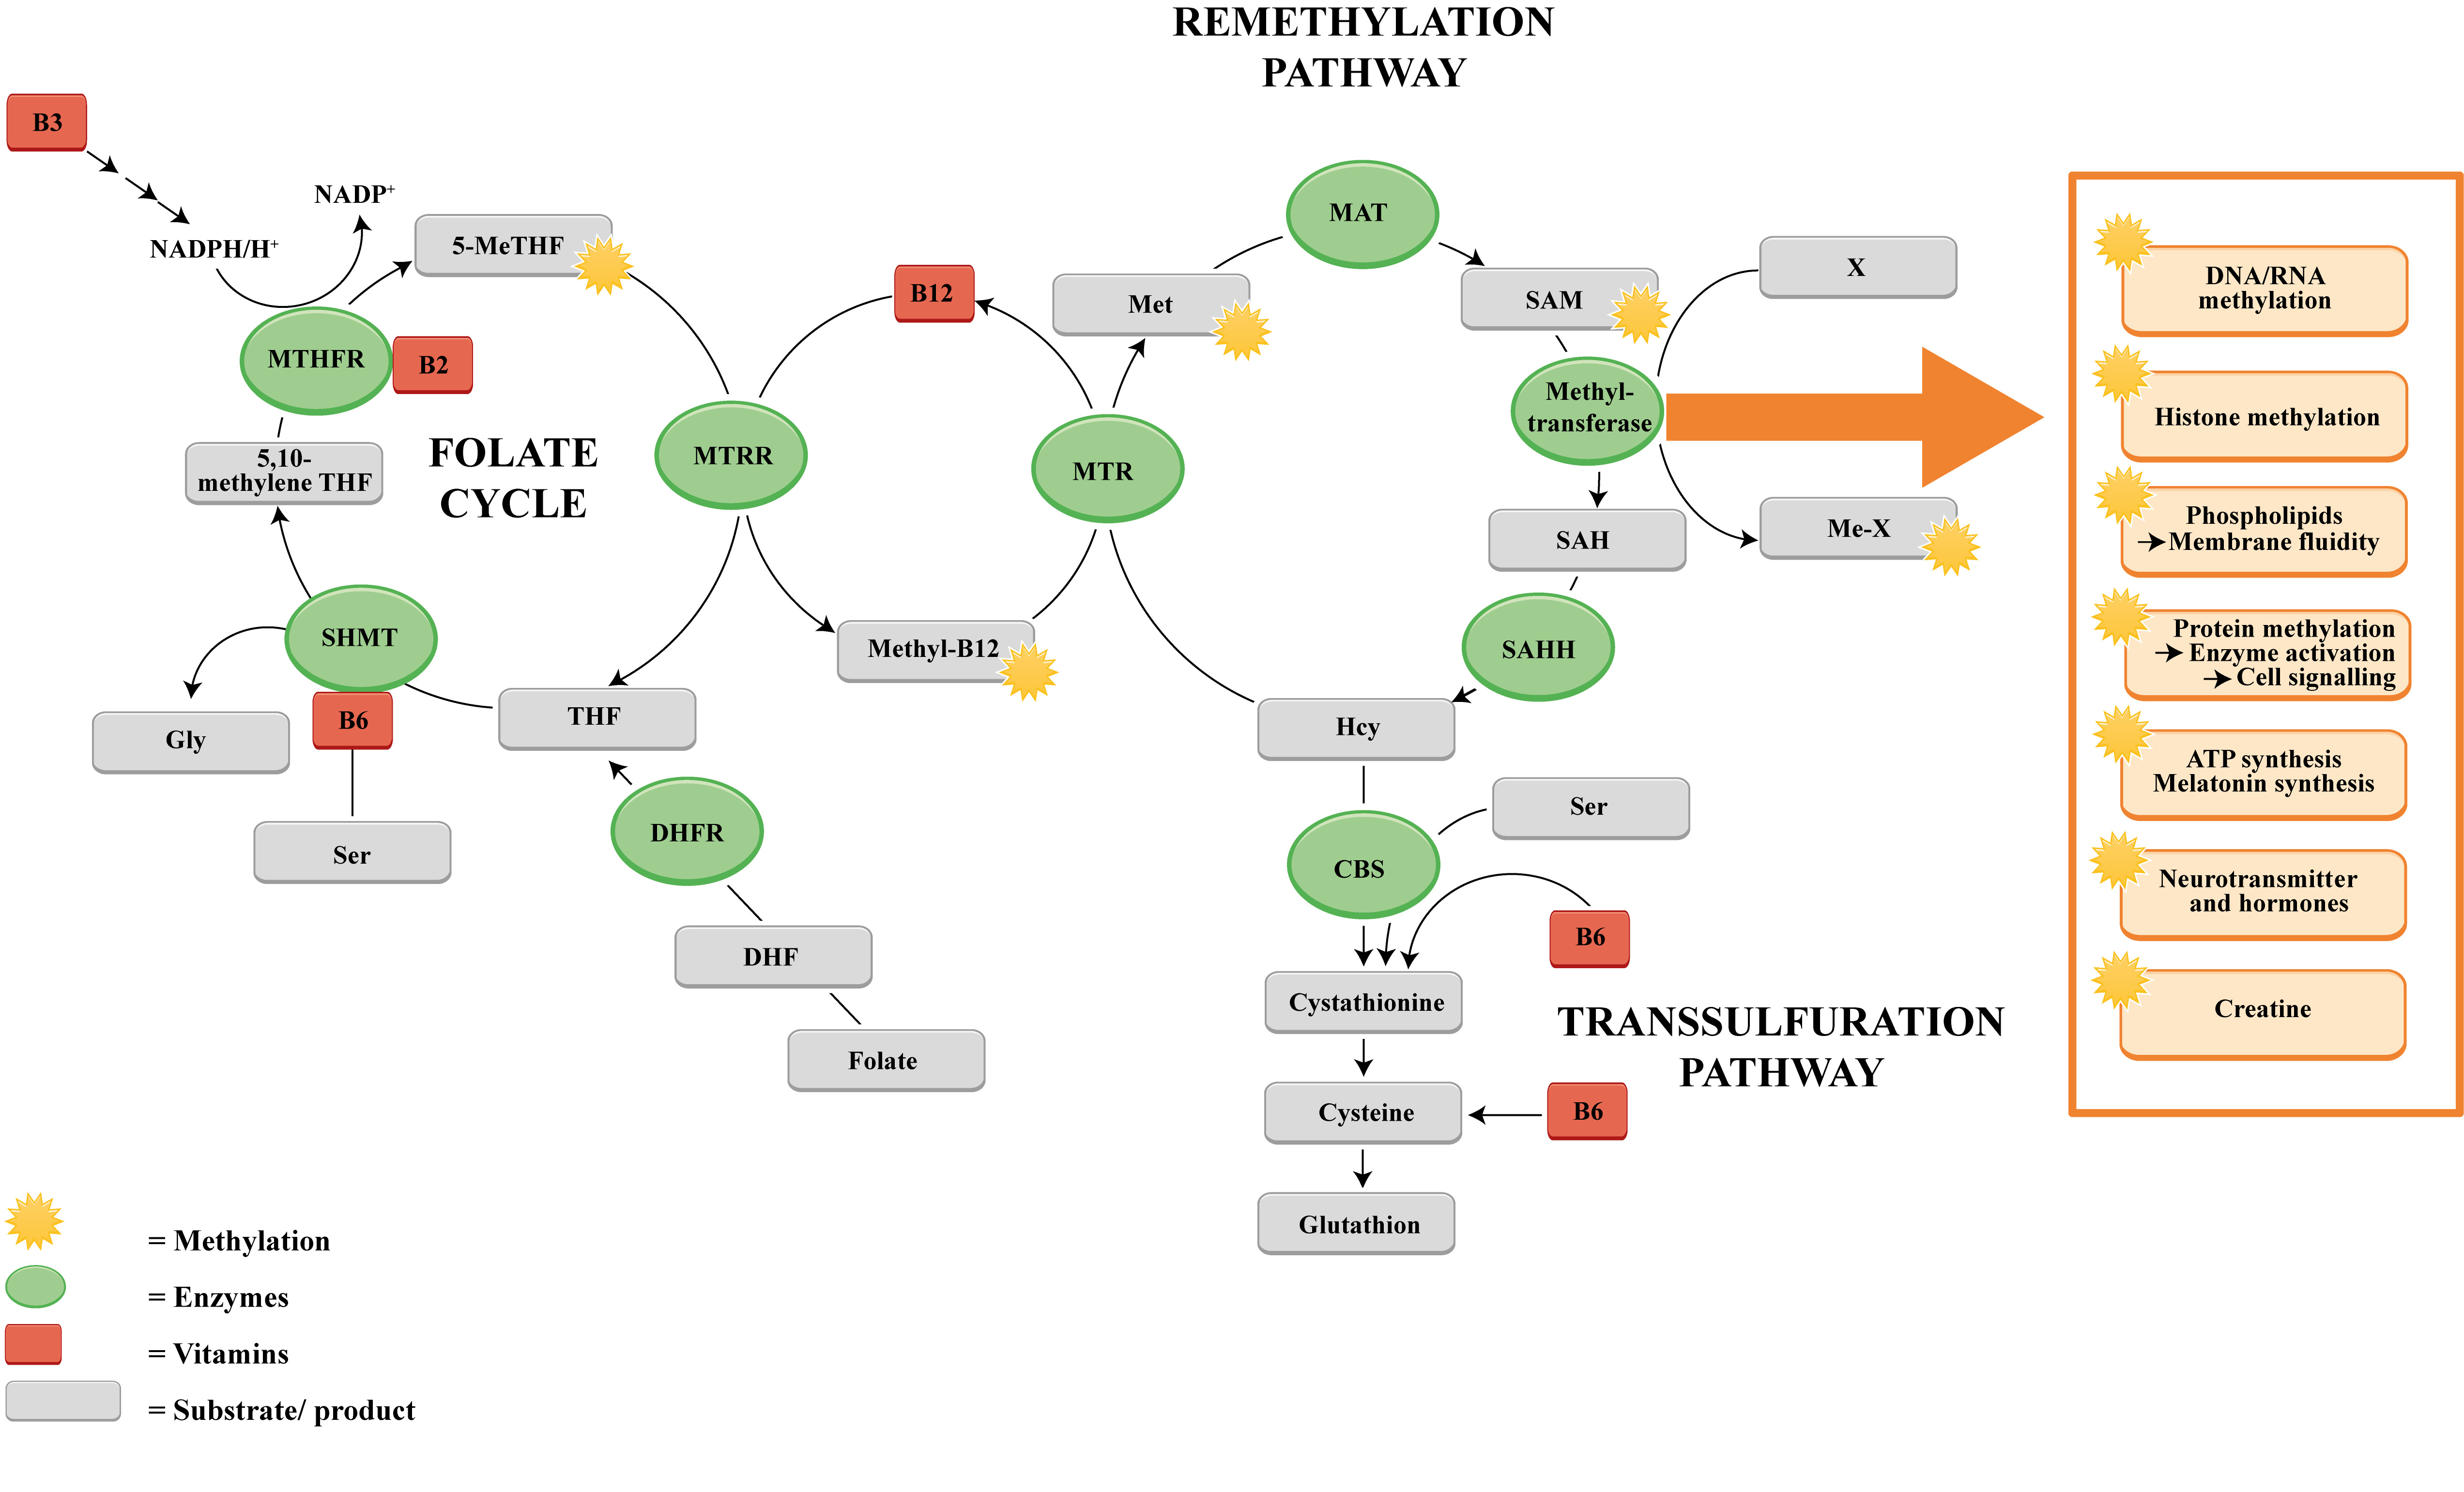
Figure 1: The methylation pathway and the role of certain B vitamins in the one-carbon transport.
Dietary folate (vitamin B9) is primarily converted into dihydrofolate (DHF) and subsequently reduced into tetrahydrofolate (THF) by the enzyme dihydrofolate reductase (DHFR). Afterwards THF is further converted into 5,10-methyleneTHF by the enzyme serine hydroxymethyltransferase (SHMT). This reaction is accompanied by the hydroxylation of serine to glycine, which requires vitamin B6 as a cofactor. 5,10-methyleneTHF is then reduced to 5-methyltetrahydrofolate (5-MeTHF) in a NADPH/H+-consuming reaction with the involvement of methylenetetrahydrofolate reductase (MTHFR) using B2 as a cofactor. The gained methyl group is transferred to cobalamin (vitamin B12) by the enzyme methioninesynthase reductase (MTRR) which generates methylcobalamin (Methyl-B12). Homocysteine is regenerated to methionine by receiving one methyl group. The enzyme methionine synthase (MTR) catalyzes this reaction, which requires the methylated form of vitamin B12 (methylcobalamin). Methionine is further converted into the universal methyl donor S-adenosylmethionine (SAM) by methyladenosyl transferase 2A (MAT) which enables SAM to serve as a substrate used by diverse groups of methyltransferases specific for RNA, and DNA methylation processes, histone and protein methylations, membrane and ATP synthesis and many more. In the presence of methyltransferase SAM is demethylated into S-adenosylhomocysteine (SAH) that is further hydrolysed by S-adenosylhomocysteine hydrolase (SAHH) to build homocysteine (Hcy). In the transsulfuration pathway Hcy is catalyzed by cystathionine beta synthase (CBS) and vitamin B6 into cystathionine and further into cysteine, a precursor for glutathione.
Whilst homocysteine plasma levels < 10 µmol/L are considered to be physiological, higher levels are associated with apparently heterogeneous risk factors and disorders, such as atherosclerosis, endothelial dysfunction and vascular disease, increased risk of thrombosis, apoplexy and infarction, Alzheimer’s disease, dementia, multiple sclerosis, glaucoma/age-related macular degeneration (AMD), and also osteoporosis [7-16]. Since the intermediate homocysteine is a metabolic hub for the methyl group transfer, alimentary methyl group donors and enzymatic cofactors of methyl group-transferring enzymes, namely the vitamins B6, folic acid and vitamin B12, play a decisive role. The “decomposition” of surplus homocysteine, essentially its metabolization, is thus an indirect parameter for the activity and intensity of methyl group transfer and thus cellular energy, regeneration, elimination and (epi)genetic metabolism. Previous studies were able to illustrate the link between vitamin B deficiency and DNA methylation and have demonstrated the effect of hyperhomocysteinemia on epigenetics which seems to be a crucial reason for the development of many lifestyle diseases [17-25]. Likewise, a DNA hypomethylation can lead to the initiation of transcription, generating transcription of repeats, transposable elements (TEs), and oncogenes which finally can provoke cancer development [26-28]. Similarly, an association of a lower global methylation status with the pathogenesis of cardiovascular diseases and stroke was reported [22,23]. In particular, hypomethylation of LINE-1 has a decisive role [24,25]. However, local hypermethylation processes can also initiate pathogenic processes and hyperhomocysteinemia does not consistently lead to alterations in DNA methylation patterns [6,23].
In accordance with the metabolically central role of the enzymatic cofactors vitamin B6, folic acid and vitamin B12, combinations of these three cofactors are used to lower excessive homocysteine plasma levels [11, 29-33]. However, in most of these combinations the dosages of the three vitamins in various preparations are a multiple (up to one hundred times) of the recommended daily intake. A closer look at the physiology of the homocysteine metabolism shows, that the biochemical methyl group transfer does not only take place at the “vitamin B6/folic acid/vitamin B12” level, but also that these three involved cofactors are themselves subject to a secondary recycling metabolism that is presumably co-decisive for the effectivity of homocysteine metabolization.
The aim of this randomized double-blind study was to evaluate whether a vitamin B complex that also takes recycling effects on the three cofactors into account can already lower the homocysteine level at physiological dosage. A further aim of the study was to objectify whether a synthetic and a plant-based vitamin B complex have different impacts on the homocysteine level.
Materials and methods
Trial Design
The influence of plant-derived (N) and synthetic (S) vitamin B complexes on homocysteine levels was evaluated in a randomized double-blind study. The study site was the Institute of Nutrition and Metabolic Diseases (Laßnitzhöhe, Austria). The trial is based on data from a study conducted between May and October 2017. The population included a total of 30 healthy subjects: 22 women and 8 men aged 18 to 64 years (group N: 37.71 ± 3.72 a, group S: 37.87 ± 3.64 a) with a body mass index of 22.49 ± 0.57 (group N) and 22.35 ± 0.75 (group S), respectively, participated in the trial. Exclusion criteria were defined as low compliance, pregnancy and lactation, cholesterol levels > 240 mg/dL, supplementation of vitamins, trace elements, fatty acids, or participation in other clinical trials within the last 3 months before study entry. Likewise, a vegan diet, impaired renal and/or hepatic function, and known chronic diseases (cardiovascular, oncological, psychological, physiological, and chronic inflammatory, autoimmune) were defined as exclusion criteria.
The enrolment of the participants followed an invitation to tender by the Institute of Nutrition and Metabolic Diseases (Laßnitzhöhe, Austria). 36 persons were recruited for the study. However, 6 participants had excluded because they did not meet the inclusion criteria. A three-week "run-in phase" ensured that nutritive influences on baseline measurements were minimized. Subjects received standardized dietary plans, according to criteria on light whole foods. In addition, regular exercise sessions were advised. Subsequently, subjects were randomized using a validated system and thereby assigned to either group N (supplemented with natural vitamins) or to group S (supplemented with synthetic vitamins) [34]. The ratio of the allocation to the treatment groups was 1:1 and was generated randomly. 11 men (78.6%) and 3 women (21.4%) were allocated to group N and group S contained 10 men (66.7%) and 5 women (33.3%). Since the study was blinded, participants, study staff and the outcome assessors were not aware of which treatment group participants were allocated to.
Appropriate supplement packages for the period of 42 days (3 capsules/d) were provided to the subjects. The two test preparations (N, S) were offered in form of capsule products with identical appearance (white hydroxypropyl methylcellulose capsules of size 0). The compositions of natural B vitamins, provided by vis vitalis gmbh (LOT-Nr. L17050077, PANMOL® B-COMPLEX, Salzburg, Austria) and synthetic B vitamins (LOT-Nr. 17050078), mixed by vis vitalis gmbh, were absolutely identical. Plant-based vitamins derived from germinating quinoa sprouts (Chenopodium quinoa Willd.) and were offered as encapsulated powder. More details are provided in Table 1.
Table 1: Origin and content of the vitamins.
The points in time for clinical surveys in form of blood samples (approximately 20 mL each) were set as immediately anterior to the first supplementation treatment (T1), after completion of the six-week supplementation period (T2) and after a two-week washout phase (T3, 8 weeks after T1). Blood was collected by venipuncture while the subject was in a sitting position in the morning after fasting.
Measuring method
For the determination of the serum vitamin B6 content an HPLC reagent kit from Recipe Chemicals and Instruments GmbH (Munich, Germany) was used. This kit enables the measurement of pyridoxal-5’-phosphate (PLP), the metabolic active form of vitamin B6. After preliminary serum derivatization, fluorescence of 50 µL aliquots was measured.
Plasma folate (vitamin B9) was quantified using a chemiluminescent microparticle folate-binding protein assay (Architect® folate assay, Abbott Laboratories, Abbott Park, USA) following the manuals instructions [35].
Quantification of active cobalamin (vitamin B12) was performed by means of a chemiluminescent microparticle intrinsic factor assay (Architect® B12 assay, Abbott Laboratories, Wiesbaden, Germany). All steps were performed strictly according to the instructions of the manufacturer [36].
Total L-homocysteine levels (tHCy) in plasma and serum were determined by a single-step immunoassay reagent kit (Architect Homocysteine® Assay, Abbott GmbH & Co KG) following the operating instructions published elsewhere [37].
Quantification of HPLC detected compounds
Serum samples from patients were collected in sample tubes containing the anticoagulant EDTA. 100 µL of the serum was mixed with 100 µL of precipitant P® from Recipe Chemicals and Instruments GmbH (Munich, Germany) and centrifuged for 5 min at 10000 x g. 50 μl of the supernatant was injected into the HPLC system. Mobile phase A, guard column and analytical column were components of the ClinRep® Chromatography Kit. The temperature of the column heater was set to 25°C. Before injection of the sample, the analytical coloumn was equilibrated with 15 mL of the Mobile phase A. The flow rate was 1.0 mL/min throughout. 50 µL of the serum sample were applied to the system. The run was executed isocratically with Mobile phase A. In order to enhance the fluorescence yield, reagent N® (Recipe Chemicals and Instruments GmbH, Munich, Germany) was merged with Mobile phase A® behind the analytical column. For this, a T-union was installed in the capillary between the analytical column and the fluorescence detector. Detection of PLP was conducted with a fluorescence detector (HPLC-FD). The excitation wavelength was 370 nm and the emission wavelength was 470 nm. The injection interval was 10 min [38].
Statistical analysis
Data sets of metric variables were tested for normal distribution using Kolmogorov-Smirnov test with Lilliefors significance correction (α = 10%). Group comparisons of normally distributed data sets were conducted using t-test for independent samples (test for variance homogeneity: Levene's test, α = 5%). A one-way ANOVA was performed to prove the integrity of the t-test analysis. Comparisons of data sets of continuous variables without normal distribution were performed using Mann-Whitney U test.
The conciseness of the progression of vitamin and biomarker blood concentrations within groups was evidenced by two-sided 95% confidence intervals of differences between two studies. The use of the term "significant" refers to a local p value < 0.05, but not a probability of error below 5%. Analyses were performed using the open source software R, version 3.4.1 (The R Foundation for Statistical Computing, Vienna, Austria).
Results
The subject pool comprised 30 participants approximately balanced for age, sex and race. The collective showed also no significant differences in baseline values with respect to B vitamin and homocysteine levels. The individuals were randomized equally into the two test groups N and S. The 15 subjects of group N received plant-derived B vitamins whereas the 15 subjects in group S were administered synthetic preparations. Only one subject (group N) had excluded from the trial due to an intolerance reaction to the supplement (flush).
Target of the study was to investigate the influence of the B vitamin complex (N and S) on blood homocysteine levels. Instead of only recording the three usual homocysteine-lowering vitamins B6, B9 and B12, special attention was paid to the influence of the holistic vitamin B complex.
Vitamin B6 (B6)
Serum PLP levels increased equally with supplementation in both groups (N: +101%, S: +101%).
During the washout period (T3), serum levels decreased again and reached almost baseline conditions (N: +26%, S: +11% compared to T1). After T3, a significant difference compared to T1 was not apparent (Figure 2).
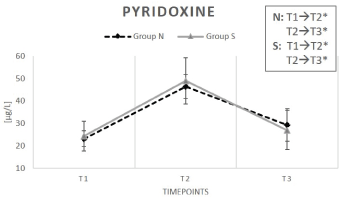
Figure 2: Change in serum pyridoxine (vitamin B6) content under supplementation of natural (N) and synthetic (S) B-vitamins over a period of 6 weeks plus a 2-week washout phase.
Results for group N are depicted by a dashed line. The continuous line represents group S. Data are indicated as mean value ± standard error of the mean (n=15). (*) illustrates a significant deviation (p < 0.05). T1 equates baseline values (immediately before the first intake of the test preparations); T2 stands for values after 6 weeks (end of the supplementation period) and T3 represents values after 8 weeks (washout period).
Vitamin B9 (B9)
Baseline serum B9 values (T1) were similar among all participants at the commencement of the trial (Figure 3). At the end of the supplementation period T2, there was a significant increase in B9 levels in both groups (N: +86%; S: +153%) (p < 0.05). Following the washout phase (T3), the decrease of folic acid levels was again significant in both groups. However, the values after T3 were still considerably elevated compared to the folic acid baseline conditions (N: +48%; S: +74%) (Table 2).
Table 2: Mean values ± standard error of the serum concentration for pyridoxine, folic acid, cobalamin and total homocysteine content at different times for group N (natural food supplements) and group S (synthetical food supplements). The trend (baseline values were set to 100%) is displayed below every measured substance.

Figure 3: Change in folic acid content (vitamin B9) content under supplementation of natural (N) and synthetic (S) B-vitamins over a period of 6 weeks plus a 2-week washout phase.
Results for group N were depicted by a dashed line. The solid line represents group S. Data are reported as mean value ± standard error of the mean (n=15). Significant deviations are demonstrated by (*) (p < 0.05). T1 represents baseline values (prior to the first intake of the test preparations); T2 demonstrates values after 6 weeks (termination of the supplementation period); T3 equates values after 8 weeks (washout period).
Vitamin B12 (B12)
Cobalamin gradient is depicted in Figure 4. In both groups B12 levels were increased after the supplementation phase (T2) (N: +16%; S: +15%), but changes were only significant for group N (p < 0.05). After the washout phase (T3), serum levels decreased again in both groups. However, it is worth mentioning, that cobalamin T3-values of group N were still significantly elevated compared to initial values at T1 (N: +9%; S: +2%) (Table 2).
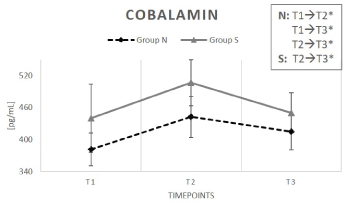
Figure 4: Serum cobalamin content (vitamin B12) content while taking either natural (N) or synthetic vitamin preparations (S).
Results were shown as a dashed line for group N. The continuous line represents group S. Data are reported as mean value ± standard error of the mean (n=15). Significant deviations are demonstrated by (*) (p < 0.05). T1 equates baseline values (subsequent to the supplementation period); T2 are values after 6 weeks (end of the supplementation period); T3 represents values after 8 weeks (after the two-week washout period).
A comparable bioavailability of natural and synthetic B vitamins could be seen, but no statistically significant differences between the two groups at any timepoint were recorded.
Homocysteine
Figure 5 illustrates the total homocysteine concentrations (tHcy) for both, group N and group S. A decline of tHcy was notable in both groups. However, only serum tHcy of subjects in group N showed a significant decrease at the end of T2 (−13%), quite contrary to group S, where tHcy reduction did not reach significance (−32%). After the washout period (T3), tHcy remained low in both groups compared to baseline conditions, but again the tHcy content compared to baseline values was only significant in group N (−11%) and could not be proven in the group with synthetic vitamins (−29%) (Table 2).
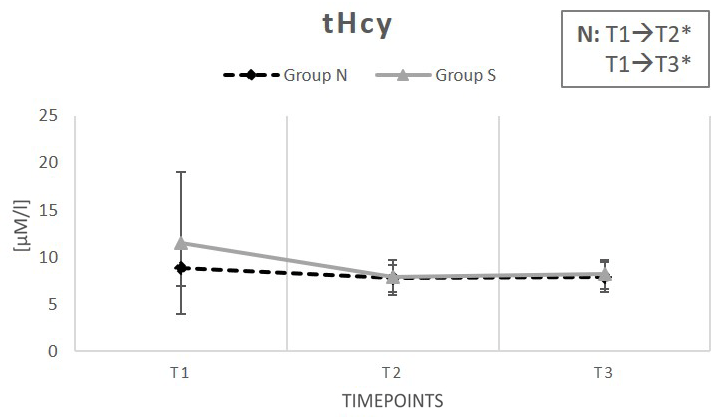
Figure 5: Change in total homocysteine level under supplementation of natural (N) and synthetic (S) B-vitamins over a period of 6 weeks plus a 2-week washout phase.
Results for group N are indicated by a dashed line. The continuous line represents group S. Data are reported as mean value ± standard error of the mean (n=15). Significant deviations are demonstrated by (*) (p < 0.05). T1 are baseline values (prior to the supplementation period); T2 equates values after 6 weeks (end of the supplementation period); T3 stands for values after 8 weeks (following the washout period).
Discussion
One goal of this double-blind randomized pilot study was to investigate whether a diurnal intake of a low-dose-vitamin B complex has an impact on the metabolic pathways and, therefore, was able to reduce homocysteine levels.
High-dose administration of the vitamin combination of B6, B9, and B12 to lower elevated homocysteine levels has been common practice for decades. Previous studies focused on the supplementation of high dosages, often corresponding to a multiple of the recommended daily intakes [29,39]. This is now contrasted by the present trial, which investigates the effect of a B vitamin complex in an almost physiological dosage. Indeed, in these comparatively low intake concentrations, a clearly measurable effect on metabolic parameters was apparent: The results confirmed that the supplement was successful in increasing vitamin B levels (B6, folic acid, B12) for both groups (N and S). At T2, a significant increase in all measured vitamin levels (B6, folic acid and B12) was observed. Subjects` mean baseline values (T1) for PLP were within the normal range (N: 23.11 µg/L; S: 24.31 µg/L). In both test groups serum PLP level had doubled after T2 (N: 46.44 µg/L; S: 38.94 µg/L), but, due to its water-soluble character, was washed out to a large extent after T2 and enrichment did not occur (value at T3) in either of the two experimental groups. Thus, in order to maintain high serum values, a continuous vitamin B6 supply is necessary. PLP was detected by means of a HPLC method. In order to increase the fluorescent yield, the sample was mixed with reagent N®, the composition of which is a trade secret. From previous methodological comparisons can be inferred that results from PLP measurements by HPLC were assimilable and independent from sample preparation, chromatographic separation schemes, and PLP derivatization and therefore the choice of HPLC methodology is less important. The results are consequently conclusive [40]. Folic acid content also increased substantially: In both groups a significant upsurge could be observed at T2 (N: 13.86 ng/mL; S: 15.18 ng/mL). This increase remained significant compared to the initial values even after the two-week wash-out phase. Already in 2002 Stanger et al. observed an increase in blood folic acid levels associated with reduced tHcy blood levels by a 6-week supplementation of 5 mg of folic acid which improved resistance vessel reactivity in patients with coronary artery disease [41]. The present study showed a cobalamin level enrichment after T2 (N: +16%; S: +15%). These findings are consistent with previous studies: For instance, Ford, et al. (2018) observed an increase in the pyridoxine and cobalamin blood levels after a supplementation with the vitamin complex consisting of vitamin B6, folic acid, and vitamin B12 [29]. Smith, et al. (2010) also recognized increased blood levels of folate and vitamin B12 after supplementation of 0.8 mg folic acid, 0.5 mg cyanocobalamin and 20 mg pyridoxine HCl which appears to slow the acceleration of brain atrophy in mild cognitive impairment [42]. However, cobalamin increase was only significant in group N and even remained significant until T3. These increased serum vitamin levels were effective in reducing tHcy values.
But, why are these low-dosage vitamin preparations successful in lowering tHcy level? The vitamins are not administered as single-vitamins, but in form of a multi-vitamin B complex (see Table 1). This raises the question whether the vitamins of the B complex in their entirety would be more effective than individual representatives of this vitamin family. Their synergistic action in this complex seems to have a positive effect on the one-carbon-transfer reactions, also on degradation of tHcy as demonstrated in this study. It is commonly known that vitamin B6, folate and vitamin B12 play an important role for the degradation process of homocysteine [39]. Vitamin B6, naturally appearing as pyridoxine, pyridoxal, and pyridoxamine, serves as a coenzyme for more than 100 enzymes, mostly related to amino acid and carbohydrate biosynthesis and catabolism, but is also involved in lipid metabolism and other physiological functions like neurotransmitter synthesis [43]. In the one-carbon metabolism, vitamin B6 is required as a cofactor for the enzyme serine hydroxy methyl transferase (SHMT), which catalyzes the simultaneous conversions of serine to glycine and tetrahydrofolate (THF) to 5,10-methylenetetrahydrofolate [44]. Moreover, in the transulfuration pathway the two vitamin B6-dependent enzymes cystathionine β synthase and cystathionine γ lyase are required to convert homocysteine into cysteine. Vitamin B12, in the methylated form, serves as a methyl donor in order to regenerate Hcy. Prior to this, B12 must be methylated itself. This proceeds via the enzyme methionine synthase reductase (MTRR), which catalyzes the reaction of 5 methyl tetrahydrofolate (5 MeTHF) to THF, and transfers one methyl group to B12. Therefore, the blood tHcy level is substantially dependent on the nutritional status of at least the three B vitamins folate, vitamin B12, and vitamin B6.
But further B vitamins are also (indirectly) essential for homocysteine degradation: Vitamin B2, for instance, is present in the reaction of 5,10-methyleneTHF into 5-methyltetrahydrofolate (5-MeTHF) by methylenetetrahydrofolate reductase (MTHFR).
Vitamin B3 is essential for a range of reactions, due to the fact that NADH is a universal coenzyme, involved in numerous redox reactions. In an extended view, in the homocysteine degradation process, NAD+ is a cofactor of 5,10-methylenetetrahydrofolate reductase (MTHFR), which catalyzes the reduction of 5,10-methyleneTHF into 5-methyltetrahydrofolate [45]. Another NAD+-dependent reaction of the homocysteine degradation pathway is the reduction of dihydrofolate (DHF) by the enzyme dihydrofolate reductase (DHFR) yielding NAD(P)+ and tetrahydrofolate (THF) [46]. Finally, the presence of vitamin B5, which is the key precursor for the biosynthesis of coenzyme A (CoA), a universal and essential cofactor involved in a myriad of metabolic reactions, is decisive for a proper functioning of multiple metabolic processes [47].
To conclude, B vitamins are involved in multiple methylation, demethylation, and remethylation reactions which aftereffects regeneration and DNA methylation [6,22]. The lack of only one single component may negatively affect the degradation of Hcy. Finally, these data provide preliminary evidence that vitamin B supplementation, provided in form of a complex, is efficient to lower tHcy blood levels. This finding is striking, since high-dose vitamin preparations are able to provoke adverse reactions [48]. Therefore, it is not the dosage that plays the decisive role, but the complexity of the composition of the vitamin additives.
However, a significant tHcy decrease was only perceptible in group N. The reduction was only −13% in contrast to group S, where the tHcy reduction reached −32% without being significant. This result in group S was attributable to the large standard deviation at baseline. Vitamin B6, folic acid and cobalamin, essential for tHcy metabolism, tended to exhibit longer retention times in the organism compared to their synthetic counterparts. The decline at T3 compared to T2 was 37% for vitamin B6, 20% for folic acid and 6% for vitamin B12 in group N compared to 45% (B6), 31% (folic acid) and 11% (B12), respectively, for its manufactured counterparts. This pilot study showed a comparable bioavailability for both natural and synthetic B vitamins but did not show statistically significant differences between groups despite some favourable tendencies within the natural vitamin group, i.e. sustained effects for folic acid, vitamin B6 and cobalamin. This suggests a stronger impact on enzymatic activities of plant-derived vitamin complexes and, in turn, that these vitamers deriving from a natural environment offer a more beneficial impact to the human metabolism. The natural vitamins are provided as dried quinoa sprout powder, not as an extract. In addition to the determined and analyzed vitamins, sprouted seeds also contain numerous secondary plant substances, which by themselves can influence the metabolism of the natural B vitamins. Therefore, the vitamin B complex in its natural matrix may provide an auxiliary benefit.
Moreover, botanical vitamins in their natural form rarely emerge in one single form. They possess a higher range of chemically modified derivatives, and, in this respect, they appear in a broader variety in contrast to their synthetic counterparts [49].
For instance, vitamin B6 occurs in six chemically related compounds: pyridoxine, pyridoxal, pyridoxamine, pyridoxine 5'-phosphate, pyridoxal 5'-phosphate and pyridoxamine 5'-phosphate which act as coenzymes in over 180 enzymatic reactions like lipid, glycogen, and amino acid metabolism [50,51].
Folate is the naturally occurring form of vitamin B9 and appears in form of related compounds with similar nutritional properties. Most of them are converted into 5-methyltetrahydrofolate (5-MeTHF) in the digestive system before entering the bloodstream [52]. The synthetically produced variant is folic acid (pteroylglutamic acid). Dietary folic acid appears predominantly in form of polyglutamates, and for absorption it must be hydrolyzed into the monoglutamate analogue beforehand. Unlike folate, not all of the consumed folic acid is converted into the active form 5-MeTHF in the digestive system, but needs other tissues like the liver for 5-MeTHF synthesis [53].
Vitamin B12 exists in form of cyanocobalamin, methylcobalamin, hydroxycobalamin and adenosylcobalamin. Due to differences in affinity for the blood-transport binding proteins, cell receptors for B12 uptake, and intracellular enzymes involved in their conversion to intracellular cobalamin, these derivatives differ in their bioavailability [54]. Possibly, this diversity of the essential substances is the reason why the natural vitamin B complex tended to have a stronger metabolic impact.
Hence, the intake of one-carbon-related nutrients, essential for a range of biological processes, causes reduction of tHcy which, in turn, effects DNA methylation. Previous studies showed that infant DNA methylation at several putative metastable epialleles could be improved by optimizing maternal methylation through the reduction of tHcy [55]. Also, the initiation of diseases like cancer, cardiovascular diseases or stroke might be affected by the global methylation level [22-26]. The methylation status of the metabolism affects epigenetics in terms of DNA methylation and histone modification. A previous study supported the linkage between hyperhomocysteinemia and impaired DNA methylation, which may contribute to the pathogenesis of diseases like PCOS [56]. DNA methylation relies on nutritional inputs for one-carbon metabolic pathways including the efficient recycling of homocysteine [57].
Thus, every methyl donor affects the total methylation status of the system. Since all consumed methylations of every single substance participating in the one-carbon transfer must be recycled by itself, it is not sufficient to examine only the folate, sulfate and homocysteine pathway, but every individual regeneration pathway of each single coenzyme involved must be integrated into the overall consideration. Therefore, a reasonable approach in terms of the whole metabolism would be to increase the overall methylation status of the human organism without neglecting to add all essential cofactors in sufficient quantities. This might also be helpful in the treatment of diseases like severe acute respiratory syndrome coronavirus 2 (SARS-CoV-2): Present findings demonstrate an increased demand for methyl-groups in cases of SARS-CoV-2 [58]. The various symptoms experienced by patients with long COVID resemble a compromised methylation status as it is the case with vitamin B12 deficiency.
The rate-limiting enzyme of this one-carbon metabolism is methionine synthetase (MTR), which catalyzes the conversion of homocysteine to methionine. This reaction requires vitamin B12 in the methylated form as a cofactor. The volatile intermediate methylcobalamin passes its methyl group of 5-methyltetrahydrofolate (5-MeTHF) to Hcy, which enables the formation of methionine, a precursor for the universal methyl donor S-adenosylmethionine (SAM) [59].
In this study, we decided to use the biologically inactive substance cyanocobalamin as a counterpart to the natural vitamin B12 since this component is the most common manufactured form administered in medical applications and as ingredient for fortified foods [60]. The cyanide stabilizes cobalamin against degradation. In the human organism, cyanocobalamin has to be converted into the active coenzyme S-adenosylcobalamin (SAM), which is a coenzyme of methylmalonyl-CoA mutase and is involved in the amino acid and odd-chain fatty acid metabolism in mammalians, or into methylcobalamin, a coenzyme of methionine synthase, involved in the methionine biosynthesis [61,62]. For the treatment of vitamin B12 deficiency this cyano form is as suitable as, for example, methylcobalamin or adenosylcobalamin [63]. Although it makes no difference for the treatment of vitamin B12 deficiency, this lacking methyl group may possibly play a role in regard to the overall degree of methylation in the metabolism. Botanical preparations contain a mixture of different cobalamin variants, including methylcobalamin. A potential interpretation could be that the total methylation level of the plant-derived supplements is higher compared to the synthetic preparations. Maybe this fact contributes to the non-significant decrease of tHcy in group S. Possibly, the tHcy level in group S would be higher if methylcobalamin were used as additive.
This study is a pilot study with a limited number of participants. The deviations of the study at T1 in group S and the limited number of participants could be the reason why some trends did not reach significance at T2 and between the groups.
These results clearly demonstrate the co-action between nutritive and metabolic factors. An inadequate Hcy metabolism can be treated with physiologically dosed, regularly consumed B vitamin supplements, preferably from plant sources. A study with a larger collective is needed to gain more precise insights and to confirm the results.
Conclusion
This double-blind randomized clinical trial emphasizes the efficacy of low dose B-vitamin supplementation and its impact on regulation of the total blood homocysteine level. A diurnal consumption of a multi-B vitamin complex in a concentration that corresponds to about 2.5 times the recommended daily intake leads to an increase of serum B vitamin levels (pyridoxine, folic acid, and cobalamin). Therefore, this study was able to demonstrate that even these low doses are sufficient to cause pronounced measurable effects on the metabolic level. It is commonly known that pyridoxine, folic acid, and cobalamin have an immense influence on the homocysteine level, a key metabolite regulating the methylation status by intervening the methionine and cysteine metabolism. In accordance with the current state of science, the present study also confirmed that an increase in pyridoxine, folic acid, and cobalamin levels leads to a reduction in homocysteine levels. A B vitamin complex from botanical sources might even be more effective than a synthetically manufactured product because homocysteine levels of subjects who received the natural vitamin complex were significantly lowered after the study period of 6 weeks. Synthetically manufactured vitamins also led to a decrease of the subjects’ homocysteine levels, but the reduction was not significant.
Since this study was a pilot study with only a limited number of subjects, it is recommended to establish a subsequent clinical trial with a higher number of participants. Such a setup should hopefully minimize the large deviations at T1 in group S and facilitate the generation of subgroups and specific parameters like age, which could be included in the analysis.
In conclusion, it can be stated that the intake of low-dose B vitamins can be generally recommended, since on the one hand the side effect potential is negligible, but on the other hand the metabolic effects are distinct. These findings illuminate the impact of a low-dose B vitamin supplementation on the tHcy-level, which reflects the overall methylation state with consequences for regeneration and the degree of DNA methylation.
Authorship
Research conception and design: ML, BK and NF; statistical analysis of the data: KM; interpretation of the data: GM, DR, JH, KS, ML and NF. writing of the manuscript: DR, KM, GM, BK and NF.
Ethics and dissemination
Ethics approval was received from the local ethics committee on 22nd of March 2017 (EK 29-271 ex 16/17). The study was performed in accordance with the Declaration of Helsinki.
Clinical Trials Registry
NCT03444155. URL: http://www.clinicaltrials.gov.
Acknowledgements
Products were provided by vis vitalis gmbh (Salzburg).
Conflict of Interest
The authors declare no conflicts of interests.
References
- Ragsdale SW, Yi L, Bender G, Gupta N, Kung Y, et al. (2012) Redox, haem and CO in enzymatic catalysis and regulation. Biochem Soc Trans 40: 501–507. [Crossref]
- Kompis IM, Islam K, Then RL (2005) DNA and RNA synthesis: antifolates. Chem Rev 105: 593–620. [Crossref]
- Vance DE (2014) Phospholipid methylation in mammals: from biochemistry to physiological function. Biochim Biophys Acta 1838: 1477–1487. [Crossref]
- Barreiro EJ, Kümmerle AE, Fraga CAM (2011) The methylation effect in medicinal chemistry. Chem Rev 111: 5215–5246. [Crossref]
- Sueoka T, Koyama K, Hayashi G, Okamoto A (2018) Chemistry‐driven epigenetic investigation of histone and DNA modifications. Chem Rec 18: 1727–1744. [Crossref]
- Mandaviya PR, Stolk L, Heil SG (2014) Homocysteine and DNA methylation: a review of animal and human literature. Mol Genet Metab 113: 243–252. [Crossref]
- McCully KS (2015) Homocysteine and the pathogenesis of atherosclerosis. Expert Rev Clin Pharmacol 8: 211–219. [Crossref]
- Lai WKC, Kan MY (2015) Homocysteine-induced endothelial dysfunction. Ann Nutr Metab 67: 1–12. [Crossref]
- Selhub J (2006) The many facets of hyperhomocysteinemia: studies from the Framingham cohorts. J Nutr 136: 1726S-1730S. [Crossref]
- Wright CB, Paik MC, Brown TR, Stabler SP, Allen RH, et al. (2005) Total homocysteine is associated with white matter hyperintensity volume: The Northern Manhattan Study. Stroke 36: 1207–1211. [Crossref]
- Aisen PS, Schneider LS, Sano M, Diaz-Arrastia R, Van Dyck CH, et al. (2008) High-dose B vitamin supplementation and cognitive decline in Alzheimer disease: a randomized controlled trial. JAMA 300: 1774–1783. [Crossref]
- Malouf R, Evans JG, Sastre AA (2003) Folic acid with or without vitamin B12 for cognition and dementia. Cochrane Database Syst Rev 4: CD004514. [Crossref]
- Smith AD, Refsum H, Bottiglieri T, Fenech M, Hooshmand B, et al. (2018) Homocysteine and dementia: an international consensus statement. J Alzheimers Dis 62: 561–570. [Crossref]
- McCaddon A, Miller JW (2015) Assessing the association between homocysteine and cognition: reflections on Bradford Hill, meta-analyses, and causality. Nutrition Rev 73: 723–735.
- Ramsaransing GSM, Fokkema MR, Teelken A, Arutjunyan AV, Koch M, et al. (2006) Plasma homocysteine levels in multiple sclerosis. J Neurol Neurosurg Psychiatry 77: 189–192. [Crossref]
- Ajith TA, Ranimenon (2015) Homocysteine in ocular diseases. Clin Chim Acta 450: 316–321. [Crossref]
- Choi SW, Friso S, Ghandour H, Bagley PJ, Selhub J, et al. (2004) Vitamin B-12 deficiency induces anomalies of base substitution and methylation in the DNA of rat colonic epithelium. J Nutr 134: 750-755. [Crossref]
- Fernandez-Roig S, Lai SC, Murphy MM, Fernandez-Ballart J, Quadros EV (2012) Vitamin B12 deficiency in the brain leads to DNA hypomethylation in the TCblR/CD320 knockout mouse. Nutr Metab (Lond). 9: 41. [Crossref]
- Jacob RA, Gretz DM, Taylor PC, James SJ, Pogribny IP, et al. (2012) Moderate folate depletion increases plasma homocysteine and decreases lymphocyte DNA methylation in postmenopausal women. J Nutr 1204–1212. [Crossref]
- Adaikalakoteswari A, Finer S, Voyias PD, McCarthy CM, Vatish M, et al. (2015) Vitamin B12 insufficiency induces cholesterol biosynthesis by limiting s-adenosylmethionine and modulating the methylation of SREBF1 and LDLR genes. Clin Epigenet 7: 14.
- Cui S, Li W, Lv X, Wang P, Gao Y, et al. (2017) Folic Acid Supplementation Delays Atherosclerotic Lesion Development by Modulating MCP1 and VEGF DNA Methylation Levels In Vivo and In Vitro. Int J Mol Sci 18: 990. [Crossref]
- Kumar A, Misra S, Nair P, Algahtany M (2021) Epigenetics mechanisms in ischemic stroke: a promising avenue? J Stroke Cerebrovasc Dis 30: 105690. [Crossref]
- Zeng M., Zhe, J., Zheng X, Qiu H., Xu X, et.al. (2020) The role of DNA methylation in ischemic stroke: a systematic review. Front Neurol 11: 566124. [Crossref]
- Li W, Shuchuan L, Zhendong S, Rongchao C, Xiuping B, et al. (2014) LINE-1 hypomethylation is associated with the risk of coronary heart disease in Chinese population. Arq Bras Cardiol 102: 481–488. [Crossref]
- Lin RT, Hsi E, Lin HF, Liao YC, Wang YS, et al. (2014) LINE-1 methylation is associated with an increased risk of ischemic stroke in men. Curr Neurovasc Res 11: 4–9. [Crossref]
- Ilango S, Paital B, Jayachandran P, Padma PR, Nirmaladevi R (2020) Epigenetic alterations in cancer. Front Biosci (Landmark Ed) 25: 1058-1109. [Crossref]
- Chen RZ, Pettersson U, Beard C, Jackson-Grusby L, Jaenisch R (1998) DNA hypomethylation leads to elevated mutation rates. Nature 395: 89-93. [Crossref]
- Jaenisch R, Bird A (2003) Epigenetic regulation of gene expression: how the genome integrates intrinsic and environmental signals. Nat Genet 33: 245-254.
- Ford TC, Downey LA, Simpson T, McPhee G, Oliver C, et al. (2018) The effect of a high-dose vitamin B multivitamin supplement on the relationship between brain metabolism and blood biomarkers of oxidative stress: a randomized control trial. Nutrients 10: 1860. [Crossref]
- Lai WKC, Kan MY (2015) Homocysteine-induced endothelial dysfunction. Ann Nutr Metab 67: 1–12. [Crossref]
- Zhang SM, Cook NR, Albert CM, Gaziano JM, Buring JE, et al. (2008) Effect of combined folic acid, vitamin B6, and vitamin B12 on cancer risk in women: a randomized trial. JAMA 300: 2012–2021. [Crossref]
- Schnyder G, Roffi M, Flammer Y, Pin R, Hess OM (2002) Effect of homocysteine-lowering therapy with folic acid, vitamin B12, and vitamin B6 on clinical outcome after percutaneous coronary intervention: the Swiss Heart study: a randomized controlled trial. JAMA 288: 973–979. [Crossref]
- Zhu J, Chen C, Lu L, Yang K, Reis J, et al. (2020) Intakes of folate, vitamin B6, and vitamin B12 in relation to diabetes incidence among american young adults: A 30-year follow-up study. Diabetes Care 43: 2426–2434. [Crossref]
- Snow G (2019) Blockrand: randomization for block random clinical trials. R package version 13.
- Architect System. Folate – Principle of the method, 2010.
- Architect System. B12 – Principle of the method, 2010.
- Architect System. Homocysteine – Principle of the method, 2008.
- Recipe. Instruction Manual. ClinRep® HPLC Complete Kit. Vitamins B1, B2 and B6 in Plasma/whole blood Dessauerstraße 3, 80992 Munich / Germany.
- Judith H (2010) B vitamins and the risk of total mortality and cardiovascular disease in end-stage renal disease: results of a randomized controlled trial. Circulation 121: 1432–1438. [Crossref]
- Rybak ME, Jain RB, Pfeiffer CM (2005) Clinical vitamin B6 analysis: an interlaboratory comparison of pyridoxal 5′-phosphate measurements in serum. Clin Chem 51: 1223-1231. [Crossref]
- Stanger O, Semmelrock HJ, Wonisch W, Bös U, Pabst E, et al. (2002) Effects of folate treatment and homocysteine lowering on resistance vessel reactivity in atherosclerotic subjects. J Pharmacol Exp Ther 300: 158–162. [Crossref]
- Smith AD, Smith SM, De Jager CA, Whitbread P, Johnston C, et al. (2010) Homocysteine-lowering by B vitamins slows the rate of accelerated brain atrophy in mild cognitive impairment: a randomized controlled trial. PLoS One 5: e12244. [Crossref]
- Zaric BL, Obradovic M, Bajic V, Haidara MA, Jovanovic M, et al. (2019) Homocysteine and hyperhomocysteinaemia. Curr Med Chem 26: 2948–2961. [Crossref]
- Abosamak NER, Gupta V (2022) Vitamin B6 (pyridoxine). In: StatPearls [Internet]. Treasure Island (FL): StatPearls Publishing. [Crossref]
- Sah S, Lahry K, Talwar C, Singh S, Varshney U (2004) Monomeric NADH-oxidizing methylenetetrahydrofolate reductases from Mycobacterium smegmatis lack flavin coenzyme. J Bacteriol 202: e00709- e007019. [Crossref]
- Schnell JR, Dyson HJ, Wright PE (2004) Structure, dynamics, and catalytic function of dihydrofolate reductase. Annu Rev Biophys Biomol Struct 33: 119–140. [Crossref]
- Leonardi R, Jackowski S (2007) Biosynthesis of pantothenic acid and coenzyme A. EcoSal Plus 2(2). [Crossref]
- Chawla J, Kvarnberg D (2014) Hydrosoluble vitamins. Handb Clin Neurol 120: 891–914. [Crossref]
- Pitzschke A, Fraundorfer A, Guggemos M, Fuchs N (2015) Antioxidative responses during germination in quinoa grown in vitamin B‐rich medium. Food Sci Nutr 3: 242–251. [Crossref]
- Wondrak GT, Jacobson EL (2012) Vitamin B6: beyond coenzyme functions. Subcell Biochem 56: 291–300. [Crossref]
- den Heijer M (2011) Vitamin B6 – Pyridoxine. Vitamins in the prevention of human diseases, In: Wolfgang Herrmann, Rima Obeid (Hrsg.): Vitamins in the Prevention of Human Diseases. Walter de Gruyter, ISBN 978-3-11-021448-2, 75.
- Alpers DH (2016) Absorption and blood/cellular transport of folate and cobalamin: Pharmacokinetic and physiological considerations. Biochimie 126: 52–56. [Crossref]
- Patel KR, Sobczyńska-Malefora A (2017) The adverse effects of an excessive folic acid intake. Eur J Clin Nutr 71: 159–163. [Crossref]
- Paul C, Brady DM (2017) Comparative Bioavailability and Utilization of Particular Forms of B12 Supplements with Potential to Mitigate B12-related Genetic Polymorphisms. Integr Med (Encinitas) 16: 42-49. [Crossref]
- James PT, Jawla O, Mohammed NI, Ceesay K, Akemokwe FM, et al. (2019) A novel nutritional supplement to reduce plasma homocysteine in nonpregnant women: A randomised controlled trial in The Gambia. PLoS Med 16: 1002870.
- Schiuma N, Costantino A, Bartolotti T, Dattilo M, Bini V, et al. (2020) Micronutrients in support to the one carbon cycle for the modulation of blood fasting homocysteine in PCOS women. J Endocrinol Invest 43: 779–786. [Crossref]
- Dominguez-Salas P, Moore SE, Baker MS, Bergen AW, Cox SE, et al. (2014) Maternal nutrition at conception modulates DNA methylation of human metastable epialleles. Nat Commun 5: 1–7. [Crossref]
- McCaddon A, Regland B (2021) COVID-19: A methyl-group assault? Med Hypotheses 149: 110543. [Crossref]
- Lyon P, Strippoli V, Fang B, Cimmino L (2020) B vitamins and one-carbon metabolism: implications in human health and disease. Nutrients 12: 2867. [Crossref]
- Ball GFM (2013) Bioavailability and analysis of vitamins in foods, Springer.
- Chen Z, Crippen K, Gulati S, Banerjee R (1994) Purification and kinetic mechanism of a mammalian methionine synthase from pig liver. J Biol Chem 269: 27193–27197. [Crossref]
- Fenton WA, Hack AM, Willard HF, Gertler A, Rosenberg LE (1982) Purification and properties of methylmalonyl coenzyme A mutase from human liver. Arch Biochem Biophys 214: 815–823. [Crossref]
- Obeid R, Fedosov SN, Nexo E (2015) Cobalamin coenzyme forms are not likely to be superior to cyano‐and hydroxyl‐cobalamin in prevention or treatment of cobalamin deficiency. Mol Nutr Food Res 59: 1364–1372. [Crossref]