Introduction: Colostomies are fashioned in children for several conditions majority of which are congenital colorectal disorders such as Hirschsprung’s disease and Anorectal malformations. Nutritional deficiencies may be seen in children with colostomies as a result of altered gut function, inadequate food intake and chronic anaemia. To mitigate the risk of poor outcome, identification of such nutritional deficits is warranted and this forms the basis of this study whose main objective was to assess the nutritional impact of colostomies in children.
Materials and methods: A descriptive case-control study was carried out in Kenyatta National Hospital between 2015 and 2017 where 80 participants in total were recruited. Children with colonic stomas were assigned as cases (n=40) and those without stomas as controls (n=40). Anthropometric indicators were used to assess the nutritional status of the both groups for comparison. Data was analysed and presented based on nutritional Z-scores.
Results: Wasting was significantly more prevalent among in the case group (22.5%) than in the control group (5%), OR = 5.52(95% CI 1.11-27.43), P = 0.037. There was no significant difference in the anthropometric measures of stunting and underweight between the cases and controls.
Conclusion: On the basis of both anthropometric measures, colostomies are associated with nutrition deficiencies in children. Identification of these deficits through active nutritional screening may mitigate the risk of poor outcome in children with colostomies.
nutritional impact, colostomy in children
Colonic stomas are fashioned in children for several conditions, the majority of these conditions are congenital colorectal disorders such as Hirschsprung’s disease (HSCD) and Ano-rectal malformations (ARM) [1]. The main principle behind the stoma is to divert stool away from the colonic or anorectal pathology as part of a staged procedure towards definitive surgery after which the stoma can be reversed.
Colostomies can affect the nutrition status of children in various ways. First, the stoma interrupts the normal gut function at the point where it is created, affecting the nature of output and the individual’s ability to absorb nutrients from food [2,3]. Second, the stomas are associated with recurrent trauma to the exposed mucosa and surrounding skin leading to chronic blood loss and anaemia which further worsens the nutrition state [1,4]. Finally, it is likely that the dietary intake of patients with stoma is not adequate due to underlying disease, socio-economic factors or as an attempt to adapt the stomal output to a manageable socially acceptable state [5,6].
The use of anthropometric indices has been validated by the world health organization (WHO) as guidelines for nutritional assessment in children [7]. Consequently, identification and correction of nutritional deficiencies in malnourished patients with colostomies would mitigate the risk of a poor outcome [8]. This forms the basis of this study whose main objective was to assess the nutritional impact of colostomies in children.
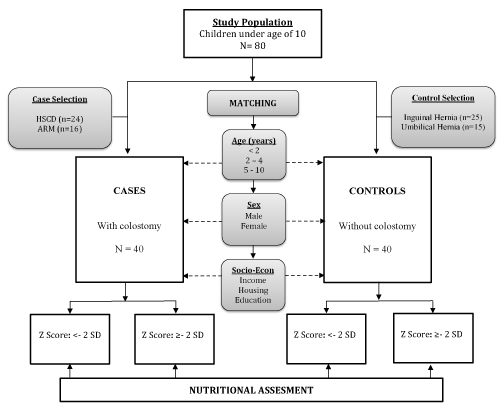
The study was a descriptive case-control study carried out between 2015 and 2017 which recruited subjects with colonic stomas as cases and subjects without colonic stomas as controls. The cases were subjects under the age of 10 with a diagnosis of HSCD and ARM who had colostomies fashioned for more than 30 days. The colostomy location was divided transverse for HSCD and divided sigmoid for ARM. The control group was selected from the clinic register of subjects with umbilical and inguinal hernias who were without colostomies and without other co-morbidities. Matching between the case and control group was done for age, sex and socioeconomic status. The participants definition and selection framework are illustrated in figure 1.

Figure 1. Methodological definition and selection framework of participants
The study setting was Kenyatta National Hospital, the largest tertiary referral hospital in Kenya. Data was collected by the principal investigator assisted by a hospital-based nutritionist.
The anthropometric indicators for stunting (height for age, HAZ); underweight (weight for age, WAZ) and wasting (weight for height, WHZ) were taken and plotted against the standard reference of the World Health Organization (WHO) and using the WHO AnthroPlus® program, version 3.2.2. The results were expressed as Z scores which denoted the number of standard deviations from the mean. Children with scores below -2 standard deviations (< -2 SD) were considered as having nutritional deficits [6]. In all subjects the weights and heights/lengths were taken by the scale from Measuretek® which was calibrated to an accuracy of 0.01 kgs and 0.1 cm (Figure 1).
Data analysis was performed in the Statistical Package for the Social Sciences program, version 21.0. (SPSS V.21.0, IBM) Descriptive analysis was conducted for both the case and control groups, and comparisons of the two groups conducted based on nutritional Z-scores. The Chi-square test, Fisher’s exact test and student T test were used to compare means and ascertain association among clinical variables. P-values, odds ratio (OR) and 95% confidence intervals (CI) were calculated where applicable. A p-value of less than 0.05 was considered significant.
Ethical approval was sought and granted by the KNH-UON Ethics and Research Committee. Reference No. P528/08/2015. Informed written consent was also obtained from parents/guardians of participants. All participants who were diagnosed with mal-nutritive states were referred to the relevant specialists for appropriate management.
Demographic data
A total of 80 paediatric surgical subjects were recruited in the study including 40 children with colostomies (cases) and 40 children without colostomies (controls). The mean age in years for the case and control groups was 4.46 and 4.58 respectively. The male to female ratio was 1.6:1 in both case and control groups. The demographics according to age, sex and socioeconomic status of both case and control groups are summarised in table 1.
Table 1. Demographic data of study participants
Demographic Data |
Cases |
Controls |
N=40 |
(%) |
N=40 |
(%) |
Age |
< 2 years |
9 |
22.5 |
10 |
25.0 |
2-4 years |
15 |
37.5 |
14 |
35.0 |
5-10 years |
16 |
40.0 |
16 |
40.0 |
Gender |
Male |
25 |
62.5 |
25 |
62.5 |
Female |
15 |
37.5 |
15 |
37.5 |
Monthly
Income |
< $ 50 |
30 |
75.0 |
23 |
57.5 |
$ 50 - $ 200 |
10 |
25.0 |
17 |
42.5 |
Housing |
Permanent |
16 |
40.0 |
17 |
42.5 |
Semi-permanent |
24 |
60.0 |
23 |
57.5 |
Level of education |
Primary |
12 |
30.0 |
10 |
25.0 |
Secondary |
24 |
60.0 |
26 |
65.0 |
Tertiary |
3 |
7.5 |
4 |
10.0 |
Table 1 shows the demographics according to age, sex and socioeconomic status of both case and control groups. The two groups have been matched for age and sex. The socioeconomic status of both groups is low with majority of parents/guardians having low income and living in semi-permanent housing.
Anthropometric data
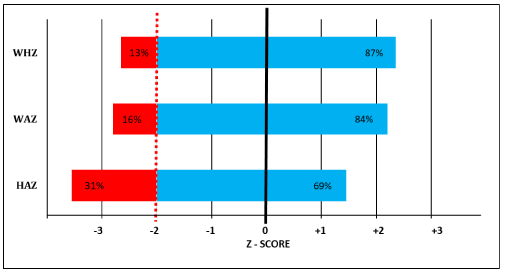
The distribution of study participants according to Z scores for weight for height (WHZ), weight for age (WAZ) and height for age (HAZ) are presented in figure 2. The cut off value (< -2SD was used to determine children with malnutrition. In general, the prevalence of malnutrition in the study population using the anthropometric indices of wasting i.e. WHZ, underweight i.e. WAZ and stunting i.e. HAZ was 13%, 16% and 31% respectively.

Figure 2. Distribution of participants according to Z scores
Wasting was significantly more prevalent among the case group (22.5%) than the control group (5%) OR = 5.52(95% CI 1.11-27.43), P = 0.037 (Table 2). There was however, no significant difference in association between the two groups with regard to measures of underweight (P = 0.762) or stunting (P = 0.809)
Table 2. Anthropometric measures among case and control groups
Anthropometric Measure |
Cases
N=40 (%) |
Control
N=40 (%) |
OR (95% CI) |
P value |
WHZ |
≥-2 SD |
31 (77.5) |
38 (95.0) |
1.00 (ref) |
0.037 |
<-2 SD (wasting) |
9 (22.5) |
2 (5.0) |
5.52 (1.11-27.43) |
WAZ |
≥-2 SD |
34 (85.0) |
33 (82.5) |
1.00 (ref) |
0.762 |
<-2 SD (underweight) |
6 (15.0) |
7 (17.5) |
0.83 (0.25-2.74) |
HAZ |
≥-2 SD |
27 (67.5) |
28 (70.0) |
1.00 (ref) |
0.809 |
<-2 SD (stunting) |
13 (32.5) |
12 (30.0) |
1.12 (0.44-2.89) |
WHZ: Weight for Height Z score. WAZ: Weight for Age Z score. HAZ: Height for age Z score.
OR: Odds Ratio. CI: Confidence Interval. -2 SD: below two standard deviations from mean
Table 2 shows the association between study groups and the anthropometric measures for weight for height, weight for age and height for age. Children with scores below (-2 SD) were defined as being wasted, underweight or stunted respectively. Wasting was significantly (P=0.037) seen among the case group as compared to controls.
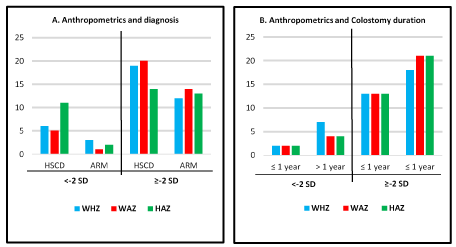
The anthropometric measures of children with colostomies were analysed against the primary diagnosis and the duration of colostomy (Figure 3). The mean colostomy duration was 12 months. There was no statistical difference seen in anthropometrics based on primary diagnosis and colostomy duration (Figure 3A). However, the children with HSCD were noted to have higher levels of stunting (P=0.058).

Figure 3. Anthropometrics based on primary diagnosis and colostomy duration
Anthropometric indices are used to measure nutritional imbalances. A low height for age (stunting) reflects long term cumulative effects of undernutrition. This measure can therefore be interpreted as an indication of poor environmental conditions or long-term restriction of a child's growth potential. A low weight for height (wasting) is a measure of acute malnutrition and can be interpreted as an indication of insufficient food intake and ongoing disease state. A low weight for age (underweight) is a composite indicator and can reflect both stunting and wasting and therefore difficult to interpret [6]. In this study the above indices showed significant nutritional deficiencies in subjects with colonic stomas. This was especially evident for wasting which as stated above is primarily a measure of acute malnutrition.
The prevalence of malnutrition in hospitalized patients from global literature varies between 19% to 32%. In a separate series on hospitalized children, the ranges for stunting, underweight and wasting were 18.2, 18.7% and 6.9% respectively. In Kenya the prevalence of malnutrition is generally higher as shown by data from the Kenya Demographic Health Survey and Kenya schools survey which report a prevalence of 24.5% - 35.3% for stunting and 14.9% - 16% for underweight and 9.7% for wasting [7-10]. The results from this study are somewhat similar to these figures with 31% stunting, 16% underweight and 13% wasting. The higher rates of malnutrition in Kenya are partly attributed to the low socioeconomic status among the general population which is reported in literature and also evident in our study [8,9].
Wasting was more prevalent among patients with colonic stomas. Conversely the prevalence of stunting and underweight was not significantly different among cases and controls. The WHO report that as opposed to stunting and underweight parameters, wasting is a direct measure of acute malnutrition and usually a consequence of insufficient food intake and high incidence of diarrhoeal disease [6]. There are a number of factors gathered from literature that may lead to wasting in patients with colostomies. First, there is altered gut physiology and function at the point of stoma fashioning leading to impaired digestion and absorption of nutrients that leads to diarrhoea and nutrient loss [1,2,3]. Secondly, children with underlying colorectal disease are at risk of undernutrition and growth impairment which is considered multifactorial due to chronic constipation, poor appetite, low socioeconomic status and improper dietary habits [4,5]. Third, colostomies are associated with peristomal skin excoriation and mucosal injury leading to chronic blood loss which further worsens the nutritive state [1,11,12]. Lastly, wasting may ensue after definitive surgery due to the metabolic response that usually presents a certain degree of caloric demand to prevent the ongoing catabolic state [13].
Children with HSCD suffer long term morbidity due to impaired gut function and motility as a pathophysiologic entity of the disease. This usually manifests as a consequence of chronic constipation, malabsorption, poor appetite and enterocolitis [14]. Therefore, it is expected that this pathology may be associated with chronic growth impairment and stunting which is evident from this study where a diagnosis HSCD was associated with higher levels of stunting as compared to ARM.
This study is not without limitations. The study sample size is not powered for sub-group analysis. Additionally, matching between cases and controls was done for a few variables, this is likely to introduce confounding from other variables which may bias the results. However, the evidence gathered from this study is adequate to generate hypothesis on further prospective studies on this subject.
Based on our findings we recommend nutritional screening with objective anthropometric measures of all paediatric surgical patients followed by relevant nutritional intervention especially in children with colonic stomas. Education on potential causes of malnutrition and preventive measures should be offered to all parents and guardians of these children. Lastly, nutritional supplements, haematinics and support programmes on colostomy care are important considerations in all children with stomas.
On the basis of anthropometric measures, colostomies are associated with nutritional deficiencies in children. Wasting was more prevalent in children with colostomies compared to children without. Identification of these deficits through active nutritional screening may mitigate the risk of poor outcome in children with colostomies.
University of Nairobi, Department of Surgery.
Kenyatta National Hospital, Department of specialized surgery.
None
None
- Chandramouli B, Srinivasan K, Jagdish S, Ananthakrishnan N (2004) Morbidity and mortality of colostomy and its closure in children. J Pediatr Surg 39: 596-599.
- Burch J (2006) Nutrition and the ostomate: input, output and absorption. Br J Community Nurs 11: 349-335. [Crossref]
- Akbulut G (2011) Nutrition in stoma patients: a practical view of dietary therapy. Int J Hematol Oncol 21: 61-66.
- WHO. Haemoglobin concentrations for the diagnosis of anaemia and assessment of severity. Vitamin and Mineral Nutrition Information System. Geneva, World Health Organization, 2011 Available online: http://www.who.int/vmnis/indicators/haemoglobin.
- Silva G, Bezerra Q, Siqueira M, Paranaguá T (2010) Influence of dietary habits in the social reintegration of a group of people with ostomy. Rev Eletr Enf 12: 56-62.
- Veras LV, Chotai PN, Tumen AZ, Gosain A (2018) Impaired growth outcomes in children with congenital colorectal diseases. J Surg Res 229: 102-107. [Crossref]
- WHO Multicentre Growth Reference Study Group: WHO Child Growth Standards: Length/ height-for-age, weight-for-age, weight-for-length, weight-for-height and body mass index-for-age: Methods and development. Geneva, World Health Organization, 2006. Available online: http://www.who. int/childgrowth/standards/technical_report/en/ index.html
- Von Meyenfeldt MF, Meijerink WJ, Rouflart MM, Builmaassen MT, Soeters PB (1992) Perioperative nutritional support: a randomized clinical trial. Clin Nutr 11: 180-186. [Crossref]
- Masibo PK, Makoka D (2012) Trends and determinants of undernutrition among young Kenyan children: Kenya Demographic and Health Survey; 1993, 1998, 2003 and 2008-2009. Public Health Nutr 15: 1715-27. [Crossref]
- Mwaniki W, Makokha N (2013) Nutrition status and associated factors among children in public primary schools in Dagoretti, Nairobi, Kenya. Afr Health Sci 13: 39-46. [Crossref]
- van den Hondel D, Sloots CE, Gischler SJ, Meeussen CJ, Wijnen RM (2013) Prospective long-term follow up of children with anorectal malformation: Growth and development until 5 years of age. J Pediatr Surg 48: 818-825. [Crossref]
- Egito B, Medeiros A, Moraes C, Barbosa JM (2013) Nutritional status of pediatric patients submitted to ostomy procedures. Rev Paul Pediatr 31: 58-64.
- Finnerty CC, Mabvuure NT, Ali A, Kozar RA, Herndon DN (2013) The surgically induced stress response. JPEN J Parenter Enteral Nutr 37: 21S-9S. [Crossref]
- Butler Tjaden NE, Trainor PA (2013) The developmental etiology and pathogenesis of Hirschsprung disease. Transl Res 162: 1-15. [Crossref]


